- Aggregated supply and demand

Содержание
- 2. Aggregate Demand (AD) Aggregate demand is the total demand for goods and services is an economic
- 3. AD shifts AD = C+I+G+NX change in consumption (eg cut tax) Or tax increasing Shifts in
- 4. Components of AS Consumer goods. Private consumer goods and services, such as motor vehicles, computers, clothes
- 5. Long-run Aggregate supply (LRAS) Supply = capability to produce Population growth Easy to find a job
- 6. Sort-run Aggregate Supply (SRAS) Rising the price – labor pool, work more, less vacation… Decreasing price
- 7. Summirising Aggregate supply is the total quantity of output firms will produce and sell – in
- 8. Equilibrium in the aggregate demand/aggregate supply model At a relatively low price level for output, firms
- 9. Price level: aggregate demand/aggregate supply Conclusions: the equilibrium is fairly far from where the AS curve
- 10. Example Bebebe. The imaginary country of Bebebe has the aggregate supply and aggregate demand curves given
- 11. How productivity growth shifts the AS curve Over time, productivity grows so that the same quantity
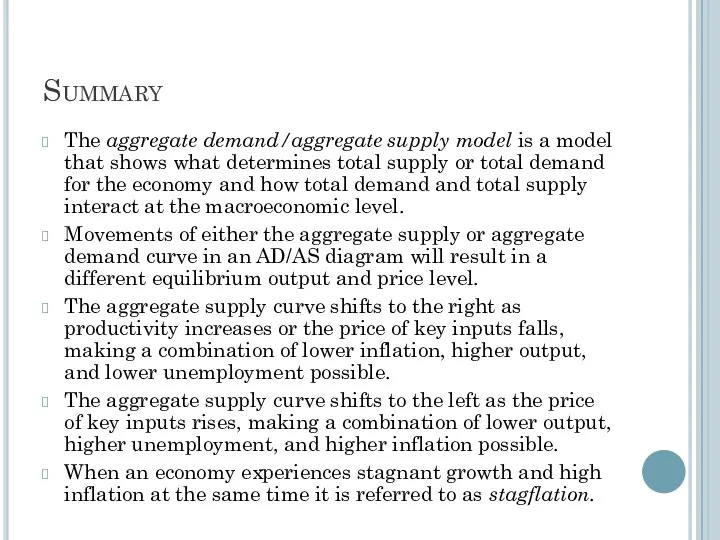
- 13. Summary The aggregate demand/aggregate supply model is a model that shows what determines total supply or
- 14. How do changes by consumers and firms affect AD? When consumers feel more confident about the
- 15. Government macroeconomic policy choices can shift AD. Take, for example, government spending–one component of AD. Higher
- 16. During a recession, when unemployment is high and many businesses are suffering low profits or even
- 18. Скачать презентацию

Aggregate Demand (AD)
Aggregate demand is the total demand for goods and
Aggregate Demand (AD)
Aggregate demand is the total demand for goods and

AD shifts
AD = C+I+G+NX
change in consumption (eg cut tax)
Or tax increasing
AD shifts
AD = C+I+G+NX
change in consumption (eg cut tax)
Or tax increasing

Components of AS
Consumer goods. Private consumer goods and services, such as motor
Components of AS
Consumer goods. Private consumer goods and services, such as motor

Long-run Aggregate supply (LRAS)
Supply = capability to produce
Population growth
Easy to find
Long-run Aggregate supply (LRAS)
Supply = capability to produce
Population growth
Easy to find
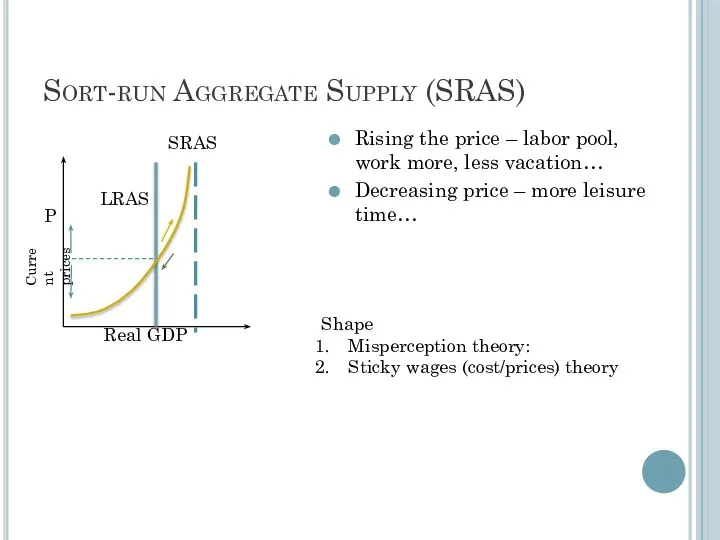
Sort-run Aggregate Supply (SRAS)
Rising the price – labor pool, work more,
Sort-run Aggregate Supply (SRAS)
Rising the price – labor pool, work more,

Summirising
Aggregate supply is the total quantity of output firms will produce and
Summirising
Aggregate supply is the total quantity of output firms will produce and

Equilibrium in the aggregate demand/aggregate supply model
At a relatively low price
Equilibrium in the aggregate demand/aggregate supply model
At a relatively low price
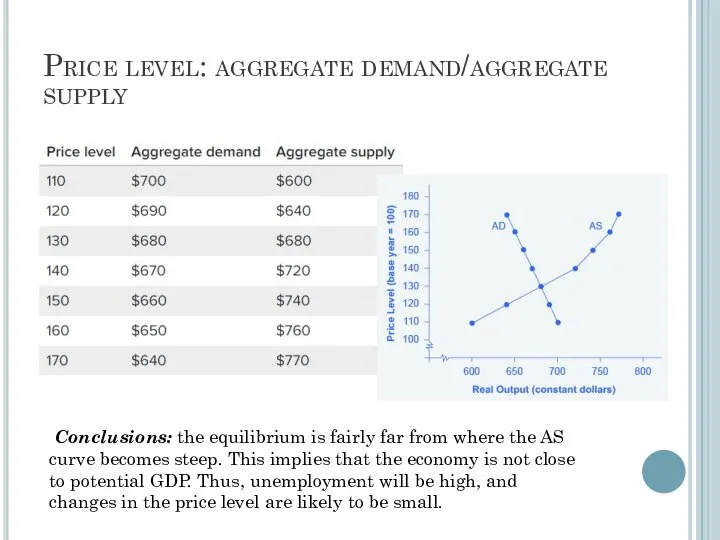
Price level: aggregate demand/aggregate supply
Conclusions: the equilibrium is fairly far from
Price level: aggregate demand/aggregate supply
Conclusions: the equilibrium is fairly far from

Example
Bebebe. The imaginary country of Bebebe has the aggregate supply and
Example
Bebebe. The imaginary country of Bebebe has the aggregate supply and

How productivity growth shifts the AS curve
Over time, productivity grows so
How productivity growth shifts the AS curve
Over time, productivity grows so

Summary
The aggregate demand/aggregate supply model is a model that shows what determines total
Summary
The aggregate demand/aggregate supply model is a model that shows what determines total

How do changes by consumers and firms affect AD?
When consumers feel
How do changes by consumers and firms affect AD?
When consumers feel
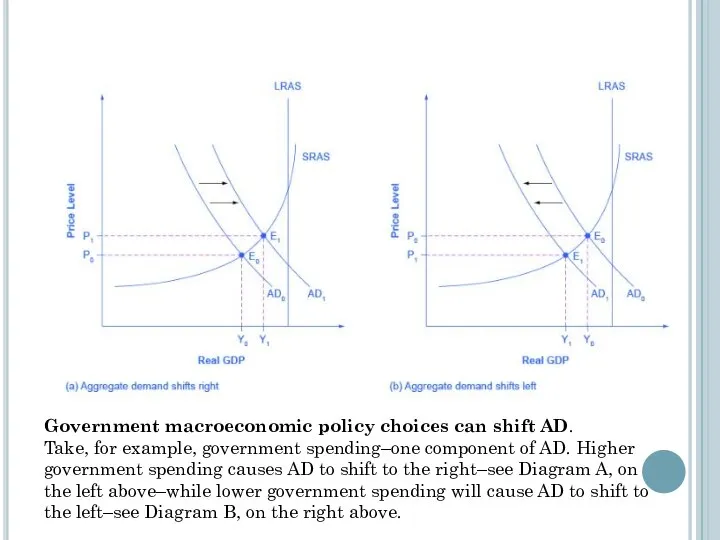
Government macroeconomic policy choices can shift AD.
Take, for example, government spending–one
Government macroeconomic policy choices can shift AD.
Take, for example, government spending–one

During a recession, when unemployment is high and many businesses are
During a recession, when unemployment is high and many businesses are
 Экономика. Искусство ведения хозяйства
 Оптимальное налогообложение
 Innovative Policy in Kazakhstan
 Мировое хозяйство
 Планирование объема продаж
 Итоги выполнения основных экономических показателей деятельности ФГУП «СВЯЗЬ - безопасность»
 Классическая рыночная модель
 Альтернативные модели совокупного предложения: модели SRAS-LRAS
 Основные понятия теории вероятности. (Лекция 3 по эконометрике)
 Сыбайлас жемқорлық
 Город будущего
 Анализ зарубежных рынков и стратегии проникновения
 Инфляция: причины и измерение. Виды инфляции
 Трансакционные издержки
 Қазақстан халқының өмір сүру деңгейі
 Економіко-географічна характеристика Німеччини
 Демографическое и экологическое влияние на сотрудничество в области распределения благ
 Построение линейных экономических моделей. Экономический анализ отчета по устойчивости
 Презентация Договорной режим имущества супругов
 Управляя изменениями. Как эффективно управлять изменениями в обществе, бизнесе и личной жизни
 Отбор бизнес-проектов для инвестирования
 Учёт и анализ движения, состояния и эффективности использования основных средств
 Презентация Характеристика и классификация ЧС техногенного характера и защита от них
 Организация и технология проведения экспертизы потребительских товаров на примере бумаги для печати
 Макроэкономические показатели в системе национальных счетов
 Эмиссия бумажных денег. Невидимые деньги
 Природокористування. Раціональне природокористування
 Модель экономического человека - неоклассическая школа