- Country Profile

Содержание
- 2. Chart of the TPES by source of energy 201_ Energy Portfolio for y Chart of the
- 3. Energy Flow Chart for ___________ 201_ (in _____ [specify units]) Oil Products Heat Electricity Generation REJECTED
- 4. Overview of Renewable Energy for ______________ (201X) Source: _________________________________
- 5. Energy Imports and Export for __________ (200_) Units Observation 1 Observation 2, etc. Source: _________________________________
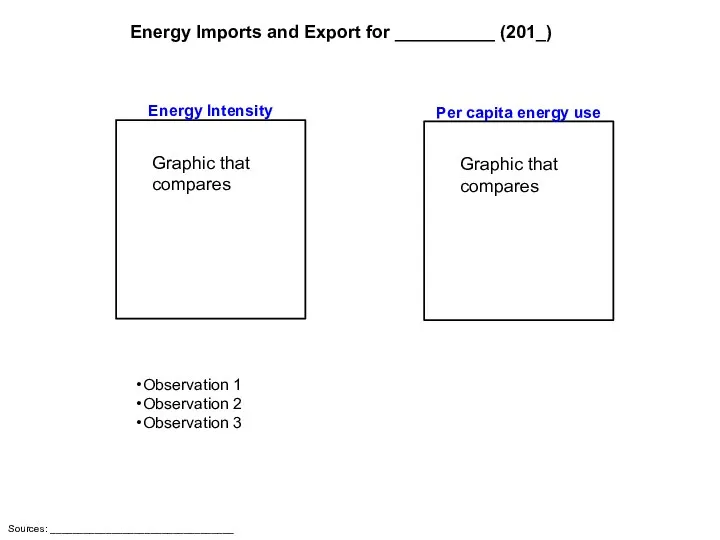
- 6. Graphic that compares Observation 1 Observation 2 Observation 3 Energy Intensity Graphic that compares Per capita
- 7. Graphic that compares to international prices for gasoline, natural gas, electricity, electricity prices for industry Observation
- 8. CO2/kWh and graph that compares that Observation 1 Observation 2 Observation 3 Efficiency of Generation N2O,
- 9. Number of supply sources (domestic & import)/ Diversity & graph comparing that Observation 1 Observation 2
- 11. Скачать презентацию
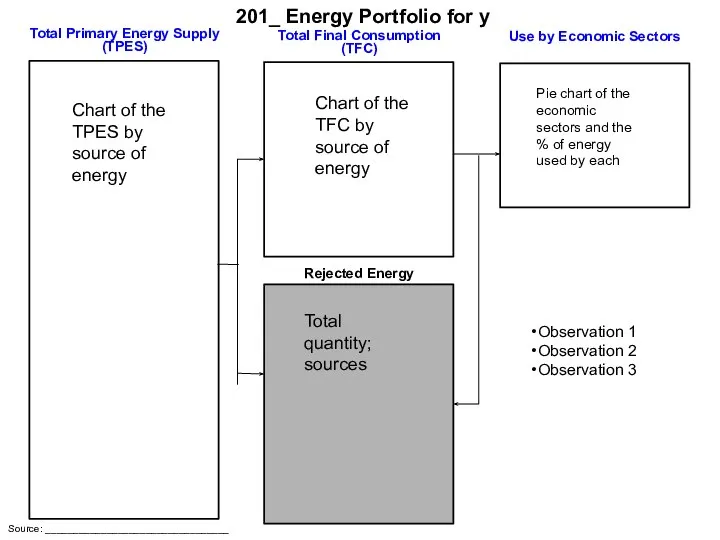
Chart of the TPES by source of energy
201_ Energy Portfolio for
Chart of the TPES by source of energy
201_ Energy Portfolio for
![Energy Flow Chart for ___________ 201_ (in _____ [specify units]) Oil](/_ipx/f_webp&q_80&fit_contain&s_1440x1080/imagesDir/jpg/750805/slide-2.jpg)
Energy Flow Chart for ___________
201_ (in _____ [specify units])
Oil Products
Heat
Electricity Generation
REJECTED
Energy Flow Chart for ___________
201_ (in _____ [specify units])
Oil Products
Heat
Electricity Generation
REJECTED

Overview of Renewable Energy for ______________ (201X)
Source: _________________________________
Overview of Renewable Energy for ______________ (201X)
Source: _________________________________
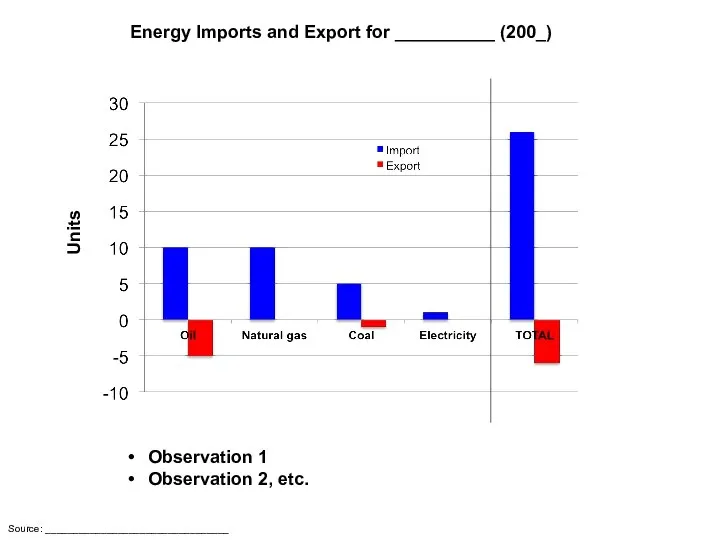
Energy Imports and Export for __________ (200_)
Units
Observation 1
Observation 2, etc.
Source: _________________________________
Energy Imports and Export for __________ (200_)
Units
Observation 1
Observation 2, etc.
Source: _________________________________
Graphic that compares
Observation 1
Observation 2
Observation 3
Energy Intensity
Graphic that compares
Per capita energy
Graphic that compares
Observation 1
Observation 2
Observation 3
Energy Intensity
Graphic that compares
Per capita energy

Graphic that compares to international prices for gasoline, natural gas, electricity,
Graphic that compares to international prices for gasoline, natural gas, electricity,

CO2/kWh and graph that compares that
Observation 1
Observation 2
Observation 3
Efficiency of Generation
N2O,
CO2/kWh and graph that compares that
Observation 1
Observation 2
Observation 3
Efficiency of Generation
N2O,
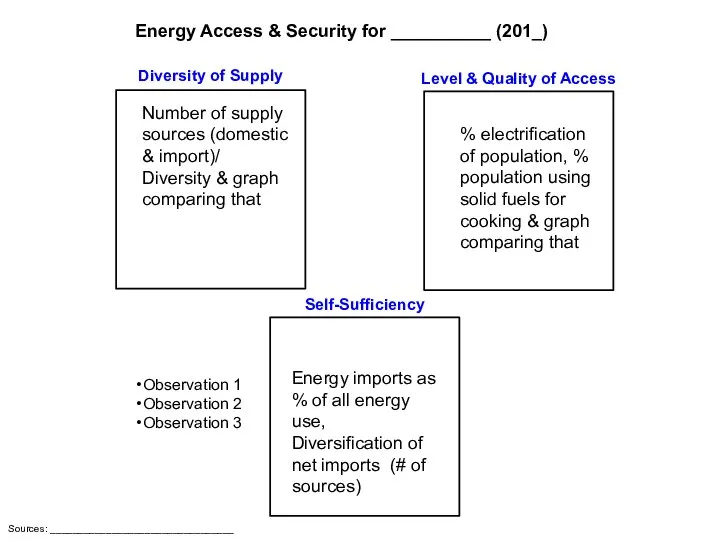
Number of supply sources (domestic & import)/ Diversity & graph comparing
Number of supply sources (domestic & import)/ Diversity & graph comparing
 Трубопроводный транспорт России
 Географическая экскурсия по странам Востока - презентация к уроку Географии_
 Народы, национальности, традиции. - презентация к уроку Географии
 Виды изображений земной поверхности и их особенности
 Belarus. The image of Belarus
 Торнадо в Северной Америке
 Викторина Наш Коми край
 Глобус – модель Земли
 Боливариа́нская Респу́блика (Венесуэла)
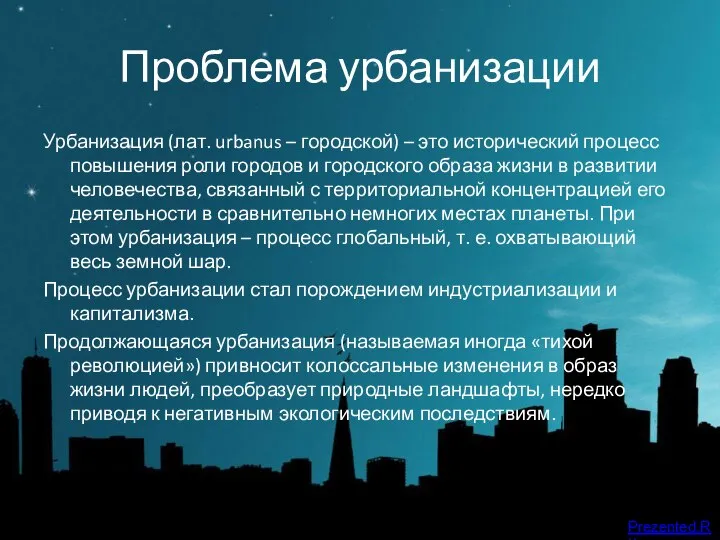 Проблема урбанизации Урбанизация (лат. urbanus – городской) – это исторический процесс повышения роли городов и городского образ
 Оптина Пустынь и духовное возрождение иеромонаха Василия Рослякова - презентация к уроку Географии_
 Ледники и айсберги
 Атмосферное давление - презентация к уроку Географии
 Иркутская область отмечает 75-летие - презентация к уроку Географии_
 Природное сообщество. Лес. 3 класс
 Бразилия
 Гіпотези появи води на Землі
 Хребет Черского
 Город Киров
 Атмосфера — газовая оболочка небесного тела
 Презентация на тему Животные Арктики
 Природоохоронні території України
 национальный состав населения - презентация к уроку Географии
 Общий обзор покрытосеменных растений. 6 класс
 Международные правила установления границ - презентация к уроку Географии_
 Французская республика
 Транспорт и мировое хозяйство. 10 класс
 Породы, слагающие земную кору - презентация к уроку Географии