- Empirical rule - Probabilities. Week 5 (1)

Содержание
- 2. Interpretation of summary statistics A random sample of people attended a recent soccer match. The summary
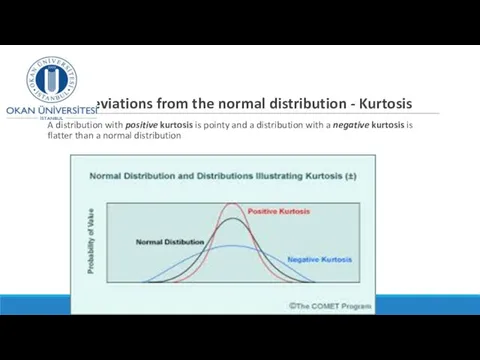
- 3. Deviations from the normal distribution - Kurtosis A distribution with positive kurtosis is pointy and a
- 4. Positively and negatively skewed Positive skewed is when the distribution is skewed to the right Negative
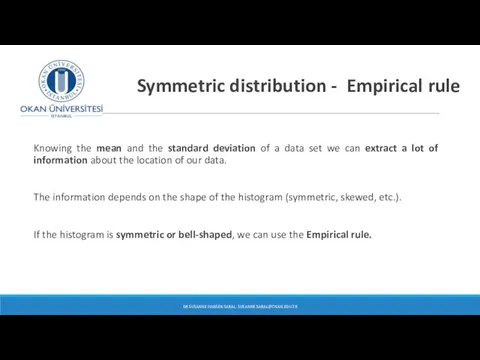
- 5. Symmetric distribution - Empirical rule Knowing the mean and the standard deviation of a data set
- 6. Probability as Area Under the Curve DR SUSANNE HANSEN SARAL Ch. 5- f(X) X μ 0.5
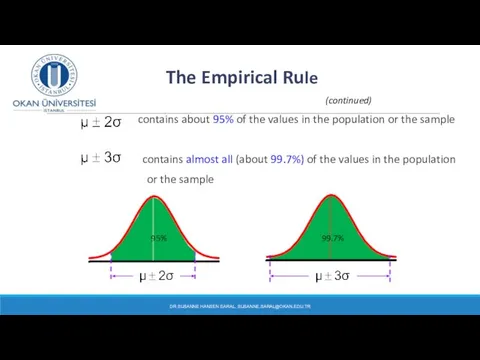
- 7. If the data distribution is symmetric/normal, then the interval: contains about 68% of the values in
- 8. contains about 95% of the values in the population or the sample contains almost all (about
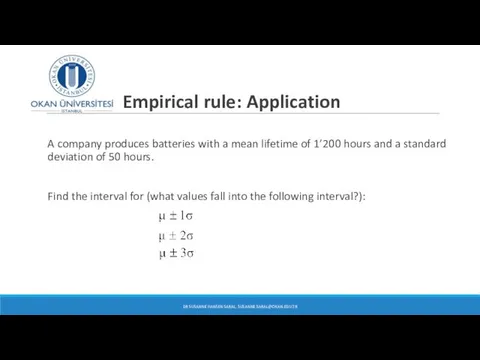
- 9. Empirical rule: Application A company produces batteries with a mean lifetime of 1’200 hours and a
- 10. Empirical rule: Application DR SUSANNE HANSEN SARAL, SUSANNE.SARAL@OKAN.EDU.TR
- 11. Interpretation of the Empirical rule: Lightbulb lifetime example If the shape of the distribution is normal,
- 12. Empirical rule exercise
- 13. Class quizz Empirical rule: (1) Which shape must the distribution have to be able to apply
- 14. Introduction to Probabilities DR SUSANNE HANSEN SARAL
- 15. Probability theory “Life would be simpler if we knew for certain what was going to happen
- 16. Definition of probability Probability is a numerical measure about the likelihood that an event will occur.
- 17. Probability and time Time Certainty Uncertainty Certainty runs over a short period of time and gradually
- 18. Probability and its measures: 2 basic rules Rule 1: Probability is measured over a range from
- 19. Probability and its measures 2 basic rules Certain uncertainty .5 1 0 Dr Susanne Hansen Saral
- 20. Probability rule 1 and 2 applied - example Rule 1: Probability is measured over a range
- 21. Probability and definitions Random experiment Sample space Sample point Event 2/28/2017
- 22. Random experiment In statistics a random experiment is a process that generates two or more possible,
- 23. All possible experimental outcomes constitute the sample space A sample space (S) of an experiment is
- 24. Sample space, S - Examples Random experiment: Flip a coin Possible outcomes: Head or tail The
- 25. Sample space, S - Examples Outcomes of a statistics course: The sample space: S = {AA,
- 26. Sample space - example The sample space, S = { Google, direct, Yahoo, MSN and all
- 27. Event An individual outcome of a sample space is called a simple event. An event is
- 28. Event: – subset of outcomes of a sample space, S Random experiment: Throw a dice (Turkish:
- 29. Event : Subset of outcomes of a sample space, S Random experiment: Grade marks on an
- 30. Events Intersection of Events – If A and B are two events in a sample space
- 31. Union of events Union of Events – If A and B are two events in a
- 32. Mutually exclusive event A and B are Mutually Exclusive Events if they have no basic outcomes
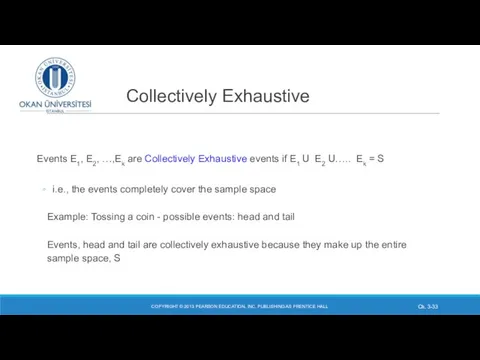
- 33. Collectively Exhaustive Events E1, E2, …,Ek are Collectively Exhaustive events if E1 U E2 U….. Ek
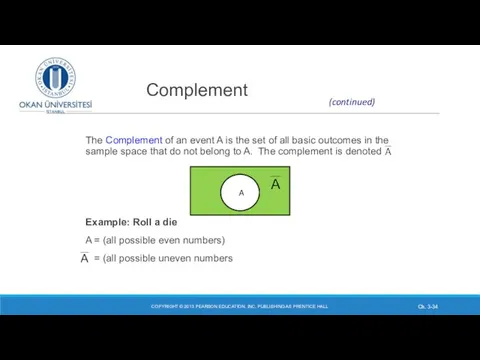
- 34. Complement The Complement of an event A is the set of all basic outcomes in the
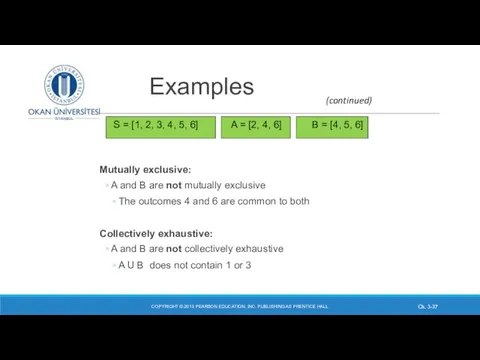
- 35. Examples Let the Sample Space be the collection of all possible outcomes of rolling one dice:
- 36. Examples – rolling a dice COPYRIGHT © 2013 PEARSON EDUCATION, INC. PUBLISHING AS PRENTICE HALL Ch.
- 37. Examples Mutually exclusive: A and B are not mutually exclusive The outcomes 4 and 6 are
- 38. Class exercise DR SUSANNE HANSEN SARAL
- 40. Скачать презентацию

Interpretation of summary statistics
A random sample of people attended a
Interpretation of summary statistics A random sample of people attended a
Deviations from the normal distribution - Kurtosis
A distribution with positive kurtosis
Deviations from the normal distribution - Kurtosis
A distribution with positive kurtosis

Positively and negatively skewed
Positive skewed is when the distribution is
Positively and negatively skewed
Positive skewed is when the distribution is
Symmetric distribution - Empirical rule
Knowing the mean and the standard
Symmetric distribution - Empirical rule
Knowing the mean and the standard

Probability as Area Under the Curve
DR SUSANNE HANSEN SARAL
Ch. 5-
f(X)
X
μ
0.5
0.5
The
Probability as Area Under the Curve
DR SUSANNE HANSEN SARAL
Ch. 5-
f(X)
X
μ
0.5
0.5
The

If the data distribution is symmetric/normal, then the interval:
contains about 68%
If the data distribution is symmetric/normal, then the interval:
contains about 68%
contains about 95% of the values in the population or
contains about 95% of the values in the population or
Empirical rule: Application
A company produces batteries with a mean lifetime
Empirical rule: Application
A company produces batteries with a mean lifetime
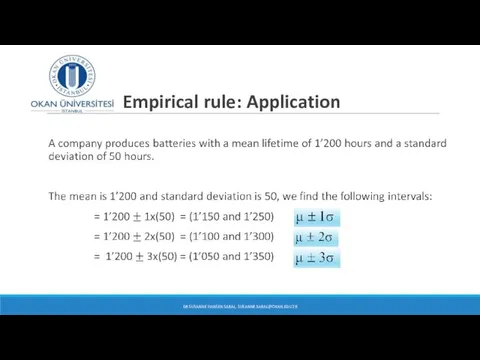
Empirical rule: Application
DR SUSANNE HANSEN SARAL, SUSANNE.SARAL@OKAN.EDU.TR
Empirical rule: Application
DR SUSANNE HANSEN SARAL, SUSANNE.SARAL@OKAN.EDU.TR

Interpretation of the Empirical rule: Lightbulb lifetime example
If the shape of
Interpretation of the Empirical rule: Lightbulb lifetime example
If the shape of
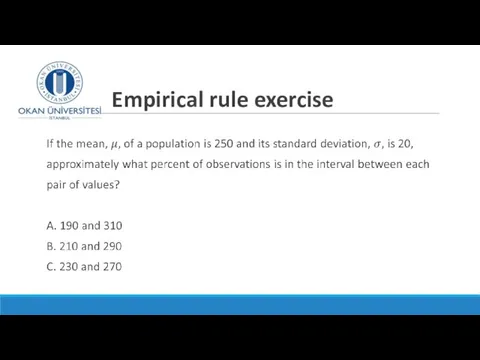
Empirical rule exercise
Empirical rule exercise

Class quizz
Empirical rule:
(1) Which shape must the distribution have to
Class quizz
Empirical rule:
(1) Which shape must the distribution have to
Introduction to Probabilities
DR SUSANNE HANSEN SARAL
Introduction to Probabilities
DR SUSANNE HANSEN SARAL

Probability theory
“Life would be simpler if we knew for certain
Probability theory
“Life would be simpler if we knew for certain

Definition of probability
Probability is a numerical measure about the
Definition of probability
Probability is a numerical measure about the
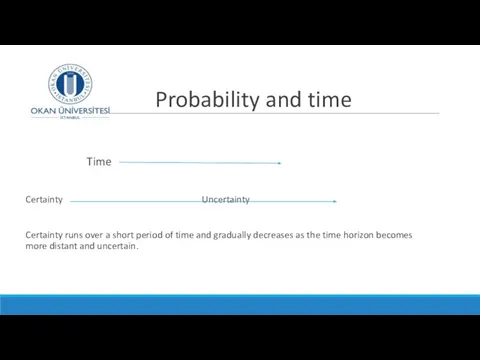
Probability and time
Time
Certainty Uncertainty
Certainty runs over a short
Probability and time
Time
Certainty Uncertainty
Certainty runs over a short

Probability and its measures: 2 basic rules
Rule 1:
Probability is measured
Probability and its measures: 2 basic rules
Rule 1:
Probability is measured
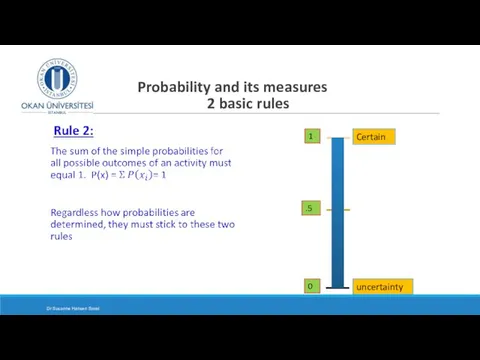
Probability and its measures
2 basic rules
Certain
uncertainty
.5
1
0
Dr Susanne Hansen Saral
Probability and its measures
2 basic rules
Certain
uncertainty
.5
1
0
Dr Susanne Hansen Saral

Probability rule 1 and 2 applied - example
Rule 1:
Probability is
Probability rule 1 and 2 applied - example
Rule 1:
Probability is
Probability and definitions
Random experiment
Sample space
Sample point
Probability and definitions
Random experiment
Sample space
Sample point

Random experiment
In statistics a random experiment is a process that
Random experiment
In statistics a random experiment is a process that
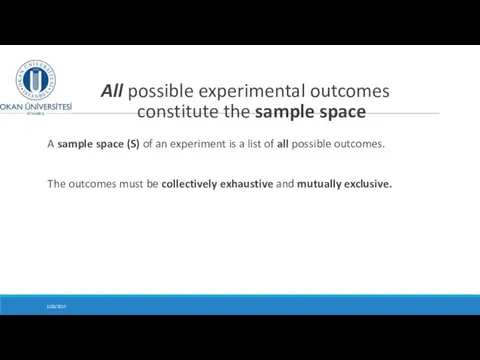
All possible experimental outcomes constitute the sample space
A sample
All possible experimental outcomes constitute the sample space
A sample

Sample space, S - Examples
Random experiment: Flip a coin
Possible outcomes:
Sample space, S - Examples
Random experiment: Flip a coin
Possible outcomes:

Sample space, S - Examples
Outcomes of a statistics course:
The sample
Sample space, S - Examples
Outcomes of a statistics course:
The sample
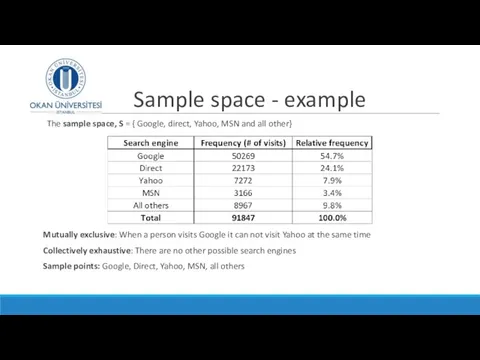
Sample space - example
The sample space, S = { Google,
Sample space - example
The sample space, S = { Google,

Event
An individual outcome of a sample space is called a
Event
An individual outcome of a sample space is called a

Event:
– subset of outcomes of a sample space, S
Random
Event:
– subset of outcomes of a sample space, S
Random
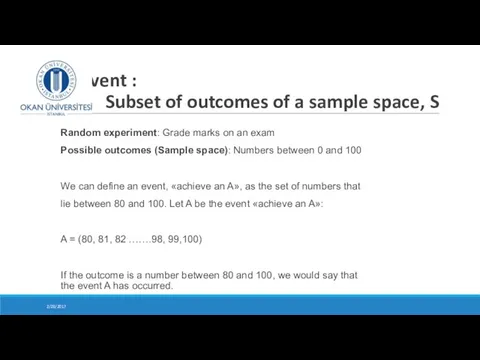
Event : Subset of outcomes of a sample space, S
Random
Event : Subset of outcomes of a sample space, S
Random

Events
Intersection of Events – If A and B are two
Events
Intersection of Events – If A and B are two

Union of events
Union of Events – If A and B are
Union of events
Union of Events – If A and B are

Mutually exclusive event
A and B are Mutually Exclusive Events if
Mutually exclusive event
A and B are Mutually Exclusive Events if
Collectively Exhaustive
Events E1, E2, …,Ek are Collectively Exhaustive events if E1
Collectively Exhaustive
Events E1, E2, …,Ek are Collectively Exhaustive events if E1
Complement
The Complement of an event A is the set of all
Complement
The Complement of an event A is the set of all

Examples
Let the Sample Space be the collection of all possible outcomes
Examples
Let the Sample Space be the collection of all possible outcomes

Examples – rolling a dice
COPYRIGHT © 2013 PEARSON EDUCATION, INC. PUBLISHING
Examples – rolling a dice
COPYRIGHT © 2013 PEARSON EDUCATION, INC. PUBLISHING
Examples
Mutually exclusive:
A and B are not mutually exclusive
The outcomes 4 and
Examples
Mutually exclusive:
A and B are not mutually exclusive
The outcomes 4 and
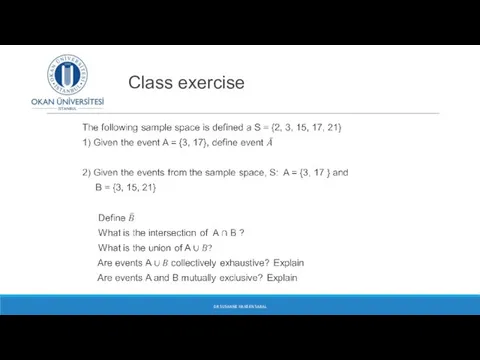
Class exercise
DR SUSANNE HANSEN SARAL
Class exercise
DR SUSANNE HANSEN SARAL
 Всё о треугольниках
 Понятие множества. Урок 1. 5 класс
 1-ден 10 дейінгі сандар
 Весёлые человечки спешат на помощь. Занятие для дошкольников
 Все действия с обыкновенными дробями
 Сложение рациональных чисел
 Задачи на проценты 2
 Цилиндр. Определение цилиндра, развёртка цилиндра, формулы для вычисления
 Сложение
 Признаки делимости на 9 и на 3 ( урок 2) математика 5 класс Учитель математики: Максиян О.В. МОУ Снежногорская СОШ
 Урок - КВН. Четырехугольники и их площади
 Обыкновенные дроби и действия с ними
 Признаки параллельности прямых. Тест. Задачи
 Проценты. Тест (5-6 класс)
 Не нужно нам владеть клинком, Не ищем славы громкой. Тот побеждает, кто знаком С искусством мыслить, тонким. Английский поэт Уордс
 Переменная. Имя величины
 Предел функции в точке
 Повторяем и обобщаем тему «ЛИНЕЙНАЯ ФУНКЦИЯ» Презентация по алгебре для 7 класса
  Цифры в загадках, пословицах и поговорках
 Сложение и вычитание чисел в пределах 100. (2 класс)
 Удивительный мир Симметрии
 Великие математики
 Числовые промежутки
 Математикалық ұғымдарды
 Тригонометрия. Вычисление и преобразование выражений. Занятие – консультация (11 класс)
 Презентация по математике "Дробные числительные" - скачать
  Устный счет
  Элементы статистической обработки данных. 7 класс