- Хорошие публикации

Содержание
- 2. Agenda Структура статьи, типичные ошибки Что первично: подбор журнала или написание статьи? Как понять интересна ли
- 3. О себе Профессор кафедры программной инженерии ИК Научные интересы: Мед. информатика, анализ данных, системы поддержки принятия
- 4. Структура статьи
- 5. Что и для кого мы публикуем Предмет исследования Цель to exchange the scientific knowledge to ask
- 6. IMRaD формат Introduction Methods Results and Discussion What problem was studied? What others and you did?
- 7. Introduction Begin by introducing the reader to the state of the art literature Important function: establish
- 8. Materials and Methods Main purpose: provide enough detail for competent worker to repeat study and reproduce
- 9. Results In the results section you present your findings: display items (figures and tables) are central
- 10. Discussion Now its time to interpret your results: Do they support your hypothesis? Are they in
- 11. Discussion – typical structure Statements of principal findings Strengths and weaknesses of your study Differences to
- 12. Conclusions – typical content Very brief revisit of the most important findings with a focus on
- 13. Типичные ошибки и проблемы
- 14. Как не нужно писать Вы сделали что-то впервые? Вы первый, кто занимается этой темой? У вашего
- 15. Основные ошибки Ссылаться только на себя или научного руководителя + классический учебник 1953 года Не сравнивать
- 16. Introduction – common mistakes A common mistake is to introduce authors and their areas of study
- 17. Results – common mistakes The results should be short and sweet. Do not say "It is
- 18. Discussion – common mistakes Discussion unrelated to the results Bad structure which meanders back and forth
- 19. Conclusions – common mistakes Copy and paste from other parts of the paper Treat it as
- 20. Avoid l o n g convoluted sentences "It is shown that area-averaged precipitation in “NoName” River
- 21. Что первично: подбор журнала или написание статьи?
- 22. What problem was studied? What others and you did? Your study area How do you did
- 23. Где публиковать?
- 24. Ведущие журналы
- 25. Как понять интересна ли статья мировой общественности или только автору? Как отличить действительно хорошую и перспективную
- 26. Хорошая статья Has exactly one, specific, thing to communicate a description of your new theory an
- 27. О чем писать статью О том, что вам интересно О том, что заботит научное сообщество О
- 28. Что читать Sciencedirect Pubmed WOS Scopus Читайте те журналы, где хотите публиковаться
- 29. Ответ на рецензии. Как правильно оформить ответ на рецензию? можно ли опровергнуть мнение рецензента?
- 30. Good practices Take your time to respond to the referees questions - The response to the
- 31. Общение с журналом Reviewer: 1 Comments to Author: Please provide sufficient comments to the author(s) to
- 32. Dear reviewers, Thank you very much for your valuable comments that helped to improve the manuscript.
- 33. Ракета Хирша http://rh.tpu.ru/
- 34. Управление Исследования Принятие решений Персонифицированность экспертных знаний Неполнота знаний предметной области Непроработанность стандартов Разнородность систем Региональная
- 35. Проекты Интеллектуальная информационная система мониторинга качества процесса оказания медицинской помощи и прогнозирования страховых выплат в рамках
- 36. Спасибо georgy.kopanitsa@gmail.com
- 37. Международные проекты
- 39. Как поучаствовать в проекте Что Вы можете предложить? Начните с малого Действуйте!
- 40. Варианты кооперации Совместный грант Работа в лаборатории
- 41. где искать партнеров и гранты https://www.researchgate.net/ https://www.daad.de
- 42. PhD
- 43. Зачем? Отличное начало научной карьеры Благосклонность работодателей Интересно и весело
- 44. Процесс защиты По совокупности трудов Диссертация 2 оппонента 3-4 месяца Совет 3-5 профессоров 3-4 месяца на
- 45. Что после защиты?
- 47. Скачать презентацию
Agenda
Структура статьи, типичные ошибки
Что первично: подбор журнала или написание статьи?
Как понять
Agenda
Структура статьи, типичные ошибки
Что первично: подбор журнала или написание статьи?
Как понять
О себе
Профессор кафедры программной инженерии ИК
Научные интересы:
Мед. информатика, анализ данных, системы
О себе
Профессор кафедры программной инженерии ИК
Научные интересы:
Мед. информатика, анализ данных, системы
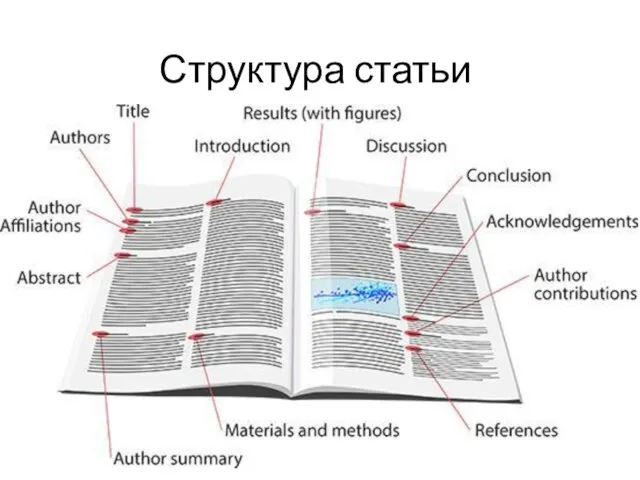
Структура статьи
Структура статьи
Что и для кого мы публикуем
Предмет исследования
Цель
to exchange the scientific knowledge
to
Что и для кого мы публикуем
Предмет исследования
Цель
to exchange the scientific knowledge
to

IMRaD формат
Introduction
Methods
Results and
Discussion
What problem was studied? What others and you did?
IMRaD формат
Introduction
Methods
Results and
Discussion
What problem was studied? What others and you did?
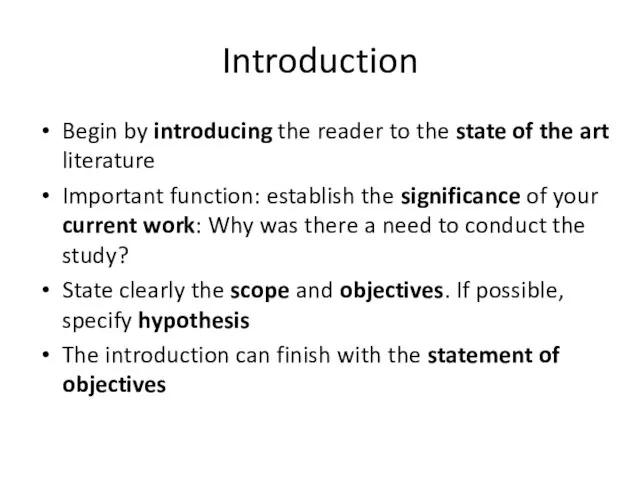
Introduction
Begin by introducing the reader to the state of the art
Introduction
Begin by introducing the reader to the state of the art
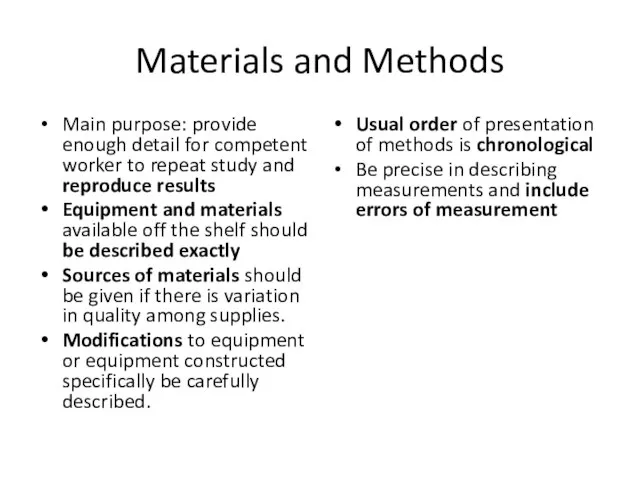
Materials and Methods
Main purpose: provide enough detail for competent worker to
Materials and Methods
Main purpose: provide enough detail for competent worker to
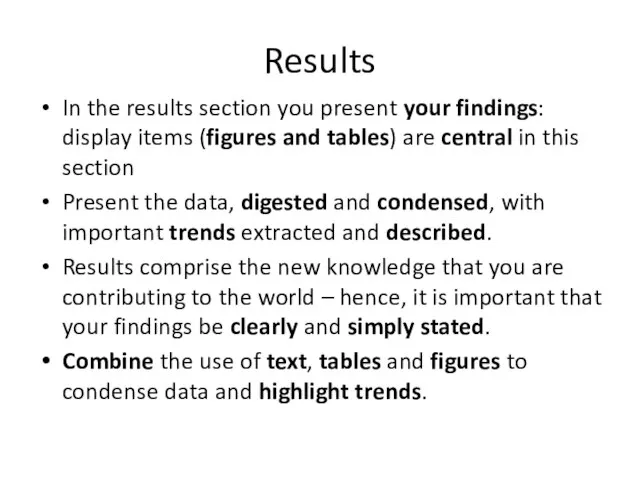
Results
In the results section you present your findings: display items (figures
Results
In the results section you present your findings: display items (figures
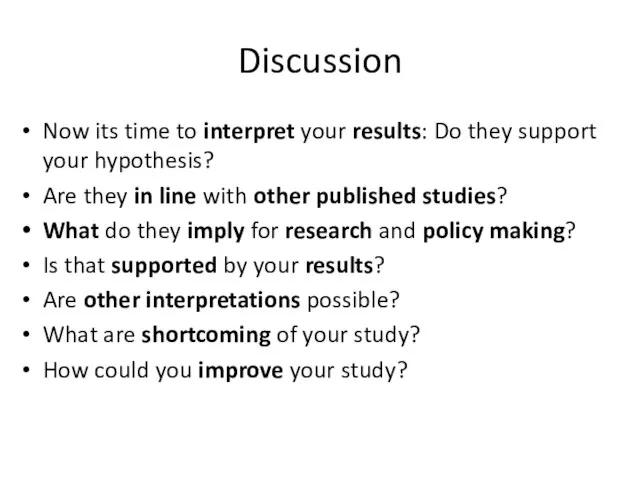
Discussion
Now its time to interpret your results: Do they support
Discussion
Now its time to interpret your results: Do they support
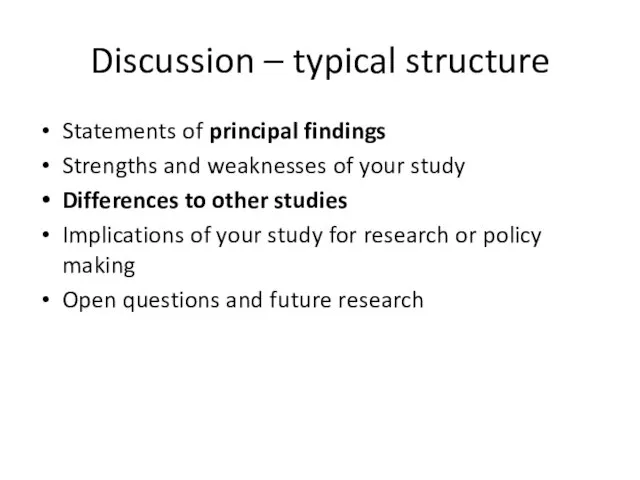
Discussion – typical structure
Statements of principal findings
Strengths and weaknesses of your
Discussion – typical structure
Statements of principal findings
Strengths and weaknesses of your
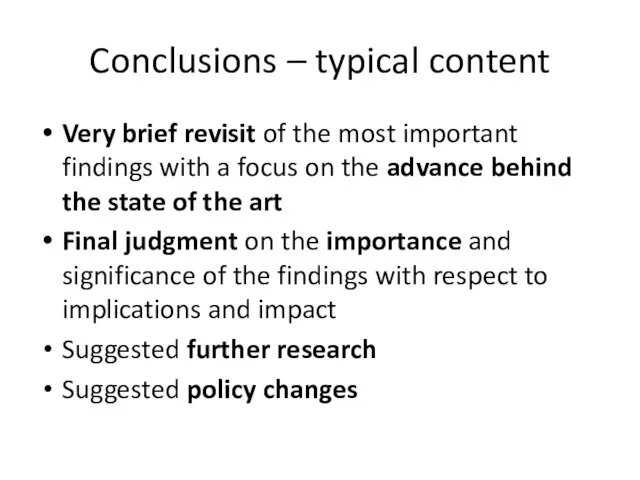
Conclusions – typical content
Very brief revisit of the most important findings
Conclusions – typical content
Very brief revisit of the most important findings

Типичные ошибки и проблемы
Типичные ошибки и проблемы
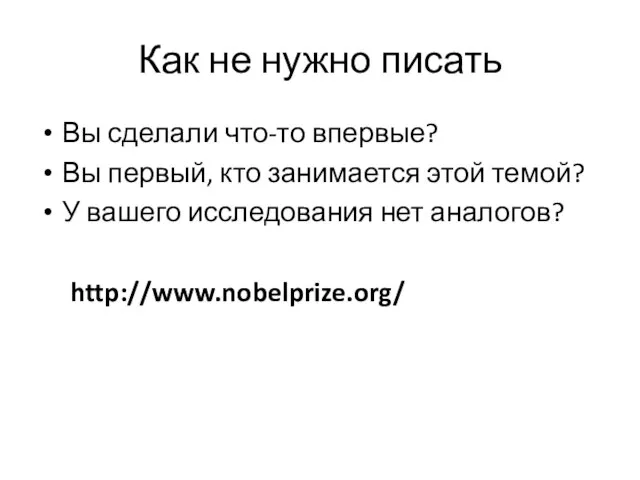
Как не нужно писать
Вы сделали что-то впервые?
Вы первый, кто занимается этой
Как не нужно писать
Вы сделали что-то впервые?
Вы первый, кто занимается этой
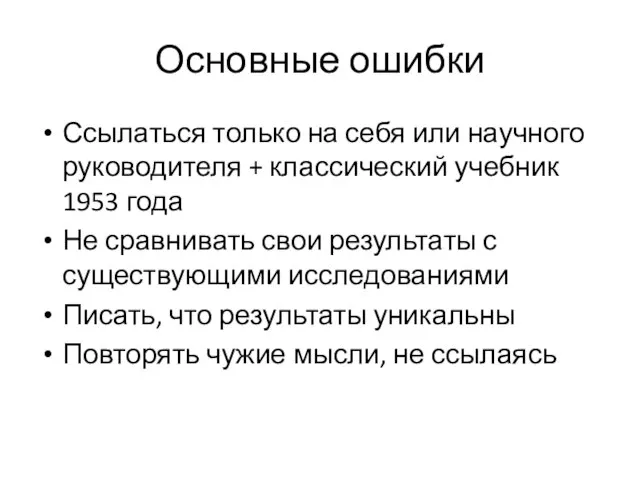
Основные ошибки
Ссылаться только на себя или научного руководителя + классический учебник
Основные ошибки
Ссылаться только на себя или научного руководителя + классический учебник
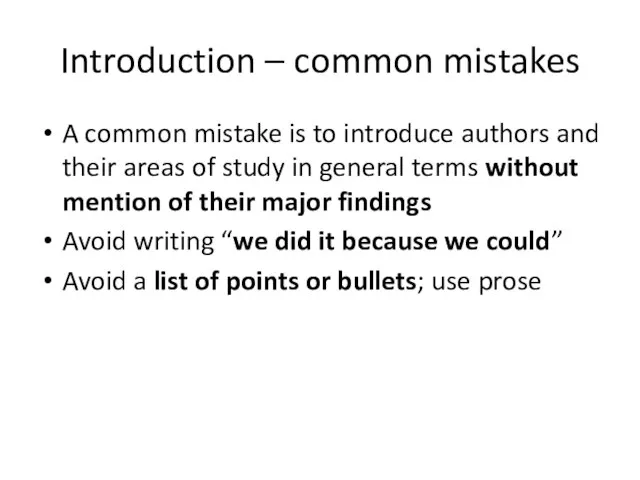
Introduction – common mistakes
A common mistake is to introduce authors and
Introduction – common mistakes
A common mistake is to introduce authors and
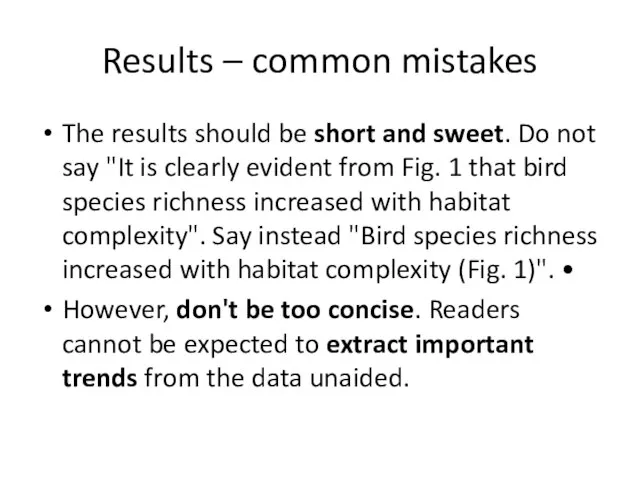
Results – common mistakes
The results should be short and sweet. Do
Results – common mistakes
The results should be short and sweet. Do
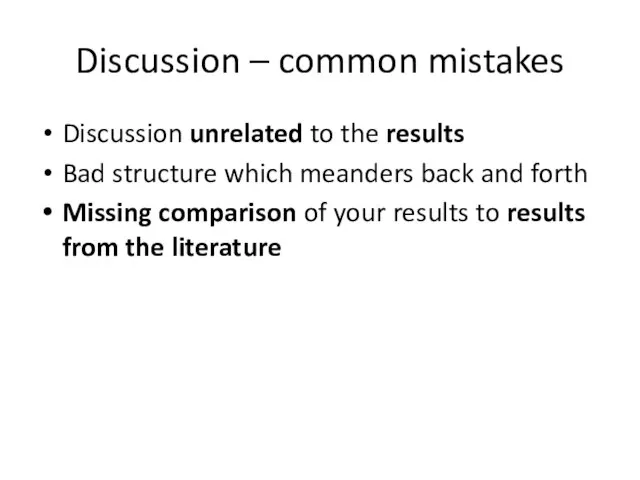
Discussion – common mistakes
Discussion unrelated to the results
Bad structure which meanders
Discussion – common mistakes
Discussion unrelated to the results
Bad structure which meanders
Conclusions – common mistakes
Copy and paste from other parts of the
Conclusions – common mistakes
Copy and paste from other parts of the
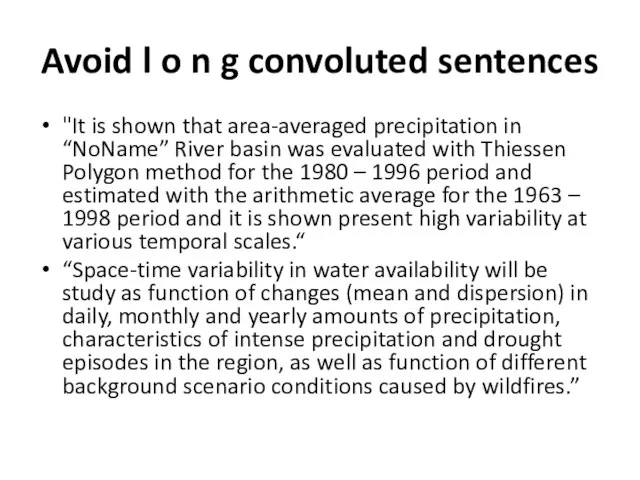
Avoid l o n g convoluted sentences
"It is shown that area-averaged
Avoid l o n g convoluted sentences
"It is shown that area-averaged

Что первично: подбор журнала или написание статьи?
Что первично: подбор журнала или написание статьи?
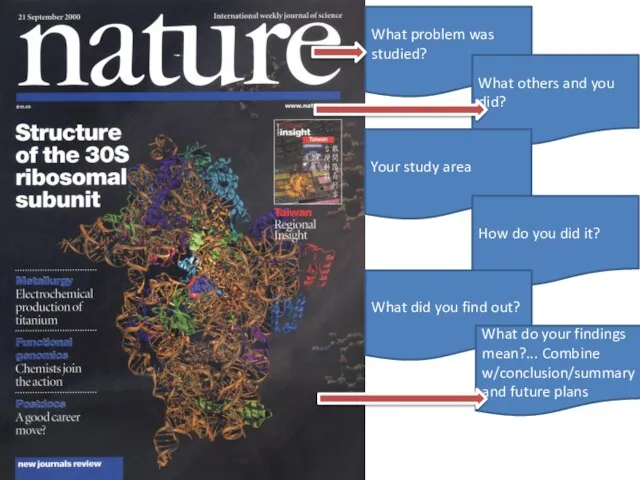
What problem was studied?
What others and you did?
Your study
What problem was studied?
What others and you did?
Your study
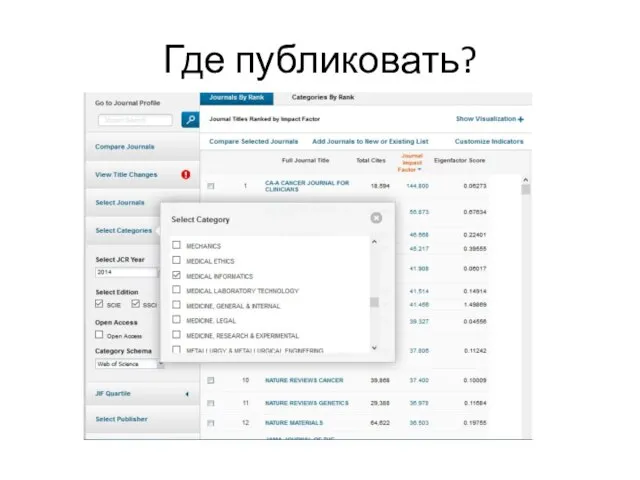
Где публиковать?
Где публиковать?
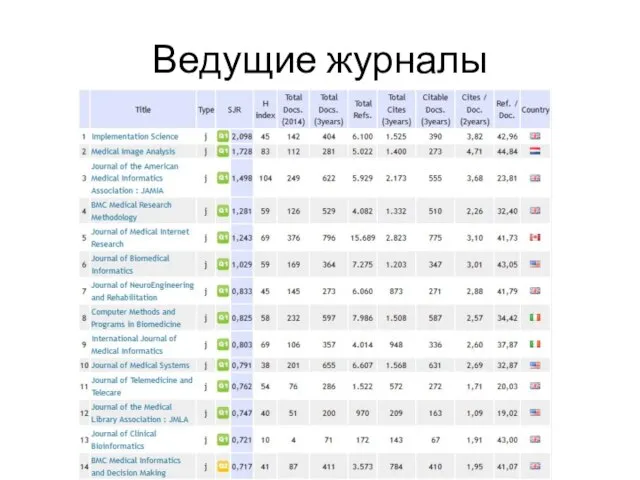
Ведущие журналы
Ведущие журналы
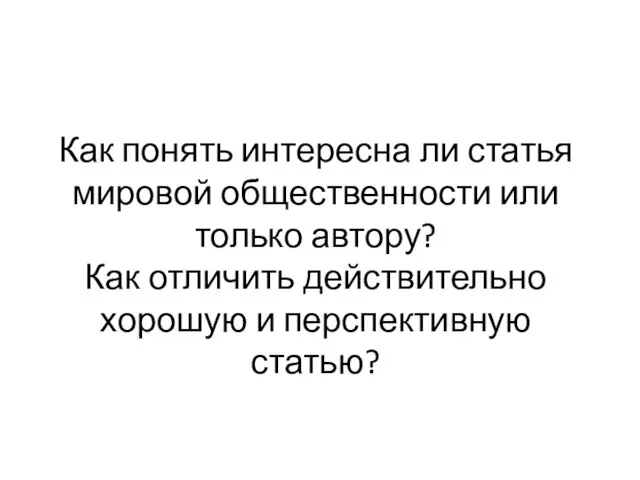
Как понять интересна ли статья мировой общественности или только автору?
Как отличить
Как понять интересна ли статья мировой общественности или только автору? Как отличить
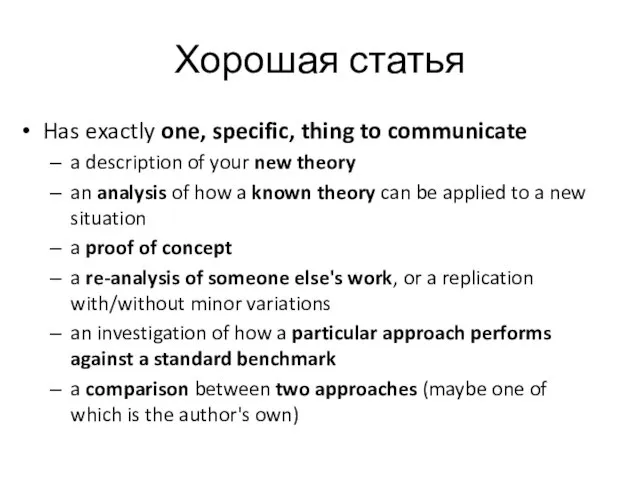
Хорошая статья
Has exactly one, specific, thing to communicate
a description of
Хорошая статья
Has exactly one, specific, thing to communicate
a description of
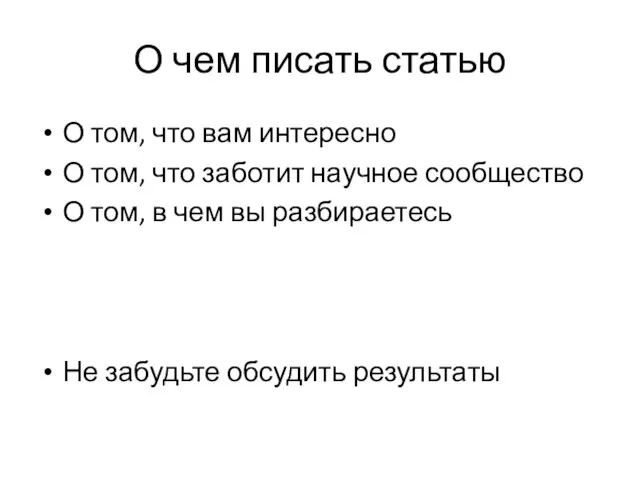
О чем писать статью
О том, что вам интересно
О том, что заботит
О чем писать статью
О том, что вам интересно
О том, что заботит
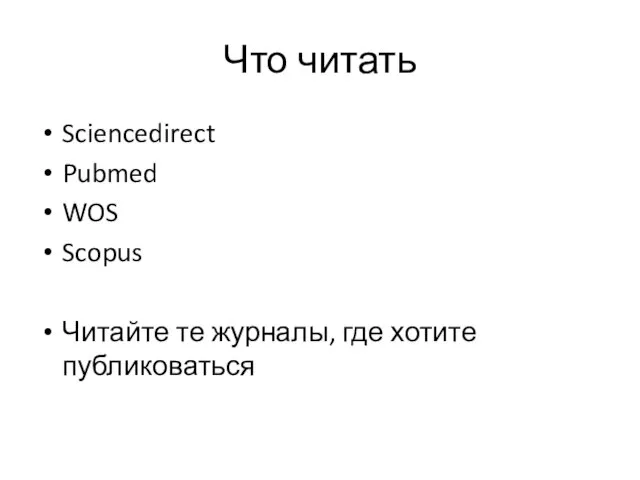
Что читать
Sciencedirect
Pubmed
WOS
Scopus
Читайте те журналы, где хотите публиковаться
Что читать
Sciencedirect
Pubmed
WOS
Scopus
Читайте те журналы, где хотите публиковаться
Ответ на рецензии. Как правильно оформить ответ на рецензию? можно ли
Ответ на рецензии. Как правильно оформить ответ на рецензию? можно ли
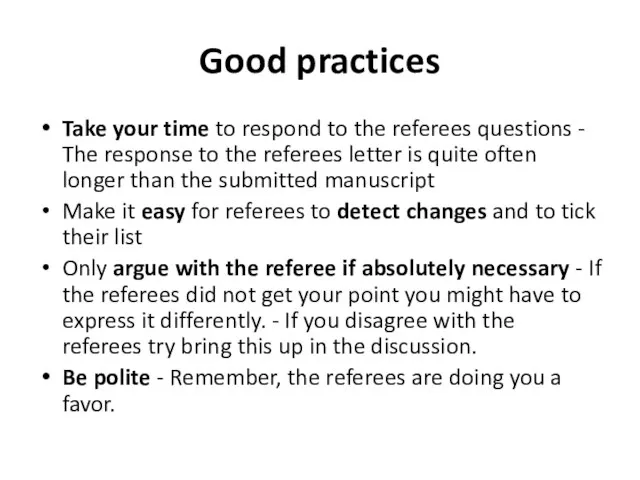
Good practices
Take your time to respond to the referees questions -
Good practices
Take your time to respond to the referees questions -

Общение с журналом
Reviewer: 1 Comments to Author: Please provide sufficient comments
Общение с журналом
Reviewer: 1 Comments to Author: Please provide sufficient comments
Dear reviewers,
Thank you very much for your valuable comments that
Dear reviewers,
Thank you very much for your valuable comments that

Ракета Хирша
http://rh.tpu.ru/
Ракета Хирша
http://rh.tpu.ru/
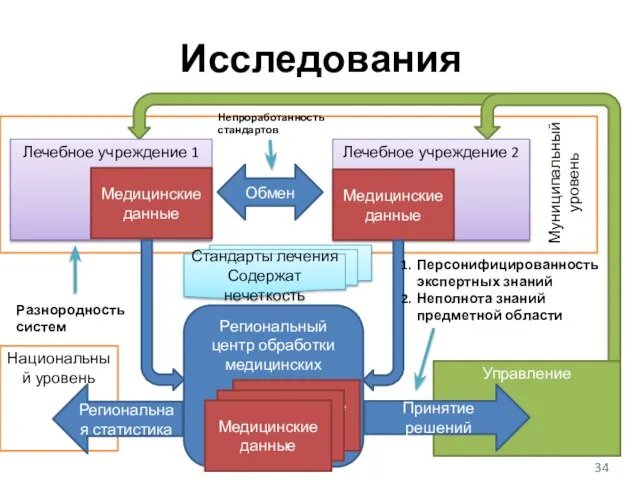
Управление
Исследования
Принятие решений
Персонифицированность экспертных знаний
Неполнота знаний предметной области
Непроработанность стандартов
Разнородность систем
Региональная статистика
Стандарты лечения
Содержат
Управление
Исследования
Принятие решений
Персонифицированность экспертных знаний
Неполнота знаний предметной области
Непроработанность стандартов
Разнородность систем
Региональная статистика
Стандарты лечения
Содержат
Проекты
Интеллектуальная информационная система мониторинга качества процесса оказания медицинской помощи и прогнозирования
Проекты
Интеллектуальная информационная система мониторинга качества процесса оказания медицинской помощи и прогнозирования
Спасибо
georgy.kopanitsa@gmail.com
Спасибо
georgy.kopanitsa@gmail.com

Международные проекты
Международные проекты


Как поучаствовать в проекте
Что Вы можете предложить?
Начните с малого
Действуйте!
Как поучаствовать в проекте
Что Вы можете предложить?
Начните с малого
Действуйте!
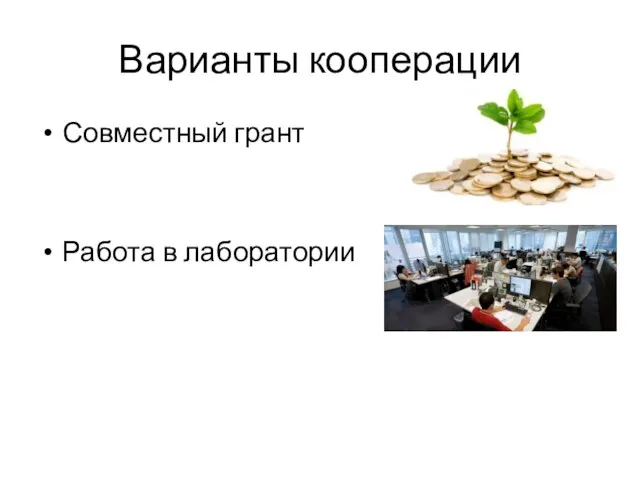
Варианты кооперации
Совместный грант
Работа в лаборатории
Варианты кооперации
Совместный грант
Работа в лаборатории
где искать партнеров и гранты
https://www.researchgate.net/
https://www.daad.de
где искать партнеров и гранты
https://www.researchgate.net/
https://www.daad.de

PhD
PhD
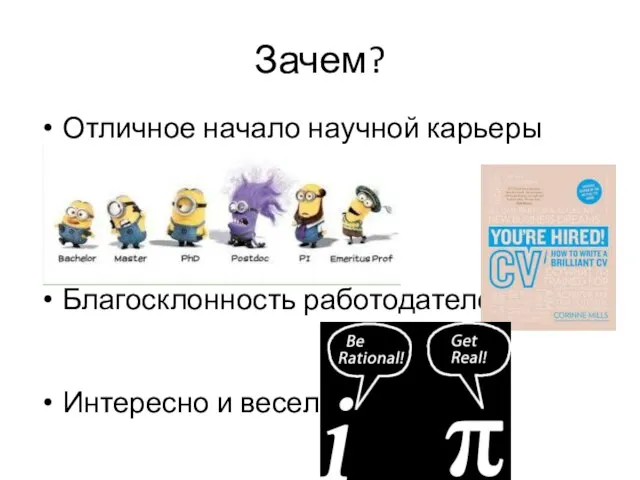
Зачем?
Отличное начало научной карьеры
Благосклонность работодателей
Интересно и весело
Зачем?
Отличное начало научной карьеры
Благосклонность работодателей
Интересно и весело
Процесс защиты
По совокупности трудов
Диссертация
2 оппонента 3-4 месяца
Совет 3-5 профессоров
3-4 месяца
Процесс защиты
По совокупности трудов
Диссертация
2 оппонента 3-4 месяца
Совет 3-5 профессоров
3-4 месяца
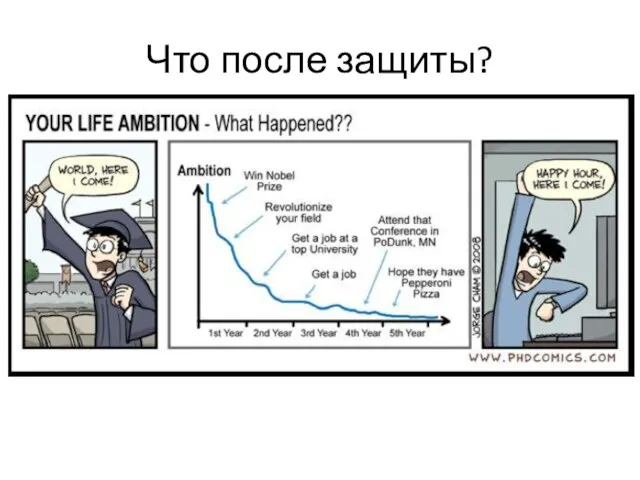
Что после защиты?
Что после защиты?
 Presentation about pollution By Julia Yemchenko Irina Zhabko Irina Fedorova Kate Klipatska
 Introduction to chinese language
 Презентация Макроэкономическое равновесие
 Differences and similarities between transport in Britain and Ukraine
  Страна изучаемого языка. Лондон
 Наречие в английском языке
 Презентация к уроку английского языка "«Новая Зеландия»" - скачать
  Palace of Westminster
  Othello by William Shakespeare “Beware of jealousy, my lord. It is the green-eyed monster which doth mock the meat on which it feeds.” Iago
 Summer Universiade 2013 Great russian sporting events
 The Seasons МБОУ Красноборская средняя общеобразовательная школа Агрызского муниципального района РТ
 Reading practice
 Philadelphia Economy
  Причастие (Participle)
 George Bernard Show
  Аттестационная работа. Методическая разработка по выполнению проекта A letter to the Queen
 Симметрия в английской символике. Бинарный урок
 Past tenses
 Аттестационная работа. Функционирование букв английского алфавита как самостоятельных объектов, так и в словах и буквосочетаниях
 Презентация к уроку английского языка "A subculture... Writers PROJECT" - скачать бесплатно
 Презентация к уроку английского языка "Presentation on Nottingham and Bristol" - скачать бесплатно
 Презентация на тему Трафальгарская площадь
  Countries and nationalities Moskova Olga Antonovna
  Презентация к уроку английского языка "The role of English language in people’s life." - скачать бесплатно
 Charles Dickens (1812-1870) A novel Dombey and Son. The topic of upbringing and development of the personality in the novel
  Презентацию выполнила учитель английского языка МОУ СОШ №5 г.Ртищево Новикова Вера Юрьевна
 Made by: Mudrushina Yalya Form:9
 Subcultures