- Financial Evaluation of an IT Project

Содержание
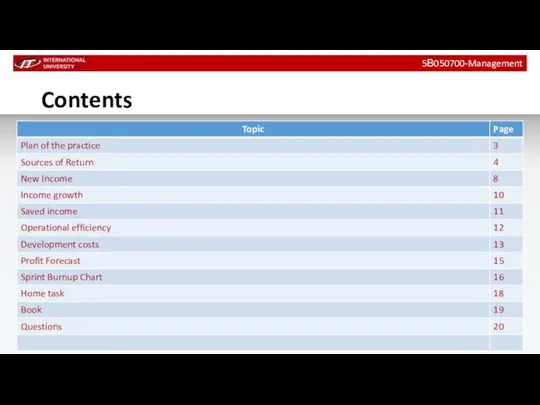
- 2. Contents 5В050700-Management
- 3. Plan of the practice As continue of the last lection we will try today to build
- 4. Sources of Return (1/4) 5В050700-Management Some projects are implemented to generate income, others to reduce costs,
- 5. Table 10.1 contains columns for different types of recoil, which may be for topics. If you
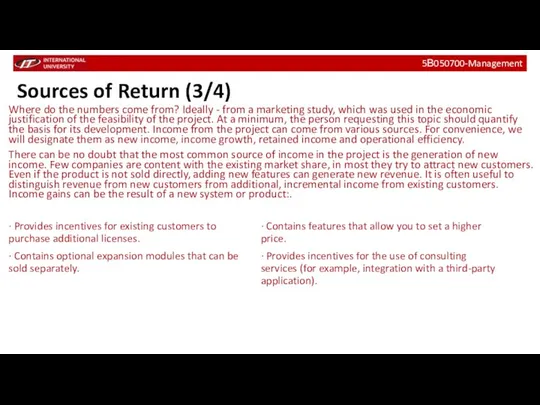
- 6. Sources of Return (3/4) 5В050700-Management Where do the numbers come from? Ideally - from a marketing
- 7. Sources of Return (4/4) 5В050700-Management Apart from the new income and income growth is the retained
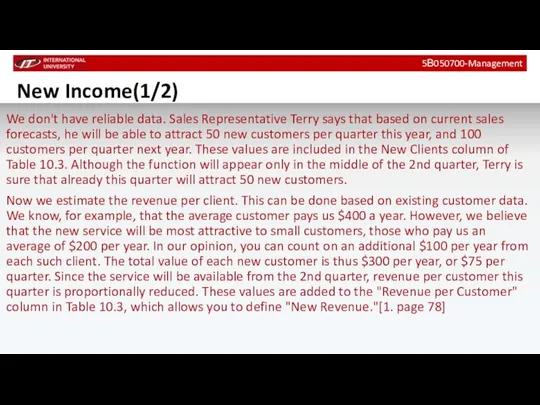
- 8. New Income(1/2) 5В050700-Management We don't have reliable data. Sales Representative Terry says that based on current
- 9. New Income(2/2) 5В050700-Management
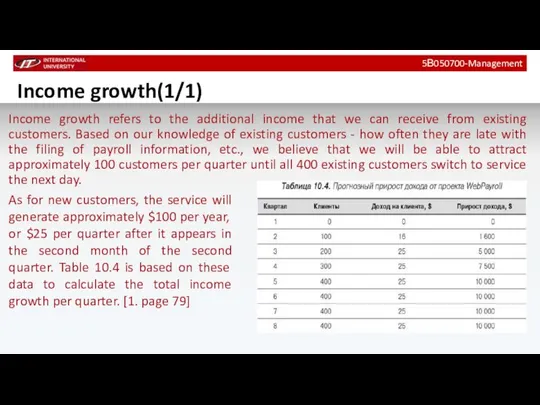
- 10. Income growth(1/1) 5В050700-Management Income growth refers to the additional income that we can receive from existing
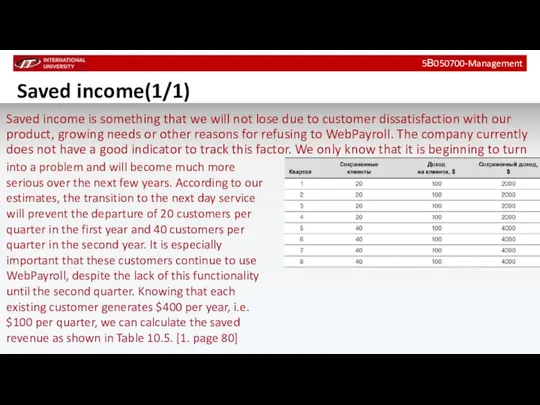
- 11. Saved income(1/1) 5В050700-Management Saved income is something that we will not lose due to customer dissatisfaction
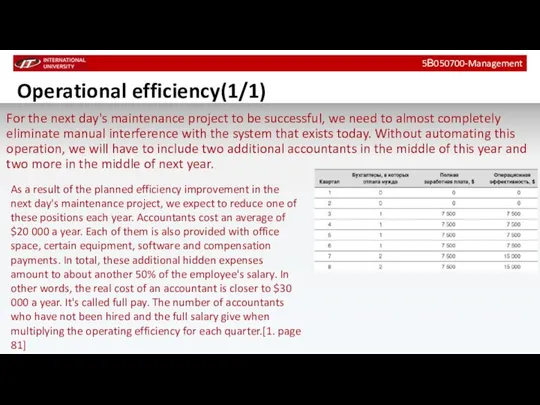
- 12. Operational efficiency(1/1) 5В050700-Management For the next day's maintenance project to be successful, we need to almost
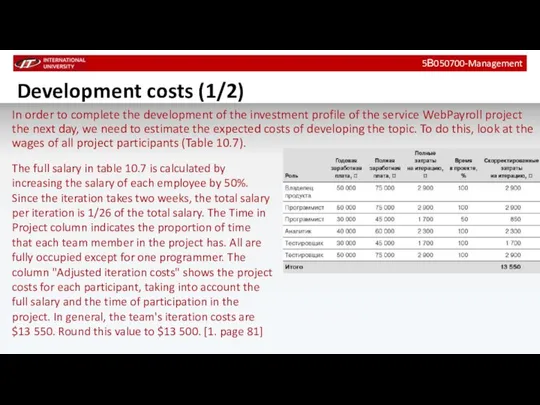
- 13. Development costs (1/2) 5В050700-Management In order to complete the development of the investment profile of the
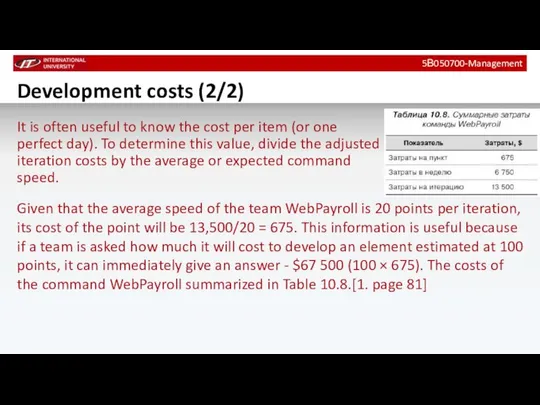
- 14. Development costs (2/2) 5В050700-Management It is often useful to know the cost per item (or one
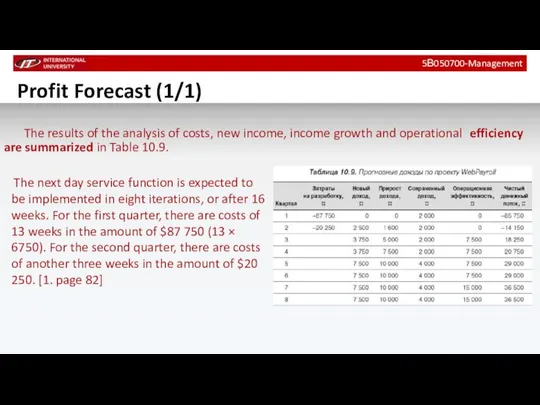
- 15. Profit Forecast (1/1) The results of the analysis of costs, new income, income growth and operational
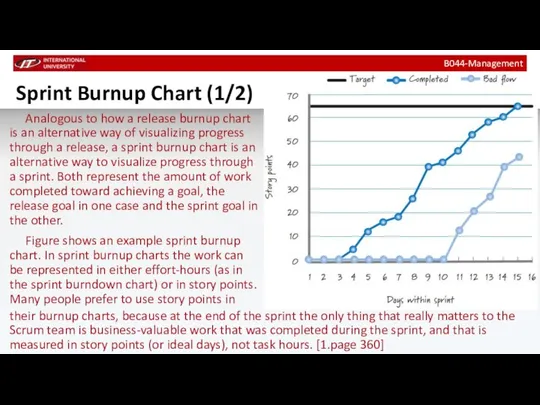
- 16. Sprint Burnup Chart (1/2) B044-Management Analogous to how a release burnup chart is an alternative way
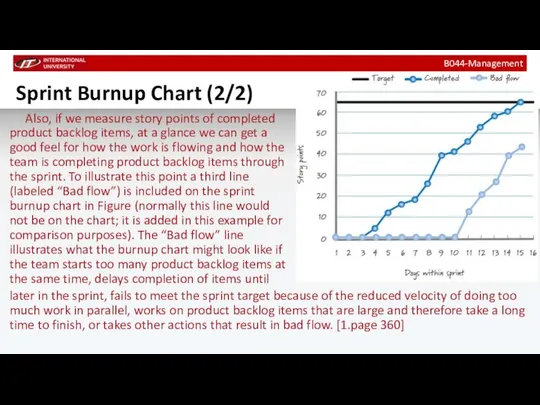
- 17. Sprint Burnup Chart (2/2) B044-Management Also, if we measure story points of completed product backlog items,
- 18. Home task By the next practice: to prepare Project Forecast Calculation table to prepare Burnup chart
- 19. Books B044-Management Mike Kohn – Agile estimating and planning. Alpina Publisher, 2018 Rubin K- Essential Scrum
- 21. Скачать презентацию
Contents
5В050700-Management
Contents
5В050700-Management

Plan of the practice
As continue of the last lection we will
Plan of the practice
As continue of the last lection we will
Sources of Return (1/4)
5В050700-Management
Some projects are implemented to generate income, others
Sources of Return (1/4)
5В050700-Management
Some projects are implemented to generate income, others

Table 10.1 contains columns for different types of recoil, which may
Table 10.1 contains columns for different types of recoil, which may
Sources of Return (3/4)
5В050700-Management
Where do the numbers come from? Ideally -
Sources of Return (3/4)
5В050700-Management
Where do the numbers come from? Ideally -
Sources of Return (4/4)
5В050700-Management
Apart from the new income and income growth
Sources of Return (4/4)
5В050700-Management
Apart from the new income and income growth
New Income(1/2)
5В050700-Management
We don't have reliable data. Sales Representative Terry says that
New Income(1/2)
5В050700-Management
We don't have reliable data. Sales Representative Terry says that

New Income(2/2)
5В050700-Management
New Income(2/2)
5В050700-Management
Income growth(1/1)
5В050700-Management
Income growth refers to the additional income that we can
Income growth(1/1)
5В050700-Management
Income growth refers to the additional income that we can
Saved income(1/1)
5В050700-Management
Saved income is something that we will not lose due
Saved income(1/1)
5В050700-Management
Saved income is something that we will not lose due
Operational efficiency(1/1)
5В050700-Management
For the next day's maintenance project to be successful, we
Operational efficiency(1/1)
5В050700-Management
For the next day's maintenance project to be successful, we
Development costs (1/2)
5В050700-Management
In order to complete the development of the investment
Development costs (1/2)
5В050700-Management
In order to complete the development of the investment
Development costs (2/2)
5В050700-Management
It is often useful to know the cost per
Development costs (2/2)
5В050700-Management
It is often useful to know the cost per
Profit Forecast (1/1)
The results of the analysis of costs, new
Profit Forecast (1/1)
The results of the analysis of costs, new
Sprint Burnup Chart (1/2)
B044-Management
Analogous to how a release burnup chart is
Sprint Burnup Chart (1/2)
B044-Management
Analogous to how a release burnup chart is
Sprint Burnup Chart (2/2)
B044-Management
Also, if we measure story points of completed
Sprint Burnup Chart (2/2)
B044-Management
Also, if we measure story points of completed

Home task
By the next practice:
to prepare Project Forecast Calculation table
to
Home task
By the next practice:
to prepare Project Forecast Calculation table
to
Books
B044-Management
Mike Kohn – Agile estimating and planning. Alpina Publisher, 2018
Rubin K-
Books
B044-Management
Mike Kohn – Agile estimating and planning. Alpina Publisher, 2018
Rubin K-
 Презентация Ответственность за нарушение законодательства о недрах
 Занятость населения
 Международная торговля услугами
 Федеральные округа Российской Федерации
 Теоретические основы экономики труда
 Хозяйство Европейского Юга
 Милтон Фридман (1912-2006)
 Суспільний продукт і його форми
 Региональная экономика
 Венчурный бизнес и его роль в современной экономике. Инновации и венчурный бизнес
 Статистика научно-технического прогресса
 Условия и механизм применения антидемпинговых пошлин Выполнили студентки группы Ю 101 Дамаева Кристина, Мукебенова Людмила _
 Модель оптового рынка электроэнергии и мощности (ОРЭМ)
 Управление природопользованием и его инструменты
 Новая экономическая политика (НЭП)
 Предметные области и особенности основных направлений институциональной экономики
 О практике оценки эффективности деятельности ТК в Российской Федерации
 Колледж ОмГТУ. Экономика и бухгалтерский учёт
 Контроллинг как интегративная функция и инструментальная среда управления. Специфика контроллинга в таможенных органах
 закон спроса и предложения
 Экономический рост России и его проблемы
 Механизм рынка труда: спрос и предложение, равновесие на рынке труда
 Что такое предпринимательство
 Базовые категории институционализма. Тема 6
 Бухгалтерские издержки. Экономические издержки
 Неоклассическая теория: общая характеристика
 Деловой туризм
 Рыночные отношения в экономике