- Forests, agriculture and climate

Содержание
- 2. Forestry and Agriculture as a Percent of Total Greenhouse Gas Emissions Source: Figure adapted from UN
- 3. Sources and Flows of Greenhouse Gases Figure source: World Resource Institute (WRI), can be accessed at
- 4. Designated Functions of Forests, 2010 Source: Global Forest Resources Assessment, by Food and Agriculture Organization of
- 5. Forests as Carbon Stocks and Carbon Fluxes Source: CIFOR, World Agroforestry Centre and USAID 2009 Forest
- 7. a. Annual Net Flux of Carbon to the Atmosphere from Land Use Change, South America, Africa,
- 8. b. Annual Net Flux of Carbon to the Atmosphere from Land Use Change, Europe, China, Former
- 9. Social and Ecological Functions of Forests Source: Costanza, R., et. Al., 1997, “The value of the
- 10. Top Countries with the Largest Forest Area Source: Global Forest Resources Assessment, by Food and Agriculture
- 11. The World's Forest Coverage Source: Global Forest Resources Assessment, by Food and Agriculture Organization of the
- 12. Annual Change in Forest Area by Region, 1990-2010 Source: Global Forest Resources Assessment, by Food and
- 13. Annual Change in Forest Area by Country, 2005- 2010 Source: Global Forest Resources Assessment, by Food
- 14. Graph Source: Rhett A. Butler / mongabay.com, http://www.mongabay.com/ Consumer price index
- 15. Annual REDD Economic Mitigation Potential, 2030 Source: IPCC Fourth Assessment Report: Climate Change 2007, Accessible at
- 16. Potential for Carbon Emissions Reduction in Forested Lands Source: Metz et al. 2007a, available at http://www.ipcc.ch/publications_and_data/ar4/wg3/en/ch9s9-4-4.html#table-9-6
- 17. Global Greenhouse Gas Emissions from Agriculture Source: World Resource Institute (WRI), accessed 2011 Org. fertilizer кишечный
- 18. Agricultural Greenhouse Gas Emissions by Region Projected to 2020: Developed Nations GHG emissions in Agriculture (Mt
- 20. Скачать презентацию
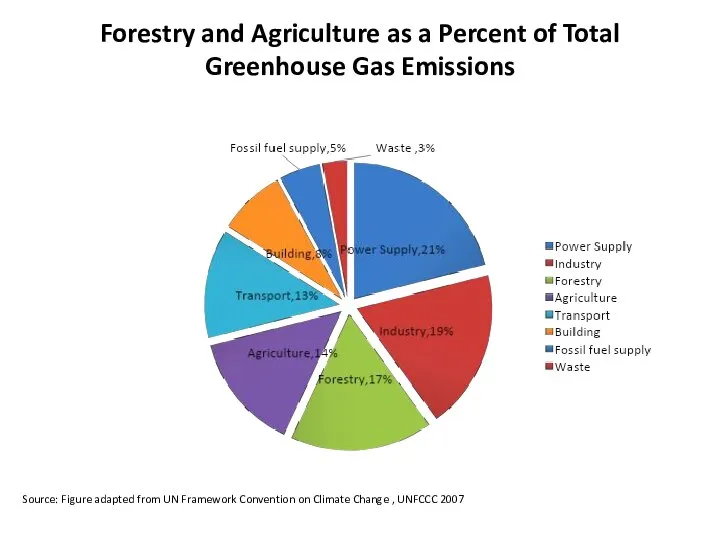
Forestry and Agriculture as a Percent of Total Greenhouse Gas Emissions
Source:
Forestry and Agriculture as a Percent of Total Greenhouse Gas Emissions
Source:
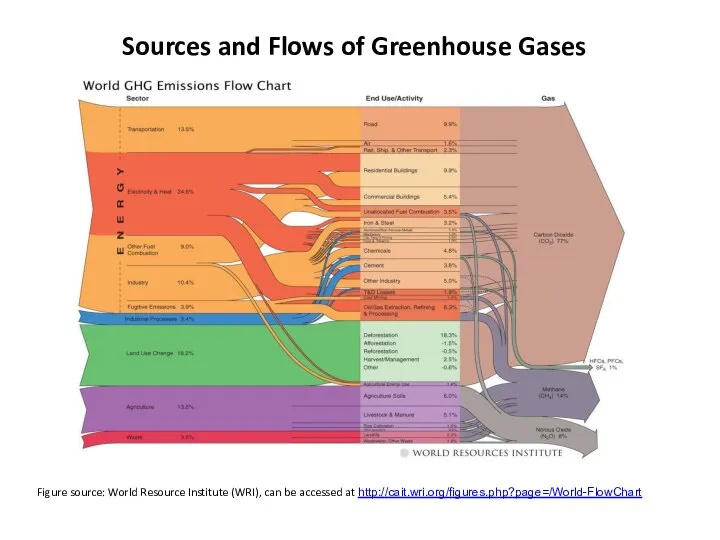
Sources and Flows of Greenhouse Gases
Figure source: World Resource Institute
Sources and Flows of Greenhouse Gases
Figure source: World Resource Institute
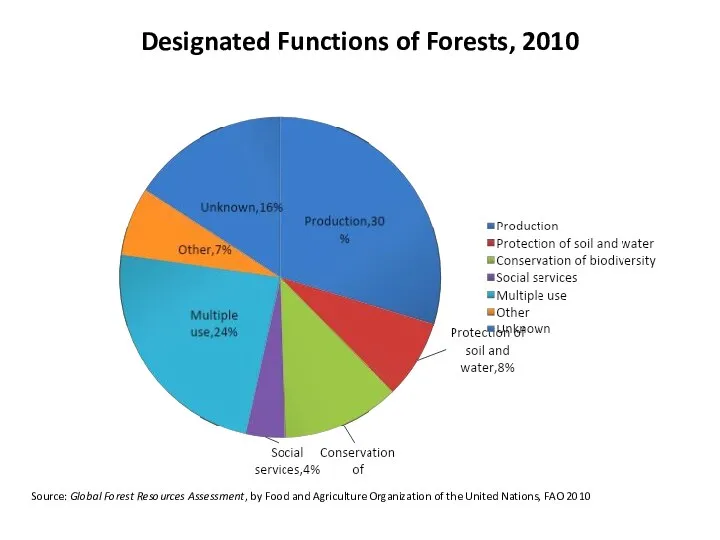
Designated Functions of Forests, 2010
Source: Global Forest Resources Assessment, by Food
Designated Functions of Forests, 2010
Source: Global Forest Resources Assessment, by Food
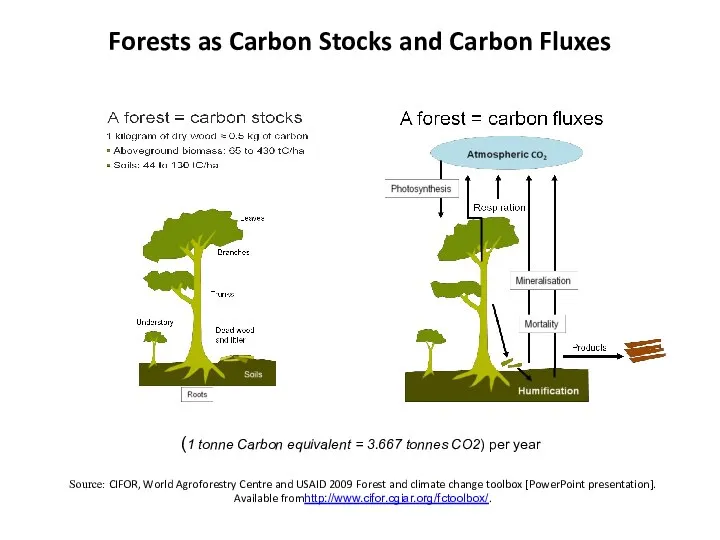
Forests as Carbon Stocks and Carbon Fluxes
Source: CIFOR, World Agroforestry
Forests as Carbon Stocks and Carbon Fluxes
Source: CIFOR, World Agroforestry
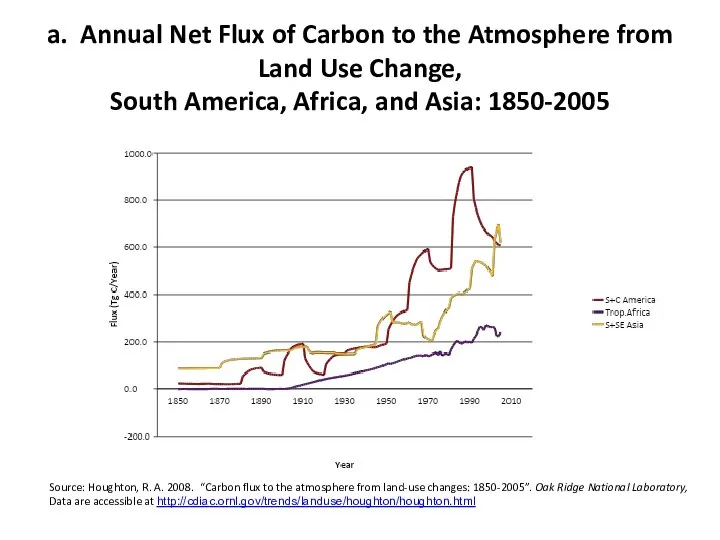
a. Annual Net Flux of Carbon to the Atmosphere from Land
a. Annual Net Flux of Carbon to the Atmosphere from Land
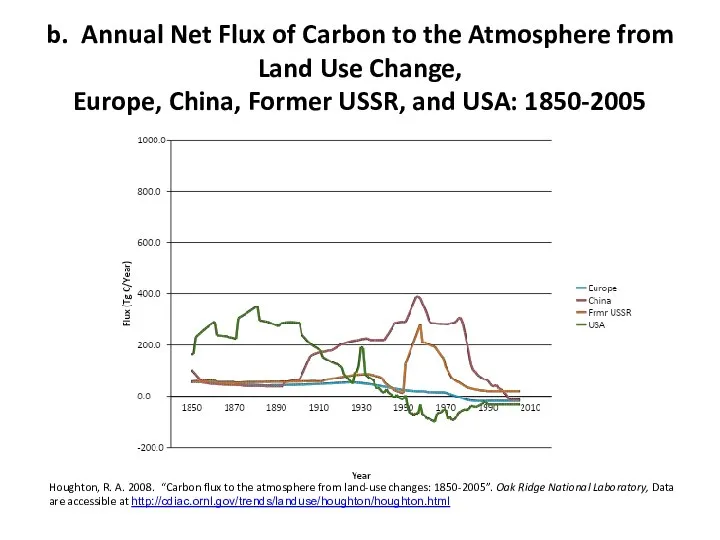
b. Annual Net Flux of Carbon to the Atmosphere from Land
b. Annual Net Flux of Carbon to the Atmosphere from Land
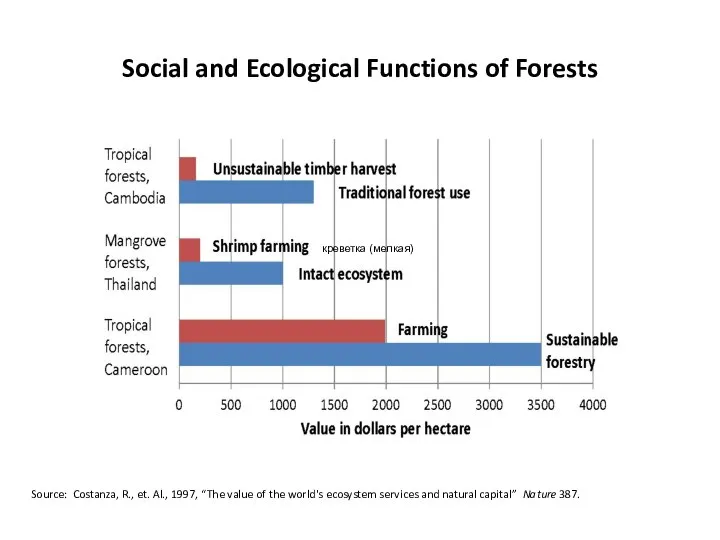
Social and Ecological Functions of Forests
Source: Costanza, R., et. Al., 1997,
Social and Ecological Functions of Forests
Source: Costanza, R., et. Al., 1997,
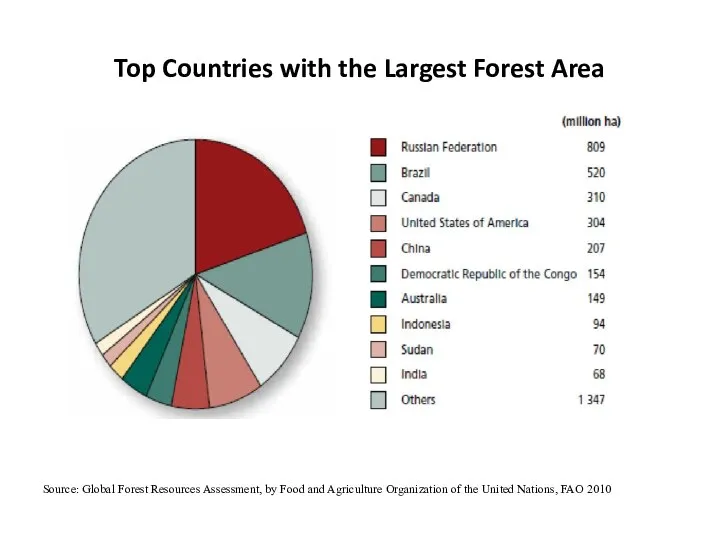
Top Countries with the Largest Forest Area
Source: Global Forest Resources Assessment,
Top Countries with the Largest Forest Area
Source: Global Forest Resources Assessment,
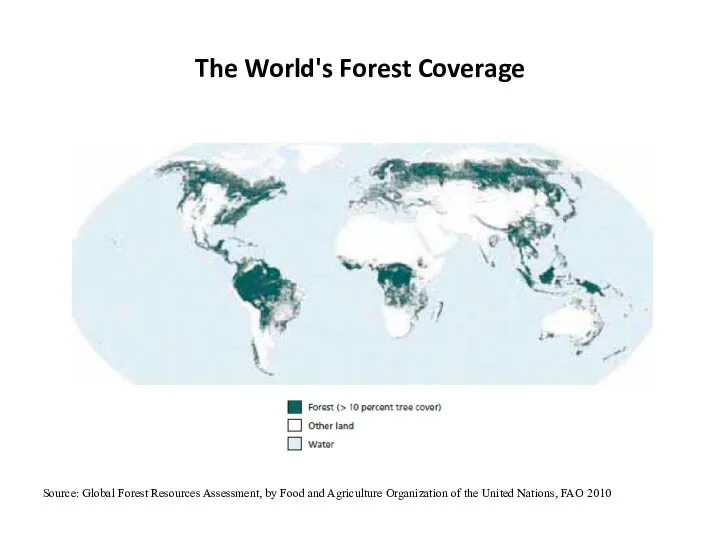
The World's Forest Coverage
Source: Global Forest Resources Assessment, by Food and
The World's Forest Coverage
Source: Global Forest Resources Assessment, by Food and
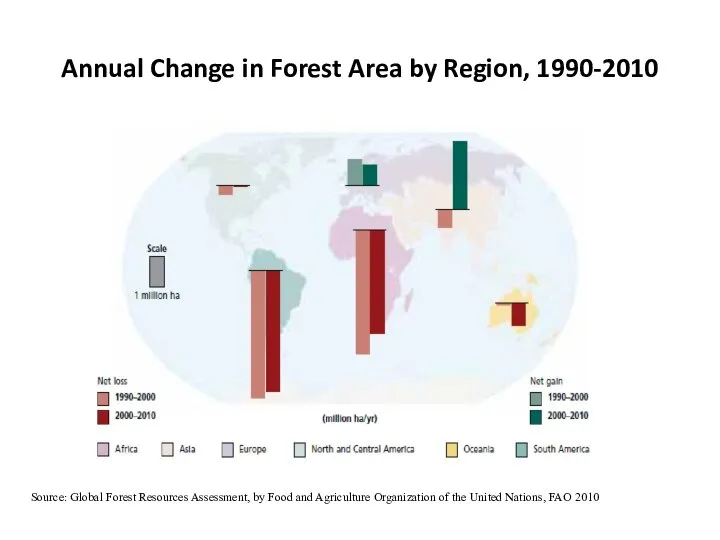
Annual Change in Forest Area by Region, 1990-2010
Source: Global Forest Resources
Annual Change in Forest Area by Region, 1990-2010
Source: Global Forest Resources
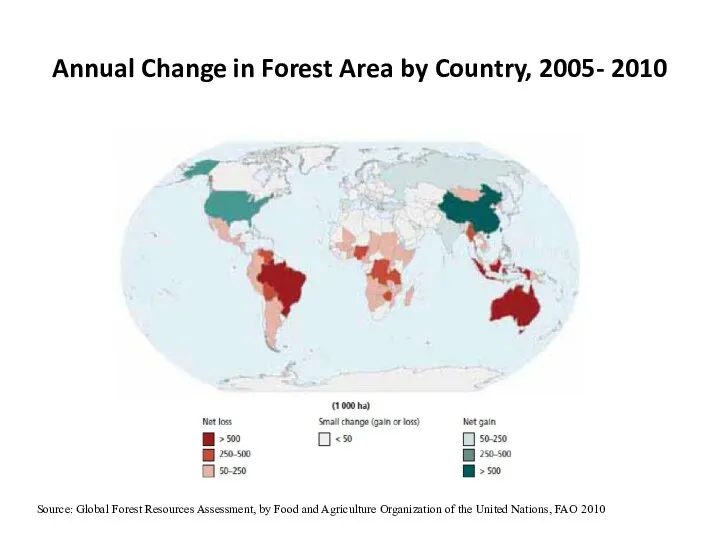
Annual Change in Forest Area by Country, 2005- 2010
Source: Global Forest
Annual Change in Forest Area by Country, 2005- 2010
Source: Global Forest
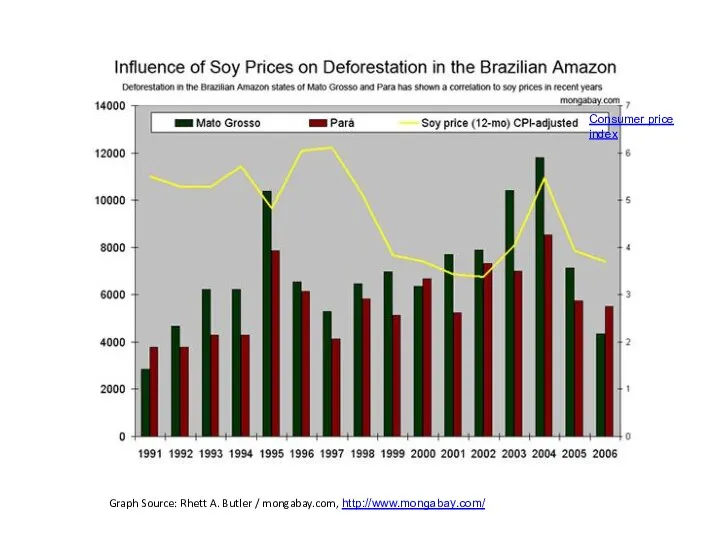
Graph Source: Rhett A. Butler / mongabay.com, http://www.mongabay.com/
Consumer price index
Graph Source: Rhett A. Butler / mongabay.com, http://www.mongabay.com/
Consumer price index
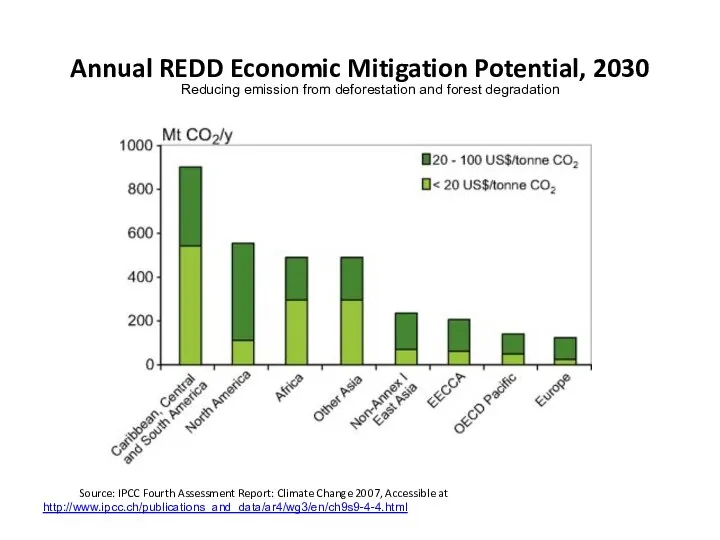
Annual REDD Economic Mitigation Potential, 2030
Source: IPCC Fourth Assessment Report: Climate
Annual REDD Economic Mitigation Potential, 2030
Source: IPCC Fourth Assessment Report: Climate
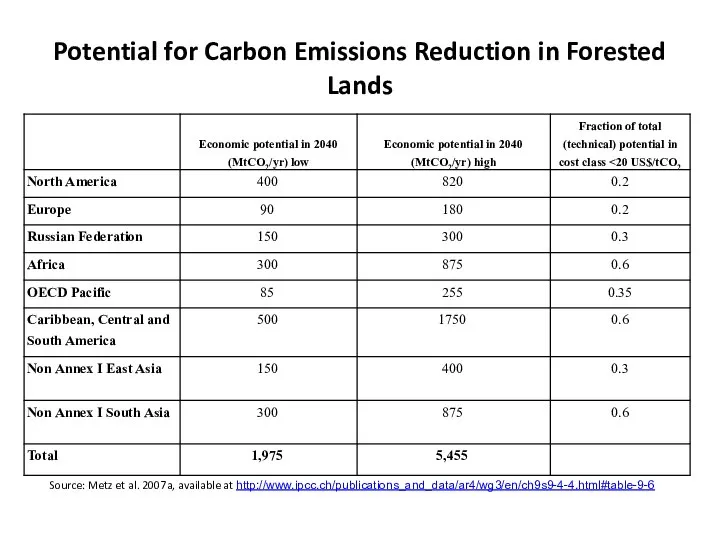
Potential for Carbon Emissions Reduction in Forested Lands
Source: Metz et al.
Potential for Carbon Emissions Reduction in Forested Lands
Source: Metz et al.
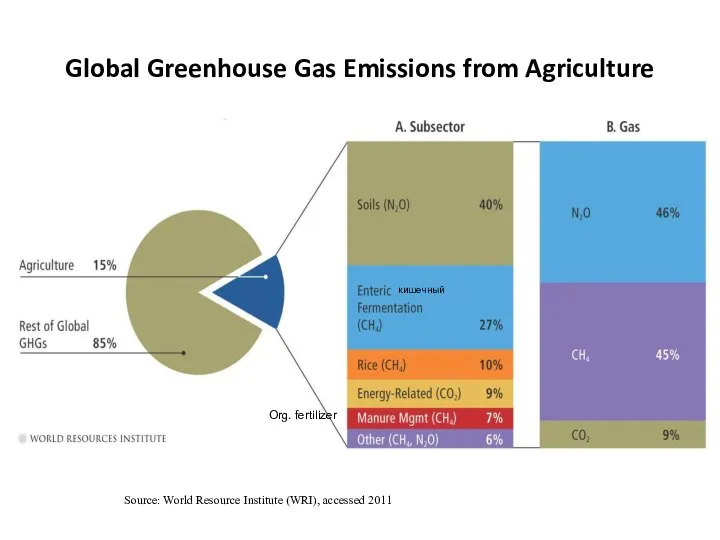
Global Greenhouse Gas Emissions from Agriculture
Source: World Resource Institute (WRI), accessed
Global Greenhouse Gas Emissions from Agriculture
Source: World Resource Institute (WRI), accessed
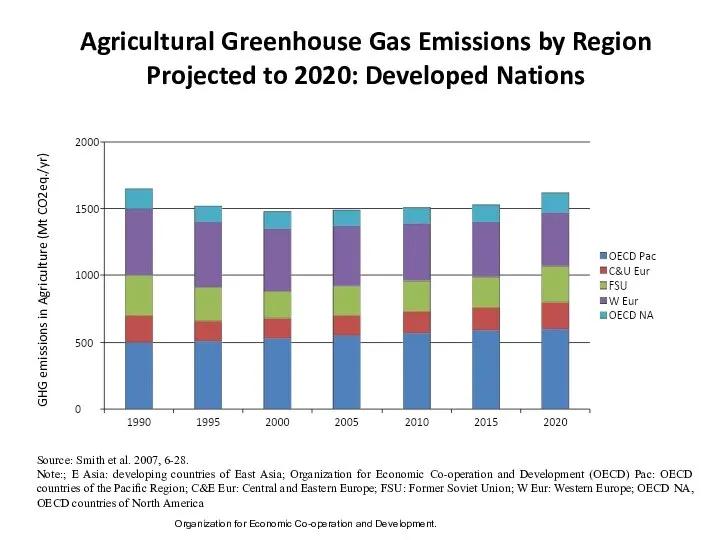
Agricultural Greenhouse Gas Emissions by Region Projected to 2020: Developed Nations
GHG
Agricultural Greenhouse Gas Emissions by Region Projected to 2020: Developed Nations
GHG
 Компоненты биосферы
 Аттестационная работа. Разработка занятия объединения «Защитники природы» с элементами исследовательской деятельности
 Физикалық әсердің қоршаған ортаға тигізетін әсері
 Экологические группы зверей. Значение млекопитающих для природы и человека
 ГАЖ-технологиясымен мұнай төгілген жерлерді картаға түсіру
 Проект Красная книга, или Возьмем под защиту
 Экологические проблемы биосферы
 Биосфера. Среды жизни
 Презентация на тему Московский Кремль
  Экологический календарь
 Окружающая среда - это мы с вами
 Очистка лесосек
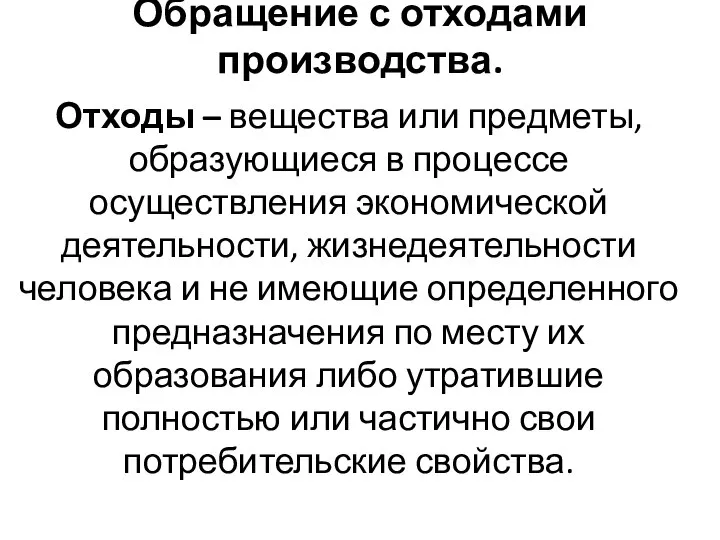 Обращение с отходами производства
 Экологическое право
 Вода в меняющемся мире
 Популяційна екологія
 Экскурсии по экологической тропе
 Влияние человеческой деятельности на природную среду
 Экология в производстве полимербетона
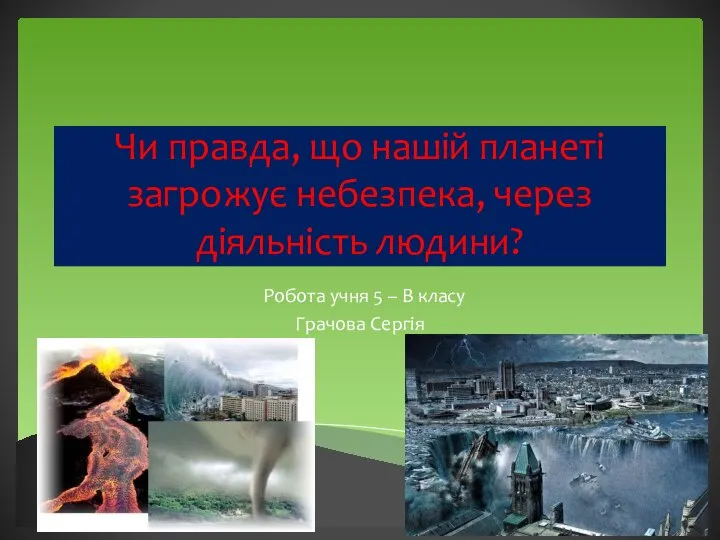 Чи правда, що нашій планеті загрожує небезпека через діяльність людини
 Environmental issues. 50 creative ideas for re-using objects around the house
 Посадили мы цветы. Долгосрочный проект
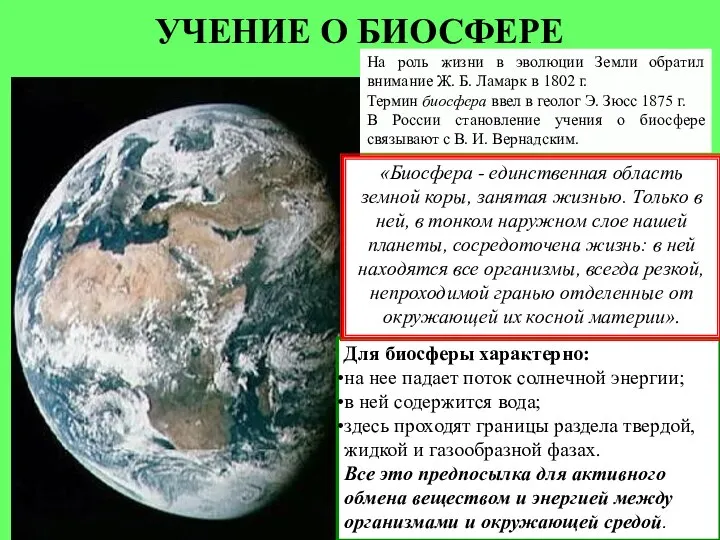 Учение о биосфере
 Глобальная экологическая проблема
 Спасённые животные
 Предмет гигиены. Ее цели и задачи. Понятие экологии
 Мониторинг окружающей среды
 Ионизирующее излучение, как экологический фактор