- Technical writing

Содержание
- 2. Line Graph The graph below shows the number of books read by men and women at
- 3. Table chart The table shows data about underground railway systems in six major cities with date
- 4. Pie Chart The three pie charts below show the changes in annual spending by local authorities
- 5. Bar Chart The bar chart below shows female unemployment rates in each country of the United
- 6. Process Diagram ( A Flow Chart) The diagrams show/ the flow chart shows a structure that
- 8. Скачать презентацию
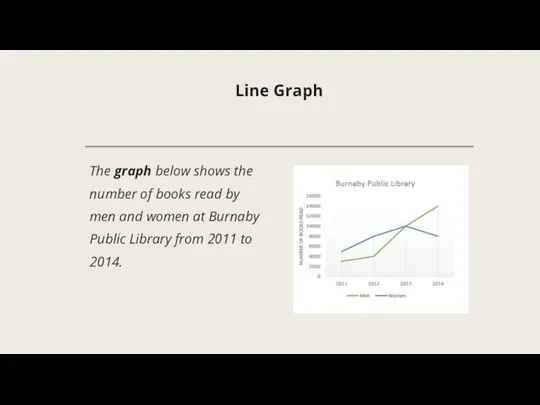
Line Graph
The graph below shows the number of books read by
Line Graph
The graph below shows the number of books read by
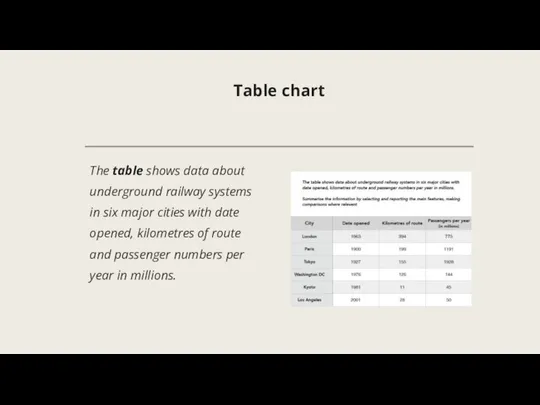
Table chart
The table shows data about underground railway systems in six
Table chart
The table shows data about underground railway systems in six
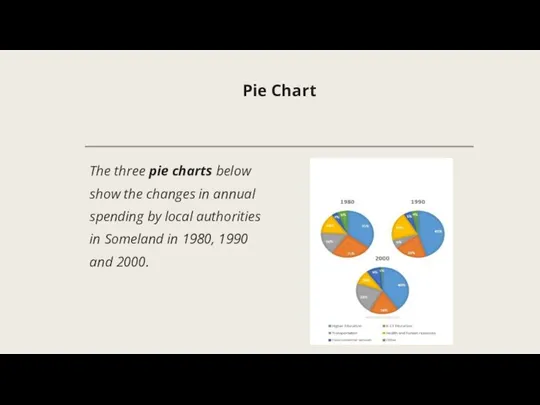
Pie Chart
The three pie charts below show the changes in annual
Pie Chart
The three pie charts below show the changes in annual
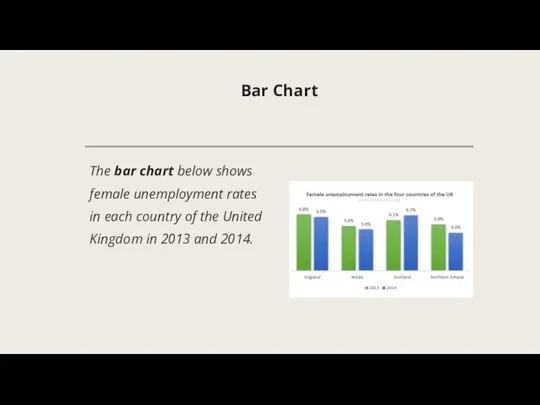
Bar Chart
The bar chart below shows female unemployment rates in each
Bar Chart
The bar chart below shows female unemployment rates in each
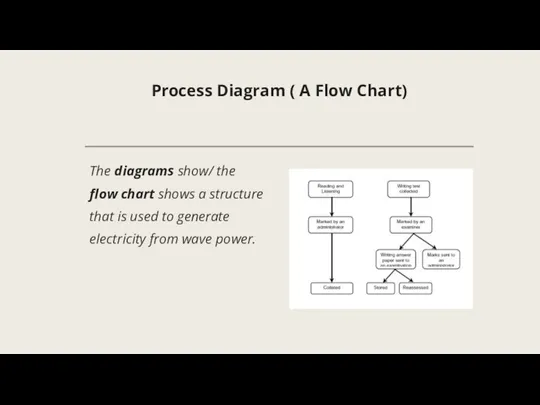
Process Diagram ( A Flow Chart)
The diagrams show/ the flow
Process Diagram ( A Flow Chart)
The diagrams show/ the flow
 Презентация по английскому языку The numerals
  Wild animals 5
 Tuvan folk tale. Why the birds don’t speak
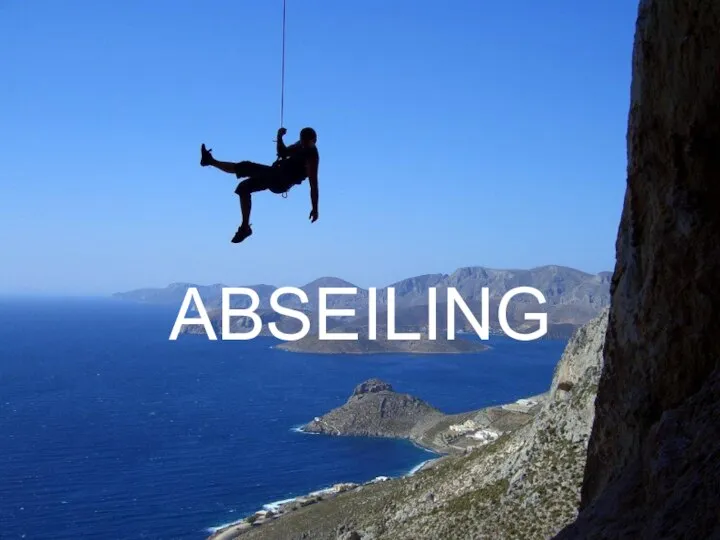 ABSEILING
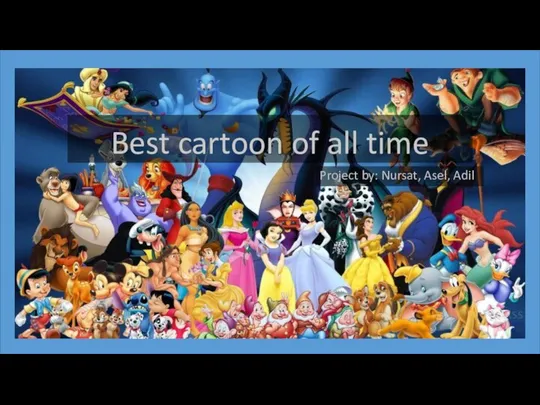 Best cartoon of all time
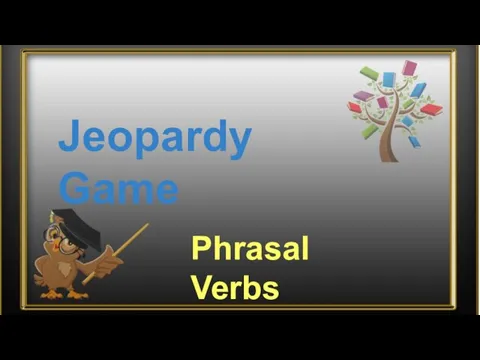 Jeopardy Game. Phrasal Verbs
 To be, he, she, they
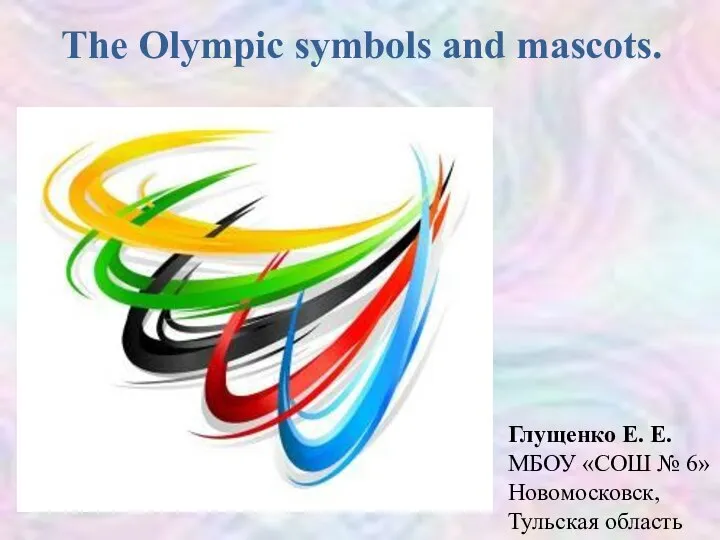 Презентация к уроку английского языка "The Olympic symbols and mascots" - скачать
  Тренажер з англійської мови. Вчимося читати англійською
 Compare and contrast the photographs
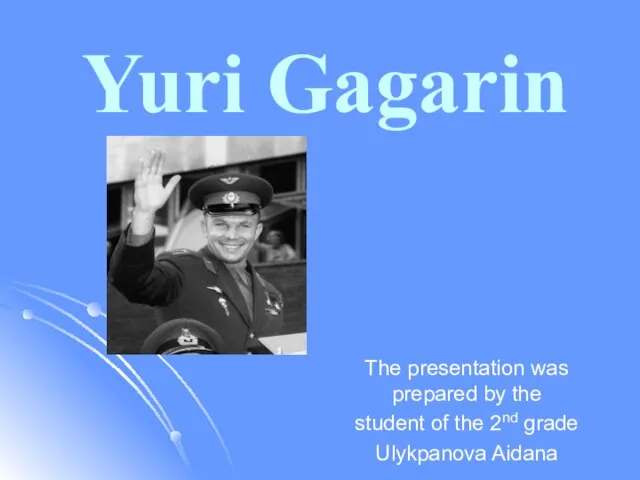 Yuri Gagarin
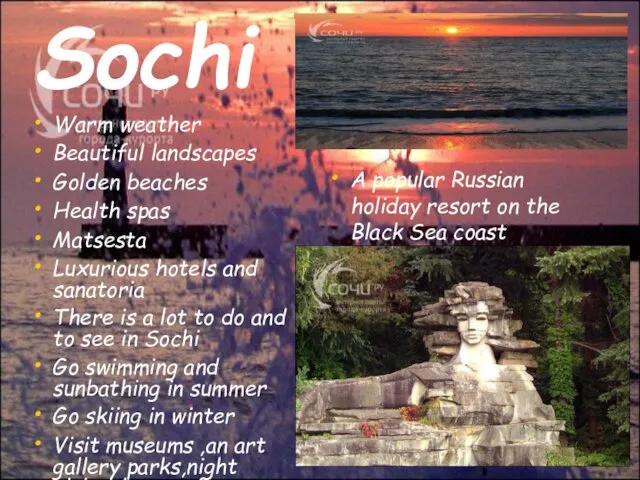 Sochi city
 Module 8f. English in use
 Today is the 21st of November.
  Выполнил ученик 6 класса:Тищенко Егор
 Superstition
  “The Way Teenager’s Live”
 The most unusual houses of the world
 FUTURISTIC CLOTHES
 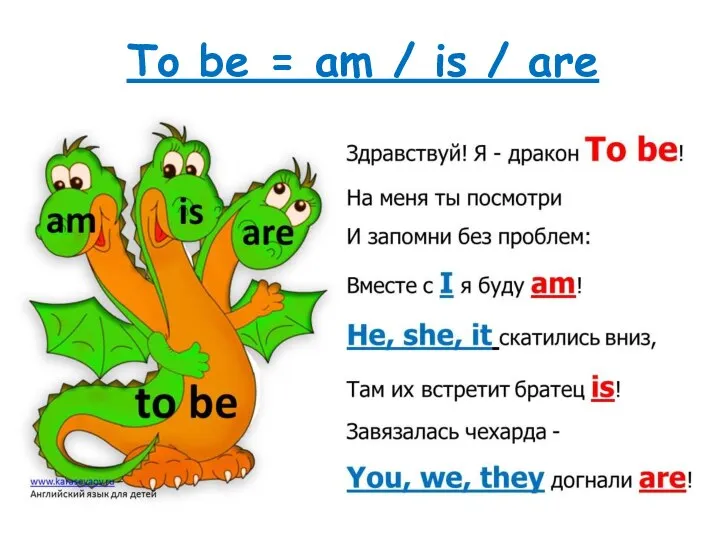 To be = am / is / are
 Bioprinting. 3-D printers in medicine
 Comparison of phraseological units with zoonyms in the English, German and Russian languages
 What’s missing?
 Blockbuster riddles
 And Game. Sport
 Vebsayte Executed Furka Taras
  Read the sentence, fill in the gap, and then check
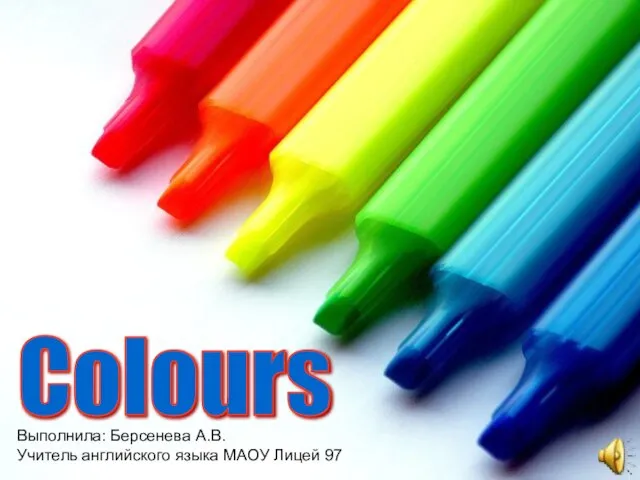 Цвета. Оттенки цвета