- Indicators of economic efficiency

Содержание
- 2. 3 Key Economic indicators
- 3. Gross Domestic Product market value of all final goods and services produced within a country in
- 4. Intermediate goods Resources of any kind Used goods Ex: Used cars, purchase of an older home,
- 5. C: consumer spending Daily spending on goods and services I: business investment spending Machinery, factories, equipment
- 6. G: government spending Spending by all levels of government - military, school, highways, supplies etc. NX:
- 7. Example: In 2000, estimates in trillions of dollars GPP = C + I + G +
- 8. Unemployment Rate Percentage of labor force who is not working Labor Force: everyone 16 – 65
- 9. People are out of work temporarily Seasonal work Changing jobs Looking for 1st job This is
- 10. Unemployment because your job skills are no longer needed Ex. Technology replaces workers so people are
- 11. People are unemployed due to fluctuations in the business cycle As the economy declines, people lose
- 12. Consumer Price Index Index of all goods and services produced in a country Measured by a
- 13. Inflation Rising price levels purchasing power of the dollar falls Dollar buys less Deflation Falling price
- 14. Hyperinflation: rapid inflation ex. Germany after WWII Stagflation: rising prices with falling GDP and rising unemployment
- 15. As GDP rises, unemployment rates fall and prices begin to rise As GDP falls, unemployment rises
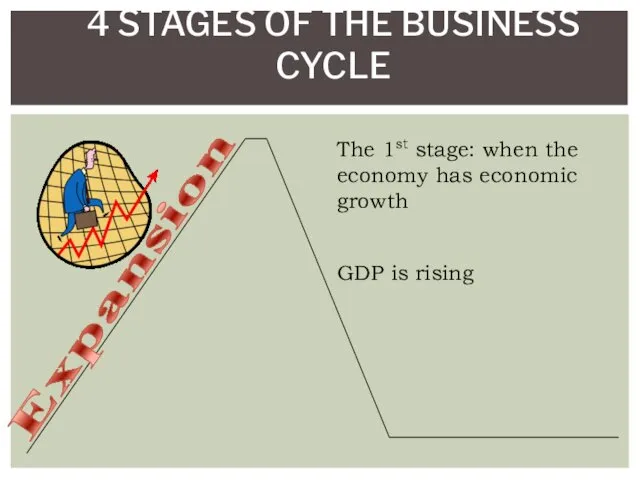
- 16. 4 STAGES OF THE BUSINESS CYCLE Expansion The 1st stage: when the economy has economic growth
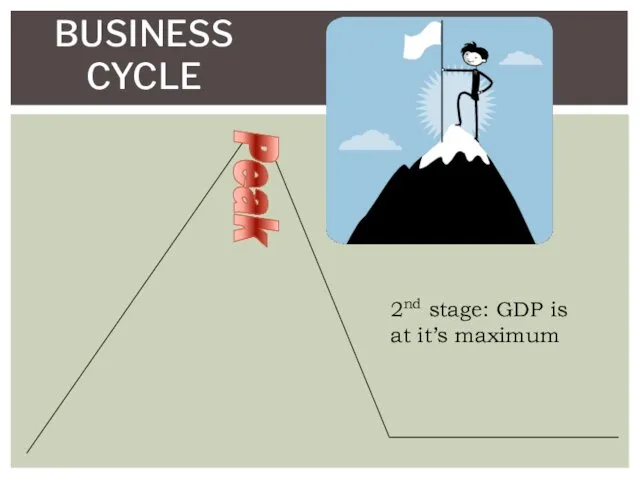
- 17. BUSINESS CYCLE Peak 2nd stage: GDP is at it’s maximum
- 18. BUSINESS CYCLE Contraction 3rd stage: GDP is falling 6 months or more of a contraction is
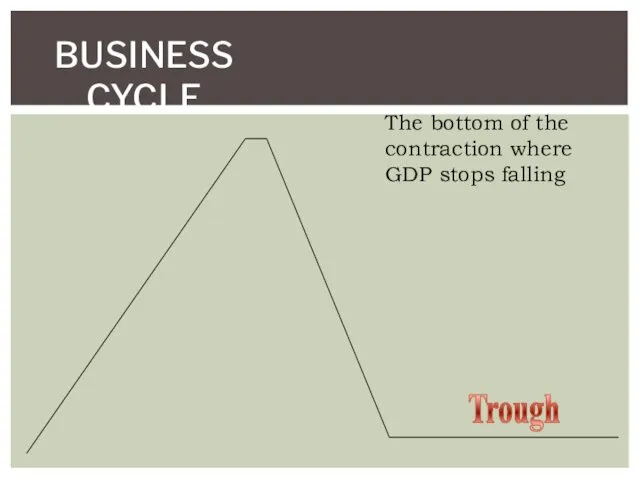
- 19. BUSINESS CYCLE Trough The bottom of the contraction where GDP stops falling
- 20. BUSINESS CYCLE – 4 STAGES Expansion Peak Contraction Trough
- 21. Aggregate means “total” Total demand for ALL FINAL goods and services in the economy from all
- 22. Aggregate demand consists of: consumer spending (C) investment spending (I) government spending (G) net export spending
- 23. High price level leads to lower quantity of aggregate demand THE CURVE P AD Q P
- 25. Скачать презентацию

3 Key
Economic
indicators
3 Key
Economic
indicators
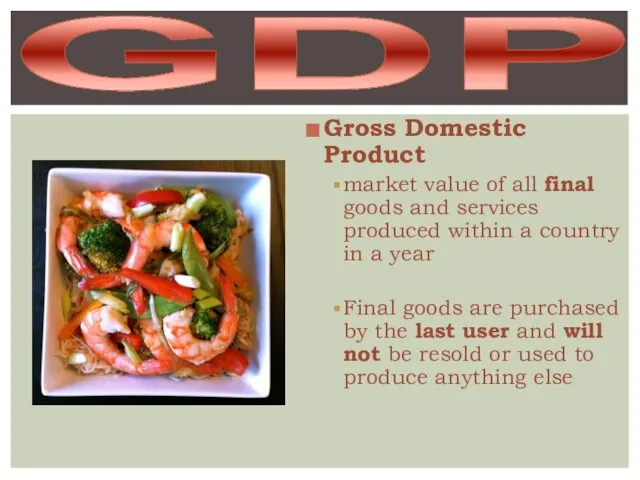
Gross Domestic Product
market value of all final goods and services produced
Gross Domestic Product
market value of all final goods and services produced
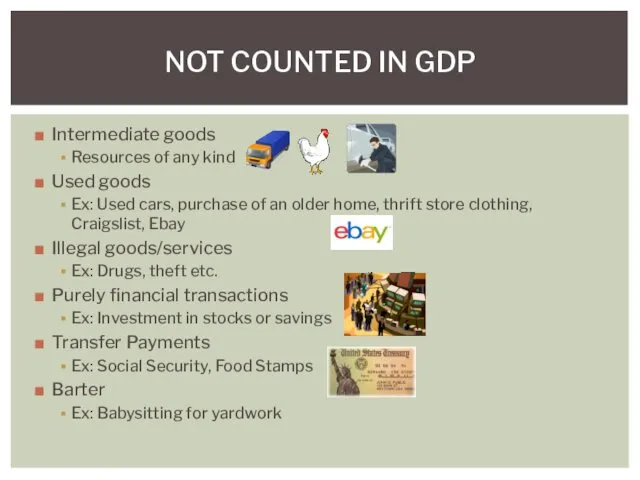
Intermediate goods
Resources of any kind
Used goods
Ex: Used cars, purchase of an
Intermediate goods
Resources of any kind
Used goods
Ex: Used cars, purchase of an
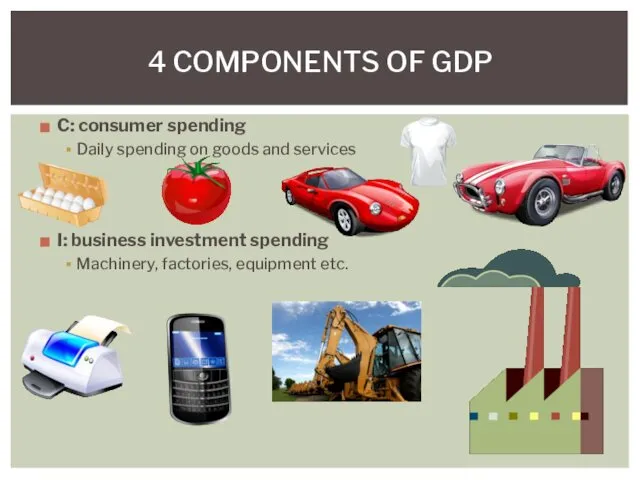
C: consumer spending
Daily spending on goods and services
I: business investment spending
Machinery,
C: consumer spending
Daily spending on goods and services
I: business investment spending
Machinery,
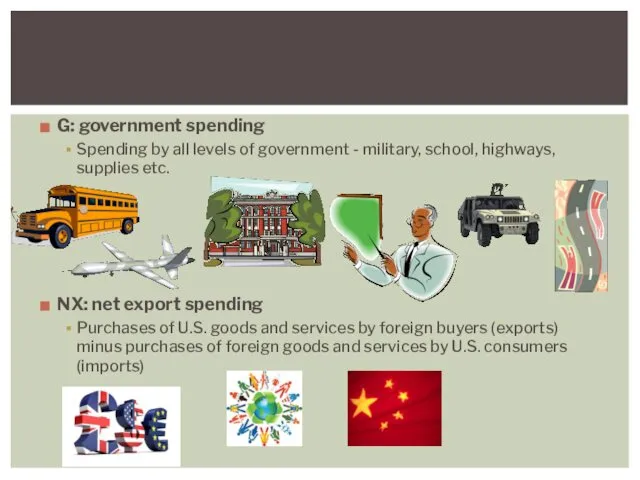
G: government spending
Spending by all levels of government - military, school,
G: government spending
Spending by all levels of government - military, school,

Example:
In 2000, estimates in trillions of dollars
GPP = C + I +
Example:
In 2000, estimates in trillions of dollars
GPP = C + I +
Unemployment Rate
Percentage of labor force who is not working
Labor Force: everyone
Unemployment Rate
Percentage of labor force who is not working
Labor Force: everyone
People are out of work temporarily
Seasonal work
Changing jobs
Looking for 1st job
This
People are out of work temporarily
Seasonal work
Changing jobs
Looking for 1st job
This
Unemployment because your job skills are no longer needed
Ex. Technology replaces
Unemployment because your job skills are no longer needed
Ex. Technology replaces
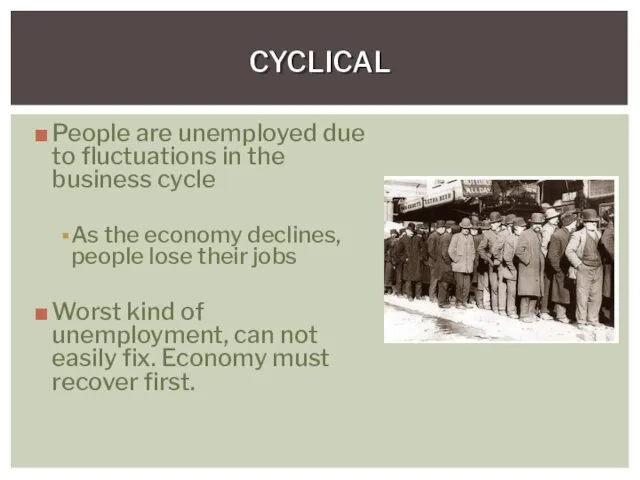
People are unemployed due to fluctuations in the business cycle
As the
People are unemployed due to fluctuations in the business cycle
As the
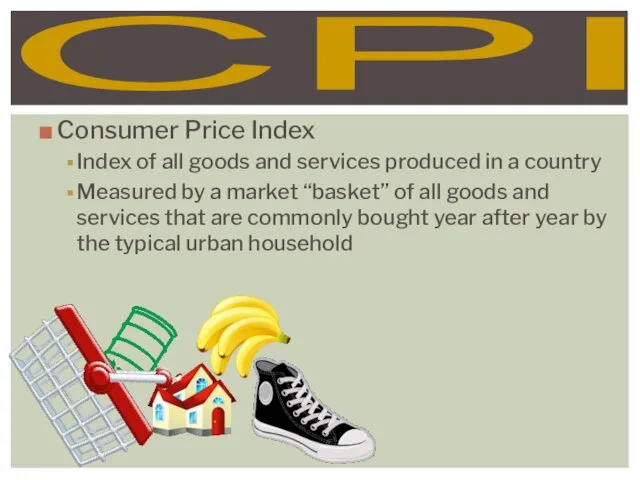
Consumer Price Index
Index of all goods and services produced in a
Consumer Price Index
Index of all goods and services produced in a
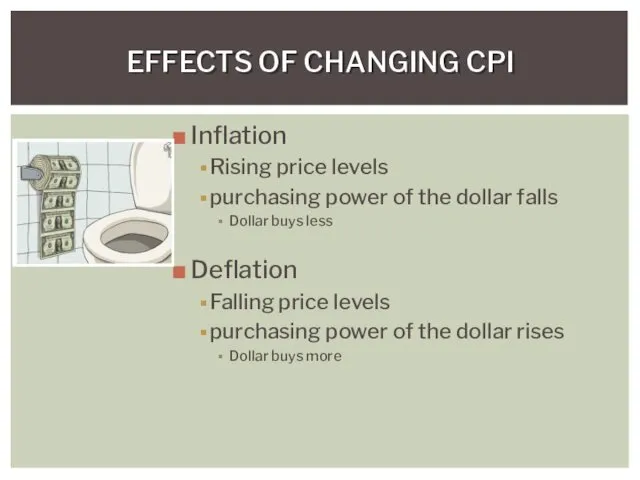
Inflation
Rising price levels
purchasing power of the dollar falls
Dollar buys less
Deflation
Falling price
Inflation
Rising price levels
purchasing power of the dollar falls
Dollar buys less
Deflation
Falling price
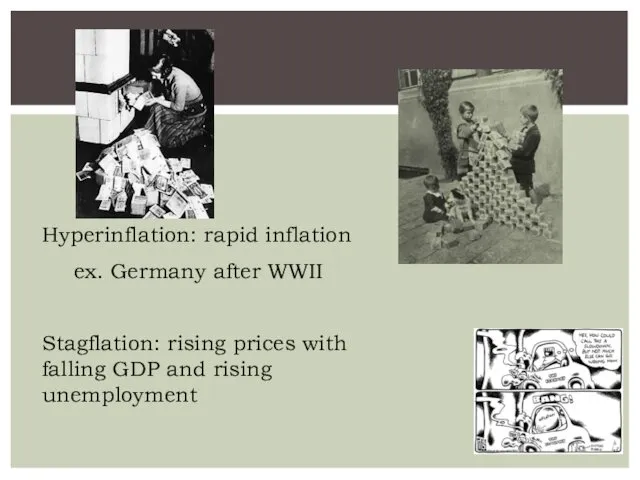
Hyperinflation: rapid inflation
ex. Germany after WWII
Stagflation: rising prices with falling GDP
Hyperinflation: rapid inflation
ex. Germany after WWII
Stagflation: rising prices with falling GDP
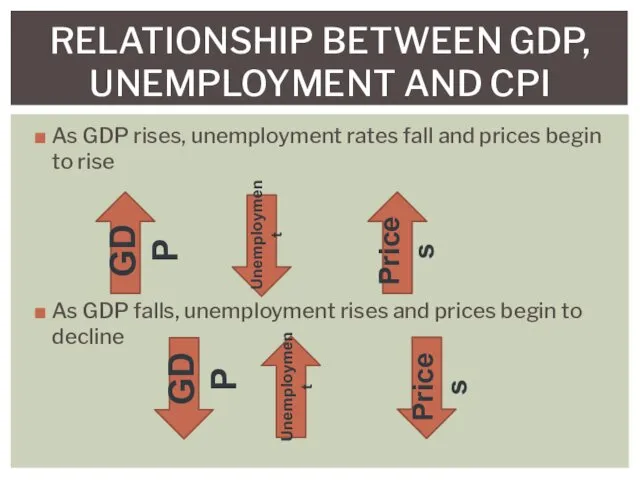
As GDP rises, unemployment rates fall and prices begin to rise
As
As GDP rises, unemployment rates fall and prices begin to rise
As
4 STAGES OF THE BUSINESS CYCLE
Expansion
The 1st stage: when the economy
4 STAGES OF THE BUSINESS CYCLE
Expansion
The 1st stage: when the economy
BUSINESS CYCLE
Peak
2nd stage: GDP is at it’s maximum
BUSINESS CYCLE
Peak
2nd stage: GDP is at it’s maximum

BUSINESS CYCLE
Contraction
3rd stage: GDP is falling
6 months or more of a
BUSINESS CYCLE
Contraction
3rd stage: GDP is falling
6 months or more of a
BUSINESS CYCLE
Trough
The bottom of the contraction where GDP stops falling
BUSINESS CYCLE
Trough
The bottom of the contraction where GDP stops falling

BUSINESS CYCLE – 4 STAGES
Expansion
Peak
Contraction
Trough
BUSINESS CYCLE – 4 STAGES
Expansion
Peak
Contraction
Trough

Aggregate means “total”
Total demand for ALL FINAL goods and services in
Total demand for ALL FINAL goods and services in
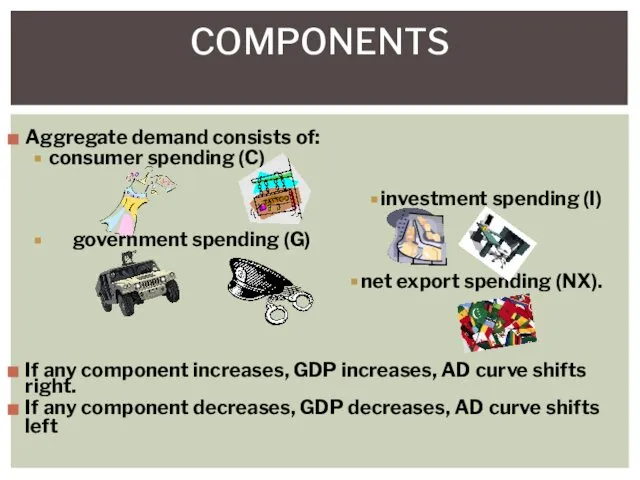
Aggregate demand consists of:
consumer spending (C)
investment spending (I)
government spending
Aggregate demand consists of:
consumer spending (C)
investment spending (I)
government spending
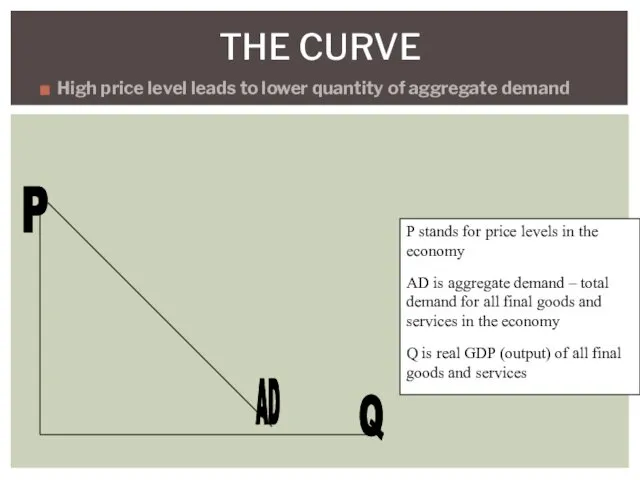
High price level leads to lower quantity of aggregate demand
THE CURVE
P
AD
Q
P
High price level leads to lower quantity of aggregate demand
THE CURVE
P
AD
Q
P
 Малиновский район міста Одеси. Слайды
 Особенности рынка труда молодых специалистов, проблемы и перспективы
 Международная миграция рабочей силы
 Постоянные и переменные затраты
 Техника и технологии, или дизайн в ретроспективе формообразования предметного мира
 Основные направления развития экономической теории. Предмет и метод экономической теории. Основные экономические понятия
 Вопросы по экономике
 Прикладная экономика
 Урбанизация и её последствия
 Особенности коммерческого ценообразования
 Створення сприятливих умов праці
 Экономическое содержание и функции цены. Экономические теории стоимости в ценообразовании
 Факторы производства: проблемы их соединения и использования
 Прогнозирование денежных потоков предприятия по инвестиционной деятельности
 Теория спроса и предложения
 Bankruptcy of natural persons in Lithuania: issues and solutions
 Качество услуг и обслуживание потребителя. (Тема 10)
 Макроэкономическая нестабильность циклы и кризисы. Безработица. Инфляция
 Налоговая система объединенных арабских эмиратов
 Большие (технологические) циклы Н. Д. Кондратьева. Технологический уклад (С. Ю. Глазьев)
 Разделение труда, специализация и обмен. Типы экономических систем
 Класифікація економіко-математичних моделей
 Рынки факторов производства и формирование факторных доходов. (Тема 9)
 Экспертно-аналитические технологии и инструментальные средства подготовки и принятия управленческих решений
 Macroeconomie. (Curs 3)
 Развитие и современное состояние экономической науки в России
 Особенности работы брокера на зарубежном рынке
 Особенности проектирования фармацевтических предприятий. Стандарты при проектировании химико-фармацевтических предприятий