- Risk and Uncertainty

Содержание
- 2. Risk and Uncertainty Risk and uncertainty are similar in that they both present the problem of
- 3. Four major Sources of Uncertainty Possible inaccuracy of cash-flow estimates used in the study Type of
- 4. Possible Inaccuracy of Cash-flow estimates How much source information is available How dependable is the source
- 5. Type of Business Involved Relative to Health of Economy Some businesses will typically be more at
- 6. Type of Physical Plant and Equipment Involved Some types of structures and equipment have definite economic
- 7. Length of Study Period The longer the study period, the greater the level of uncertainty of
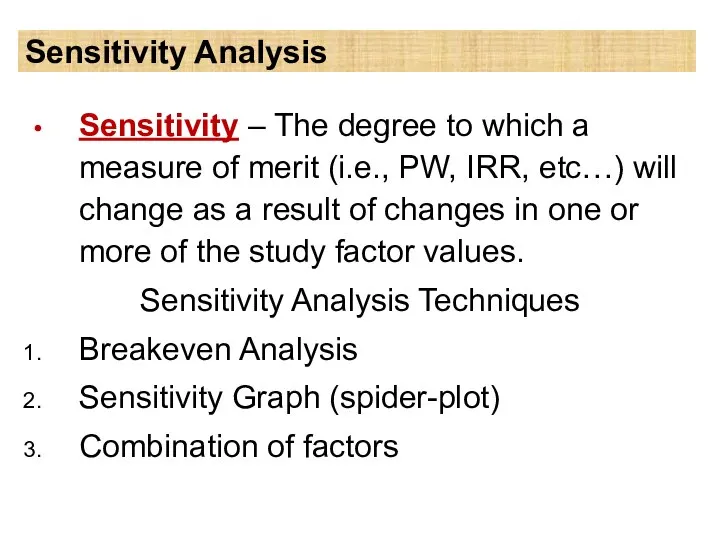
- 8. Sensitivity Analysis Sensitivity – The degree to which a measure of merit (i.e., PW, IRR, etc…)
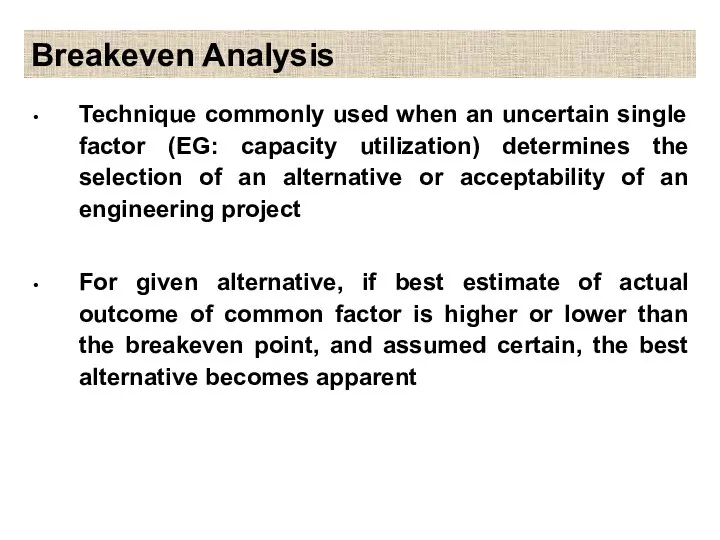
- 9. Breakeven Analysis Technique commonly used when an uncertain single factor (EG: capacity utilization) determines the selection
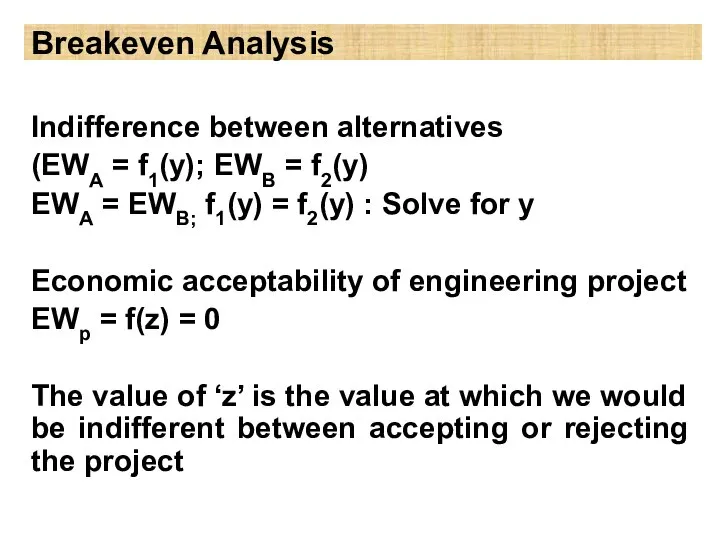
- 10. Breakeven Analysis Indifference between alternatives (EWA = f1(y); EWB = f2(y) EWA = EWB; f1(y) =
- 11. Breakeven Problem Involving Two Alternatives Most easily approached mathematically by equating an equivalent worth of the
- 12. Breakeven Analysis for Economic Acceptability of an Engineering Project Most easily approached by equating an equivalent
- 13. Example applications of Breakeven Analysis Annual revenue and expenses Rate of return Market (or salvage) value
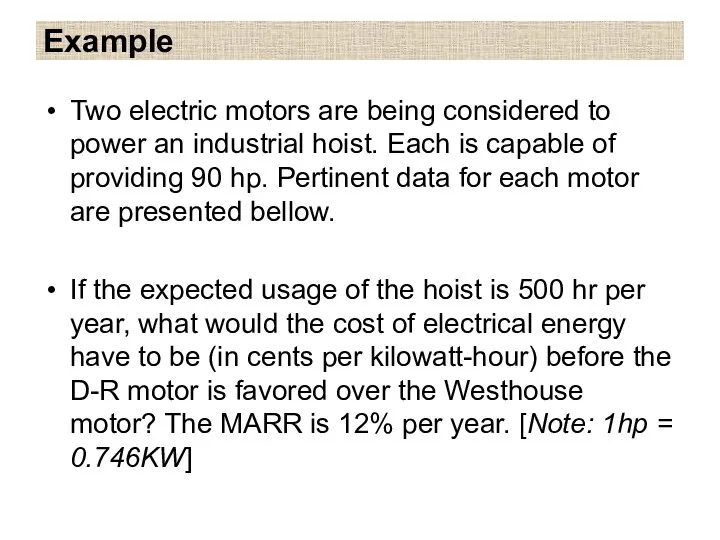
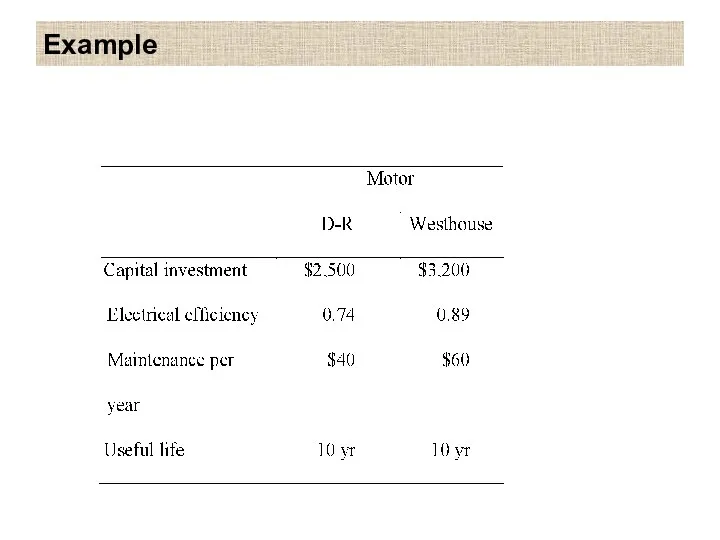
- 14. Example Two electric motors are being considered to power an industrial hoist. Each is capable of
- 15. Example
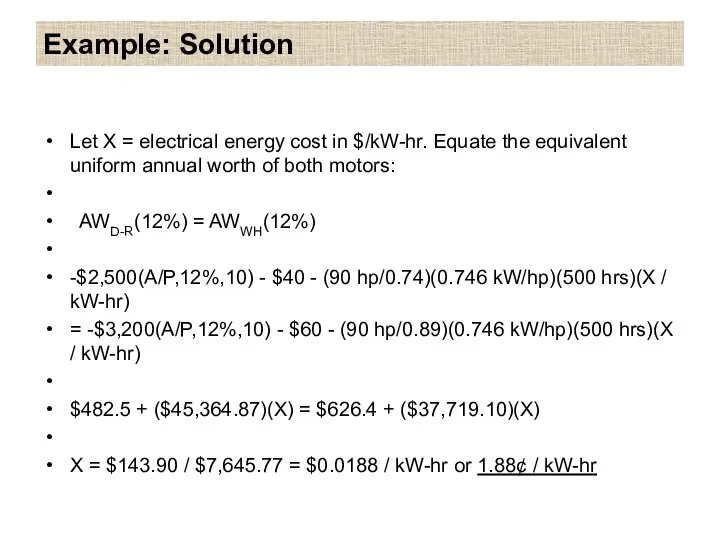
- 16. Example: Solution Let X = electrical energy cost in $/kW-hr. Equate the equivalent uniform annual worth
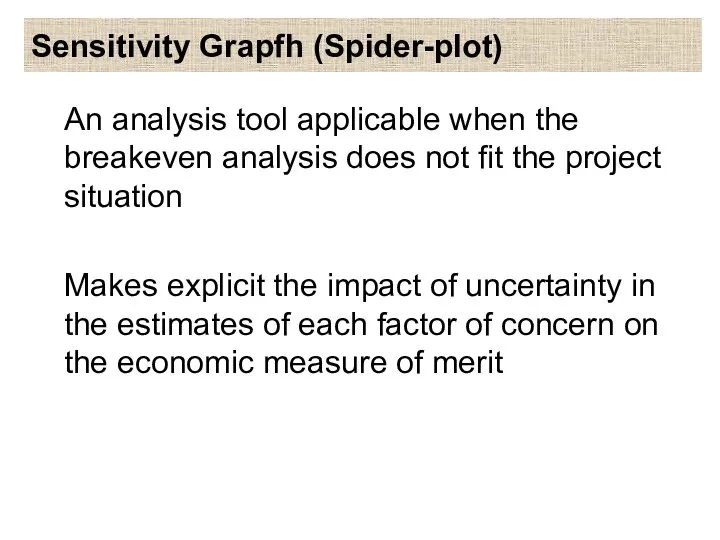
- 17. Sensitivity Grapfh (Spider-plot) An analysis tool applicable when the breakeven analysis does not fit the project
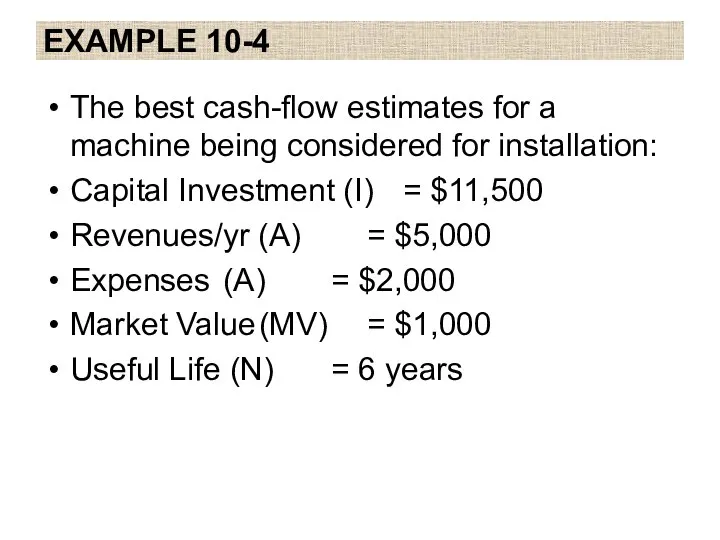
- 18. EXAMPLE 10-4 The best cash-flow estimates for a machine being considered for installation: Capital Investment (I)
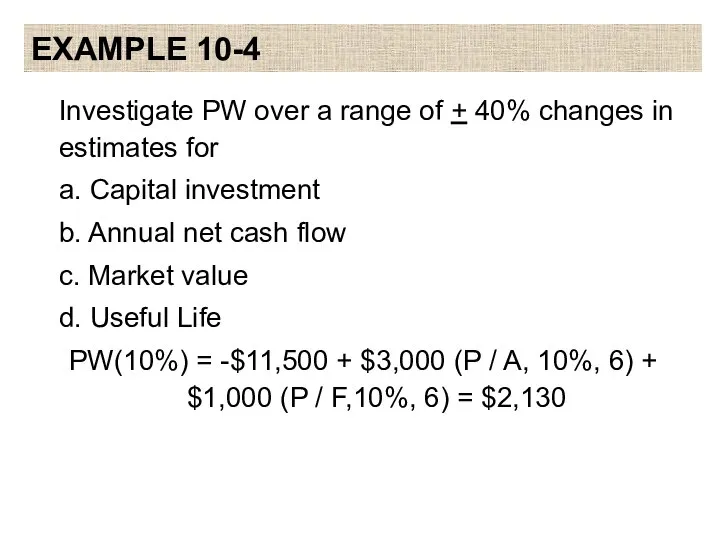
- 19. EXAMPLE 10-4 Investigate PW over a range of + 40% changes in estimates for a. Capital
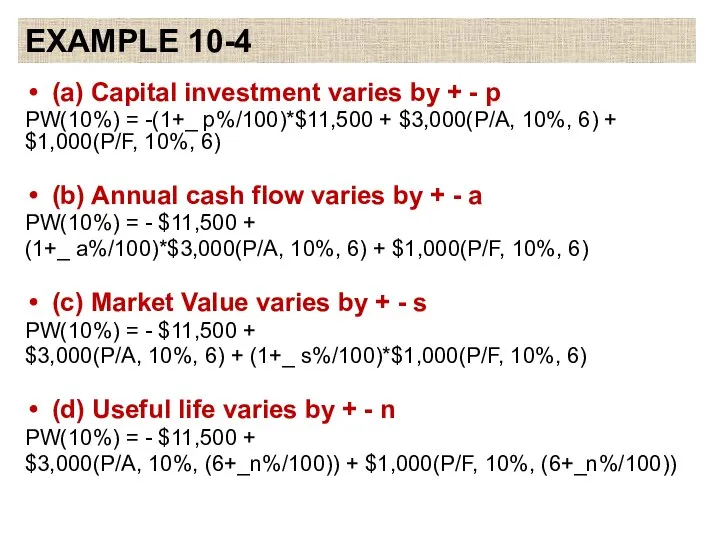
- 20. EXAMPLE 10-4 (a) Capital investment varies by + - p PW(10%) = -(1+_ p%/100)*$11,500 + $3,000(P/A,
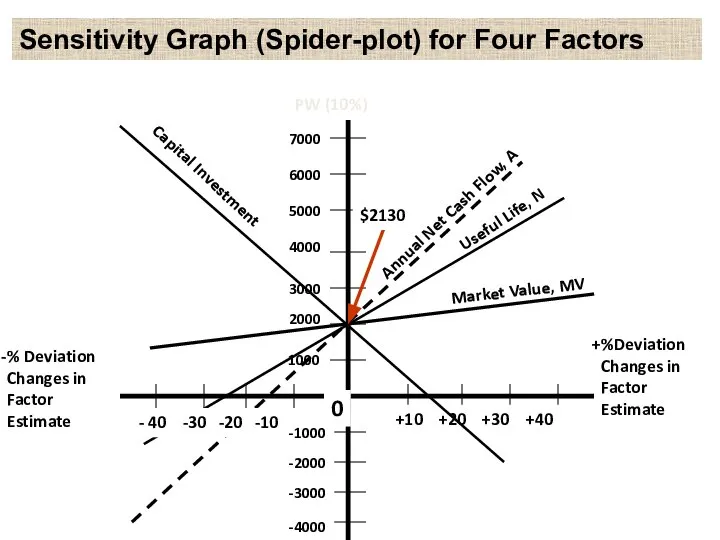
- 21. Annual Net Cash Flow, A Useful Life, N Market Value, MV 2000 Sensitivity Graph (Spider-plot) for
- 22. Revelations of Spider-plot Shows the sensitivity of the present worth to percent deviation changes in each
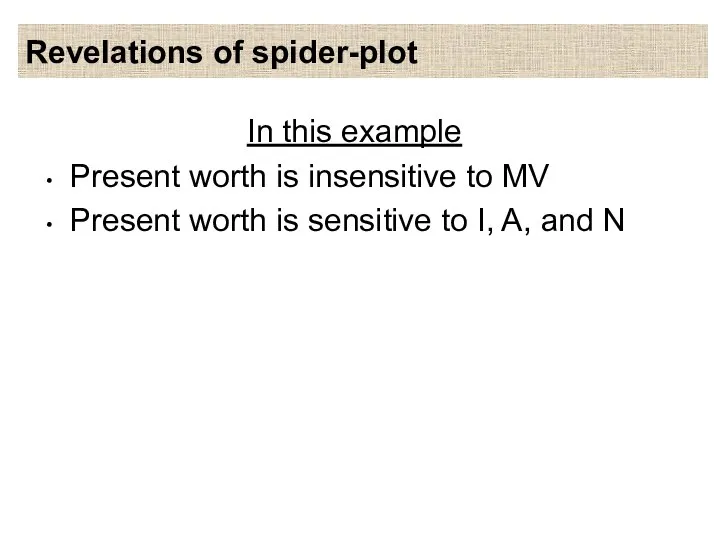
- 23. Revelations of spider-plot In this example Present worth is insensitive to MV Present worth is sensitive
- 24. Measuring Sensitivity by a Combination of Factors Develop a sensitivity graph for the project a. For
- 25. Pitfalls of Risk Adjusted MARR A widely used industrial practice for including some consideration of uncertainty
- 27. Скачать презентацию
Risk and Uncertainty
Risk and uncertainty are similar in that they
Risk and Uncertainty
Risk and uncertainty are similar in that they
Four major Sources of Uncertainty
Possible inaccuracy of cash-flow estimates used in
Four major Sources of Uncertainty
Possible inaccuracy of cash-flow estimates used in
Possible Inaccuracy of Cash-flow estimates
How much source information is available
How dependable
Possible Inaccuracy of Cash-flow estimates
How much source information is available
How dependable
Type of Business Involved Relative to Health of Economy
Some businesses will
Type of Business Involved Relative to Health of Economy
Some businesses will

Type of Physical Plant and Equipment Involved
Some types of structures and
Type of Physical Plant and Equipment Involved
Some types of structures and

Length of Study Period
The longer the study period, the greater the
Length of Study Period
The longer the study period, the greater the
Sensitivity Analysis
Sensitivity – The degree to which a measure of merit
Sensitivity Analysis
Sensitivity – The degree to which a measure of merit
Breakeven Analysis
Technique commonly used when an uncertain single factor (EG: capacity
Breakeven Analysis
Technique commonly used when an uncertain single factor (EG: capacity
Breakeven Analysis
Indifference between alternatives
(EWA = f1(y); EWB = f2(y)
EWA =
Breakeven Analysis
Indifference between alternatives
(EWA = f1(y); EWB = f2(y)
EWA =
Breakeven Problem Involving Two Alternatives
Most easily approached mathematically by equating an
Breakeven Problem Involving Two Alternatives
Most easily approached mathematically by equating an

Breakeven Analysis for Economic Acceptability of an Engineering Project
Most easily approached
Breakeven Analysis for Economic Acceptability of an Engineering Project
Most easily approached

Example applications of Breakeven Analysis
Annual revenue and expenses
Rate of return
Market
Example applications of Breakeven Analysis
Annual revenue and expenses
Rate of return
Market
Example
Two electric motors are being considered to power an industrial hoist.
Example
Two electric motors are being considered to power an industrial hoist.
Example
Example
Example: Solution
Let X = electrical energy cost in $/kW-hr. Equate the
Example: Solution
Let X = electrical energy cost in $/kW-hr. Equate the
Sensitivity Grapfh (Spider-plot)
An analysis tool applicable when the breakeven analysis does
Sensitivity Grapfh (Spider-plot)
An analysis tool applicable when the breakeven analysis does
EXAMPLE 10-4
The best cash-flow estimates for a machine being considered for
EXAMPLE 10-4
The best cash-flow estimates for a machine being considered for
EXAMPLE 10-4
Investigate PW over a range of + 40% changes in
EXAMPLE 10-4
Investigate PW over a range of + 40% changes in
EXAMPLE 10-4
(a) Capital investment varies by + - p
PW(10%) = -(1+_
EXAMPLE 10-4
(a) Capital investment varies by + - p
PW(10%) = -(1+_
Annual Net Cash Flow, A
Useful Life, N
Market Value, MV
2000
Sensitivity Graph (Spider-plot)
Annual Net Cash Flow, A
Useful Life, N
Market Value, MV
2000
Sensitivity Graph (Spider-plot)

Revelations of Spider-plot
Shows the sensitivity of the present worth to percent
Revelations of Spider-plot
Shows the sensitivity of the present worth to percent
Revelations of spider-plot
In this example
Present worth is insensitive to MV
Present worth
Revelations of spider-plot
In this example
Present worth is insensitive to MV
Present worth
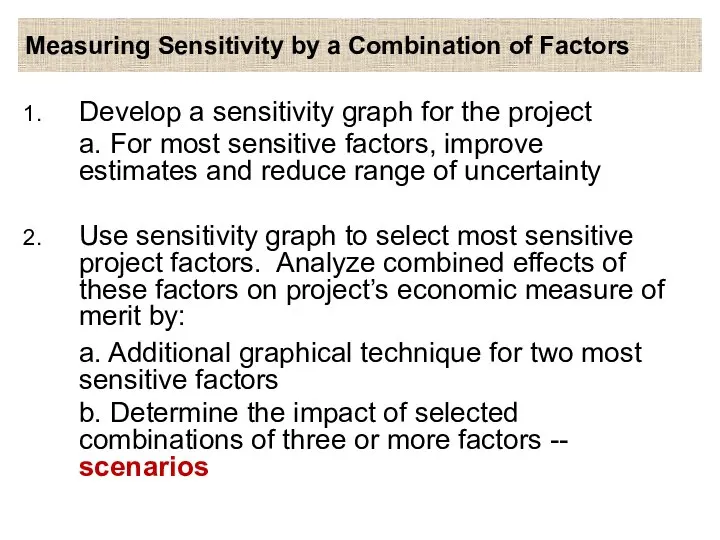
Measuring Sensitivity by a Combination of Factors
Develop a sensitivity graph for
Measuring Sensitivity by a Combination of Factors
Develop a sensitivity graph for
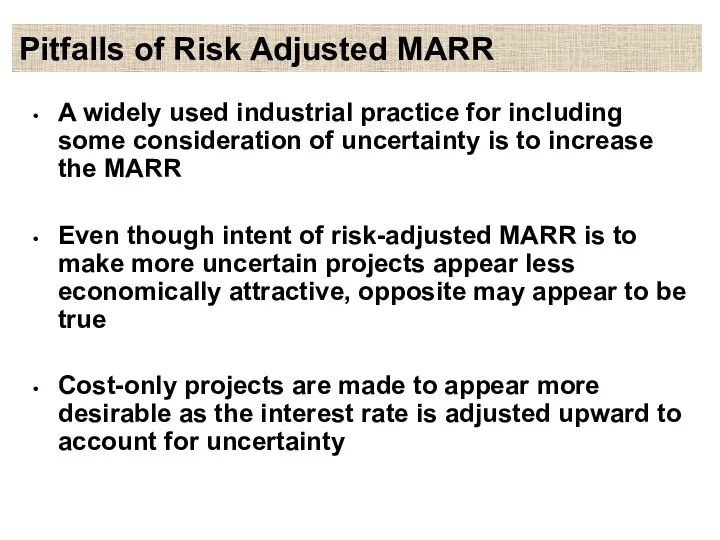
Pitfalls of Risk Adjusted MARR
A widely used industrial practice for including
Pitfalls of Risk Adjusted MARR
A widely used industrial practice for including
 Презентация по экономике Анализ спроса и потребительское поведение
  Цена в условиях совершенной конкуренции
 Экономика Норвегии
 Перспективные проекты упрощения процедур торговли в Евразийском экономическом сообществе
 ЧИСТАЯ МОНОПОЛИЯ Главная прелесть монополии в том, что она дарует безмятежную жизнь. Дж. Р. Хикс, английский экономист
 Основные макроэкономические показатели
 Экономика и политическая карта Древнего Востока
 Государственное регулирование инновационной деятельности
 Устойчивость функционирования объектов экономики
 Типы экономических систем
 Предмет и метод институциональной экономики
 Оценочные показатели размещения производительных сил и социально-экономического развития регионов
 Семинары FIABCI в Городе Киров. Путь к успеху и процветанию на основе международного опыта. Инновации рынка недвижимости
 Управление запасами
 Спрос и предложение. Дополнительные аспекты
 Документальное оформление поступления и расходования материальных ценностей
 Организация производственного процесса. Лекция 3
 Предмет, система методов и функции экономической теории. Общие проблемы экономического развития
 Макроэкономика. Критика теории реального экономического цикла. (Лекция 3)
 Теоретические основы денежно-кредитного регулирования
 Механизм саморегуляции рынка
 Планирование производства и сбыта продукции
 Общественный выбор: коллективное принятие решений
 Изменения численности населения мира. Причины и следствия
 Решаем кейсы: с чего начать?
 Презентация Особенности возбуждения уголовных дел
 Участие Республики Хорватия в интеграционном взаимодействии
 Особые экономические зоны