- SCP case study: The American agriculture industry

Содержание
- 2. SCP case study: The American agriculture industry
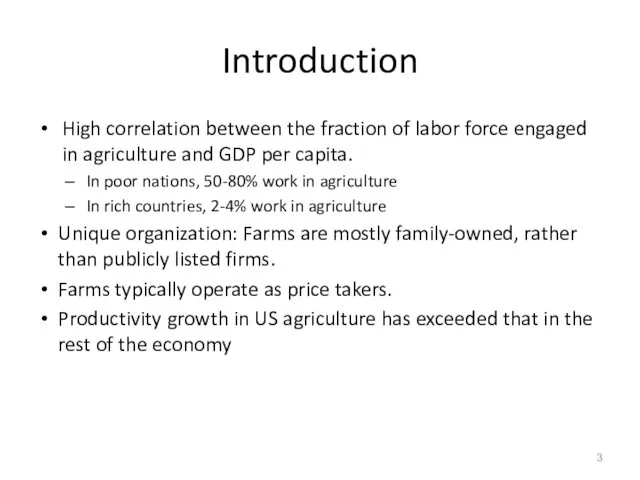
- 3. Introduction High correlation between the fraction of labor force engaged in agriculture and GDP per capita.
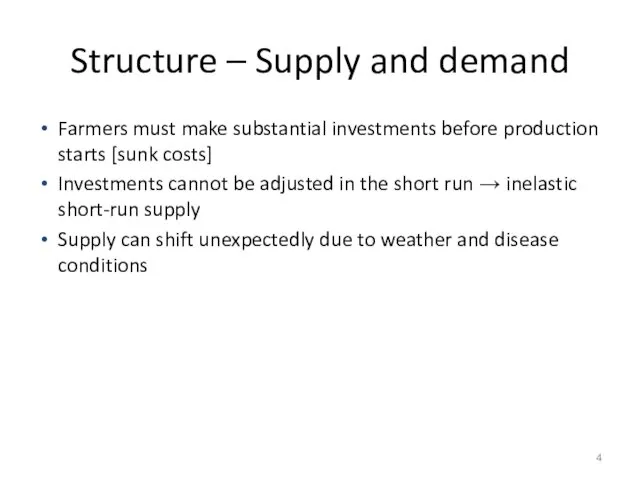
- 4. Structure – Supply and demand Farmers must make substantial investments before production starts [sunk costs] Investments
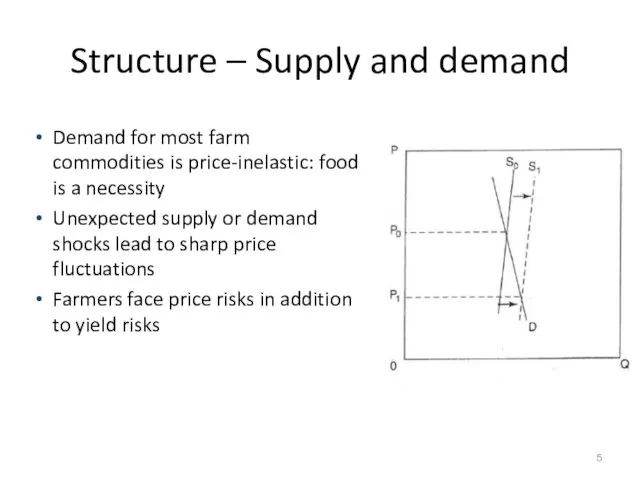
- 5. Structure – Supply and demand Demand for most farm commodities is price-inelastic: food is a necessity
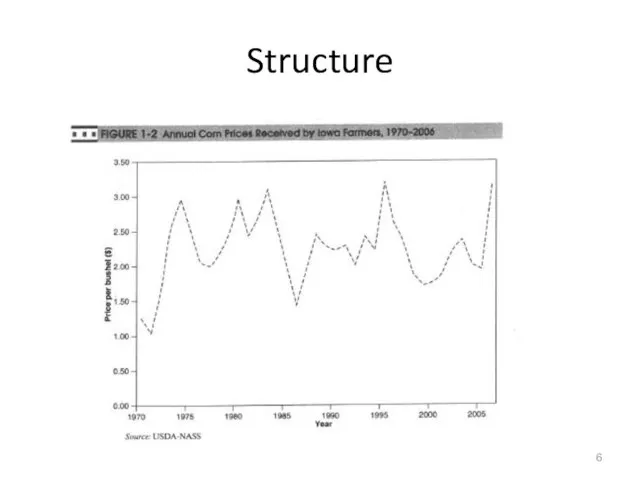
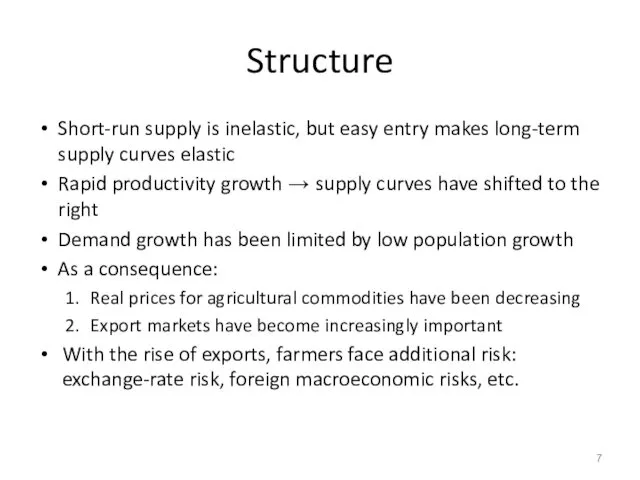
- 6. Structure
- 7. Structure Short-run supply is inelastic, but easy entry makes long-term supply curves elastic Rapid productivity growth
- 8. Structure
- 9. Trends in US farm structure The number of farms peaked at 6.8 million in 1935, and
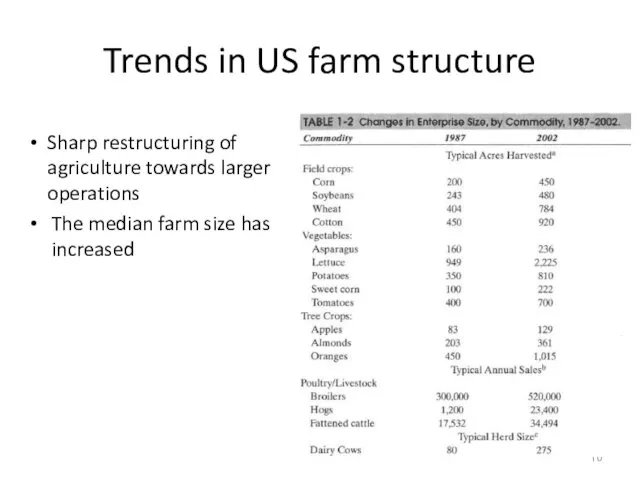
- 10. Trends in US farm structure Sharp restructuring of agriculture towards larger operations The median farm size
- 11. Family farms, profits and household income, 2003 Large farms are more profitable than small farms ?
- 12. Variation in profitability Considerable variation in profitability, many small farms remain profitable: Risk variability (climate, natural
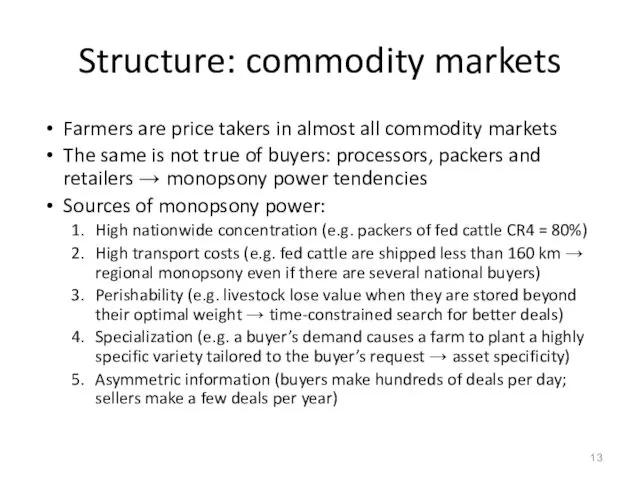
- 13. Structure: commodity markets Farmers are price takers in almost all commodity markets The same is not
- 14. Vertical linkages A large share of farmers rely on long-term contracts with a specific buyer, ranging
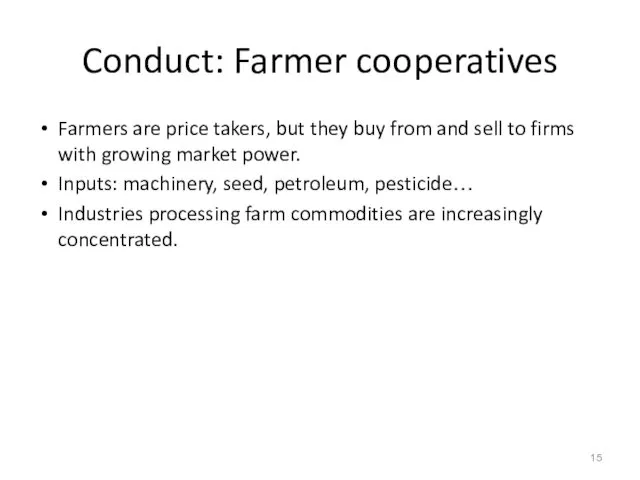
- 15. Conduct: Farmer cooperatives Farmers are price takers, but they buy from and sell to firms with
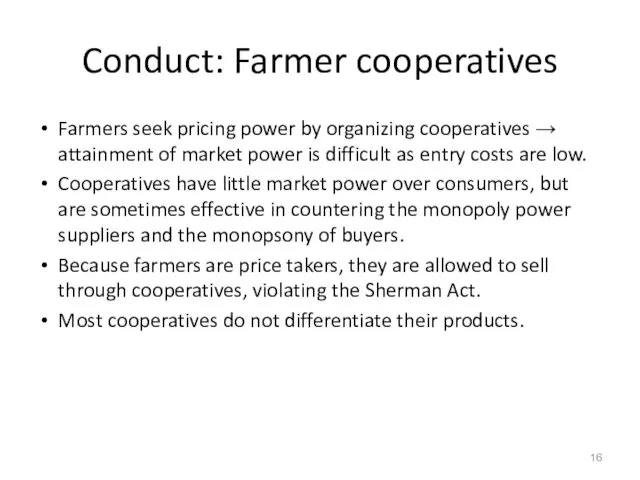
- 16. Conduct: Farmer cooperatives Farmers seek pricing power by organizing cooperatives → attainment of market power is
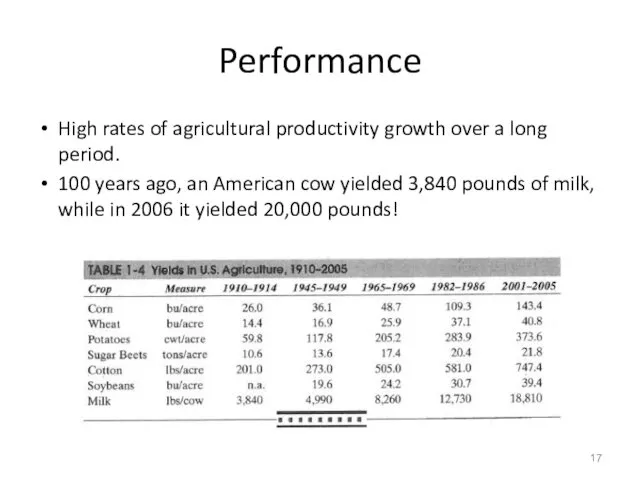
- 17. Performance High rates of agricultural productivity growth over a long period. 100 years ago, an American
- 18. Performance Total factor productivity accounts for the quantity of all inputs that is used to produce
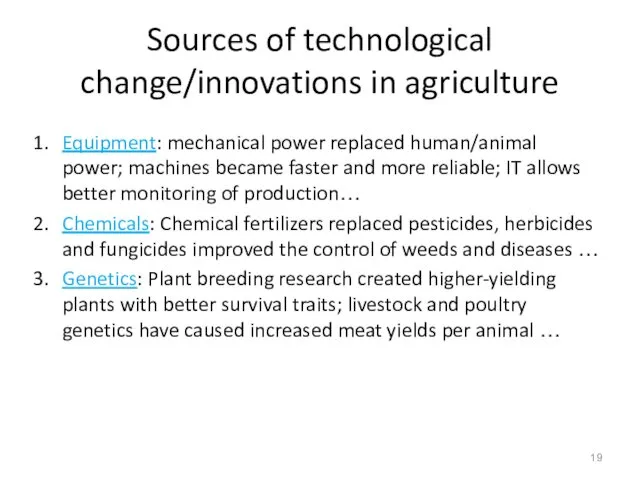
- 19. Sources of technological change/innovations in agriculture Equipment: mechanical power replaced human/animal power; machines became faster and
- 20. Sources of technological change/innovations in agriculture Farmers rarely develop the innovations themselves. Most are developed by
- 21. Overall performance over time More efficient production over time. Larger farms have tended to be more
- 22. Revision
- 23. Module structure Structure ? Conduct ? Performance Market definition Concentration measures Concentration determinants Testing SCP, NEIO
- 24. Structure ? Conduct ? Performance The SCP paradigm The number and size distribution of firms Entry
- 25. Structure ? Conduct ? Performance Conduct to structure? R&D, advertising, differentiation Performance to structure? Growth and
- 26. Concentration and profits in America
- 27. Market power and welfare
- 28. Market power and welfare Application to internet monopolies Does the internet favour such quasi-monopolies? Are digital
- 29. Market definition Relevant product market
- 30. Market definition Relevant geographic market CED and CES analysis Limitations of market definition Market definition remains
- 31. Measures of concentration Hannah –Kay criteria CRn HH HK Gini Advantages? General Limitations? Specific Limitations?
- 32. Determinants of concentration More concentration Less concentration Sunk costs: endogenous or exogenous Industry life cycle Gibrat’s
- 33. Determinants of concentration
- 34. Views on SCP Abuse of market power Concentration Profits Efficiency Profitability Firm Growth Concentration SCP: Chicago:
- 35. Structure and profitability
- 36. NEIO Revenue test (Rosse Panzar) Monopoly: H Perfect competition: H=1 Effect of costs on revenue Structural
- 37. Conduct Implications of market structure Advertising R&D Product differentiation
- 38. Market structure and advertising Dorfman-Steiner condition Monopoly advertising Oligopoly advertising Keywords: AED/PED, impact of advertising on
- 39. Market structure and advertising Concentration Advertising Dorfman-Steiner Entry barriers, sunk costs, Informative vs. persuasive advertising
- 40. Welfare and advertising Persuasive advertising Which preferences to consider? Advertising can increase/decrease welfare New or original
- 41. R&D and market structure Schumpeter hypothesis Prospect of monopoly power Arrow Replacement effect High concentration Perfect
- 42. R&D and market structure Development time Incentive to accelerate innovation Oligopoly? Dasgupta & Stiglitz Aggregate R&D
- 43. Innovation protection Patents Optimal patent system Trade-off: R&D expenditures and DWL Length vs. breadth Side effects
- 44. Product differentiation Sources of differentiation Geography Technology Brand Preferences Services Factors influencing differentiation Monopolistic competition Elasticity
- 45. Exam structure 1.5 hour Secton A: Answer ONE question from TWO. ? Two essay questions Section
- 46. Do not reproduce prepared essays without regard to what the question asks Before you answer… Choose
- 47. Good Practice Use examples whenever possible to support arguments Define technical terms as you introduce them,
- 48. More Good Practice Label graph axes etc. Explain diagrammes or figures Equations/figures etc that are merely
- 49. Bullet Points Answers? Reproducing bullet points does not constitute a good answer, even if the points
- 51. Скачать презентацию
SCP case study:
The American agriculture industry
SCP case study:
The American agriculture industry
Introduction
High correlation between the fraction of labor force engaged in agriculture
Introduction
High correlation between the fraction of labor force engaged in agriculture
Structure – Supply and demand
Farmers must make substantial investments before production
Structure – Supply and demand
Farmers must make substantial investments before production
Structure – Supply and demand
Demand for most farm commodities is price-inelastic:
Structure – Supply and demand
Demand for most farm commodities is price-inelastic:
Structure
Structure
Structure
Short-run supply is inelastic, but easy entry makes long-term supply curves
Structure
Short-run supply is inelastic, but easy entry makes long-term supply curves

Structure
Structure

Trends in US farm structure
The number of farms peaked at 6.8
Trends in US farm structure
The number of farms peaked at 6.8
Trends in US farm structure
Sharp restructuring of agriculture towards larger operations
The
Trends in US farm structure
Sharp restructuring of agriculture towards larger operations
The

Family farms, profits and household income, 2003
Large farms are more profitable
Family farms, profits and household income, 2003
Large farms are more profitable

Variation in profitability
Considerable variation in profitability, many small farms remain profitable:
Risk
Variation in profitability
Considerable variation in profitability, many small farms remain profitable:
Risk
Structure: commodity markets
Farmers are price takers in almost all commodity markets
The
Structure: commodity markets
Farmers are price takers in almost all commodity markets
The

Vertical linkages
A large share of farmers rely on long-term contracts with
Vertical linkages
A large share of farmers rely on long-term contracts with
Conduct: Farmer cooperatives
Farmers are price takers, but they buy from
Conduct: Farmer cooperatives
Farmers are price takers, but they buy from
Conduct: Farmer cooperatives
Farmers seek pricing power by organizing cooperatives →
Conduct: Farmer cooperatives
Farmers seek pricing power by organizing cooperatives →
Performance
High rates of agricultural productivity growth over a long period.
100 years
Performance
High rates of agricultural productivity growth over a long period.
100 years

Performance
Total factor productivity accounts for the quantity of all inputs that
Performance
Total factor productivity accounts for the quantity of all inputs that
Sources of technological change/innovations in agriculture
Equipment: mechanical power replaced human/animal power;
Sources of technological change/innovations in agriculture
Equipment: mechanical power replaced human/animal power;

Sources of technological change/innovations in agriculture
Farmers rarely develop the innovations themselves.
Sources of technological change/innovations in agriculture
Farmers rarely develop the innovations themselves.
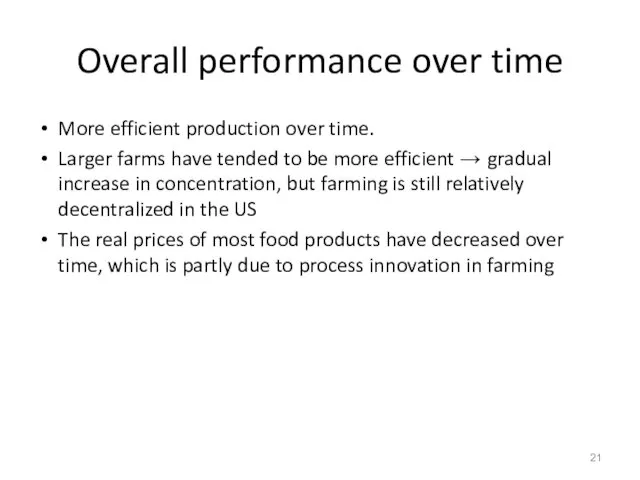
Overall performance over time
More efficient production over time.
Larger farms have tended
Overall performance over time
More efficient production over time.
Larger farms have tended

Revision
Revision
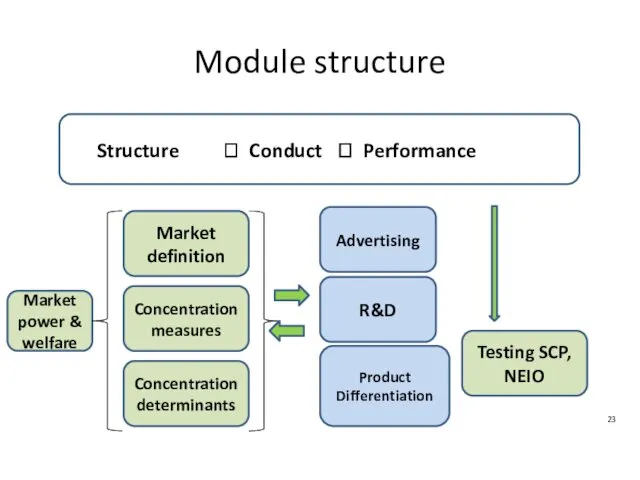
Module structure
Structure ? Conduct ? Performance
Market definition
Concentration measures
Concentration determinants
Testing SCP,
Module structure
Structure ? Conduct ? Performance
Market definition
Concentration measures
Concentration determinants
Testing SCP,
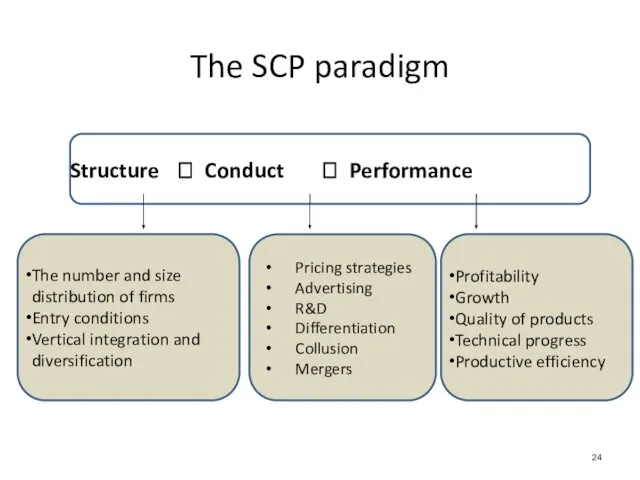
Structure ? Conduct ? Performance
The SCP paradigm
The number and size distribution
The SCP paradigm
The number and size distribution
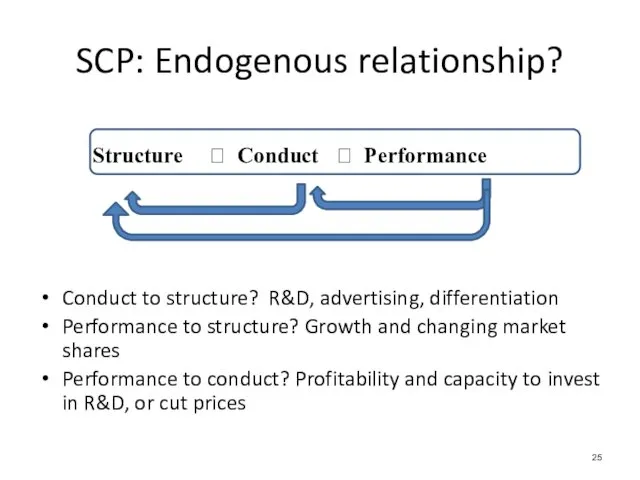
Structure ? Conduct ? Performance
Conduct to structure? R&D, advertising, differentiation
Performance to
Conduct to structure? R&D, advertising, differentiation
Performance to
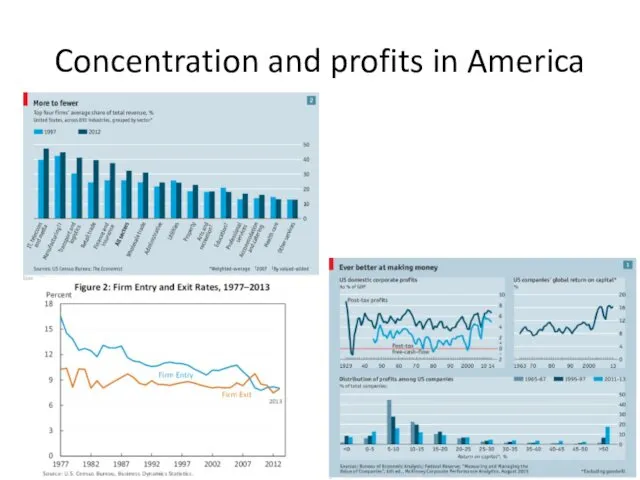
Concentration and profits in America
Concentration and profits in America
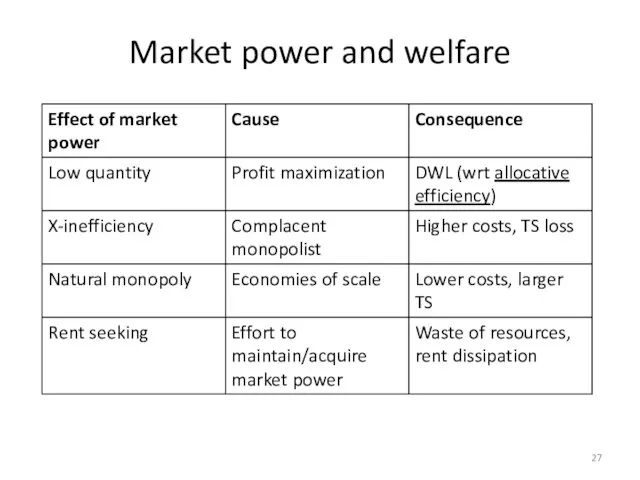
Market power and welfare
Market power and welfare
Market power and welfare
Application to internet monopolies
Does the internet favour such
Market power and welfare
Application to internet monopolies
Does the internet favour such
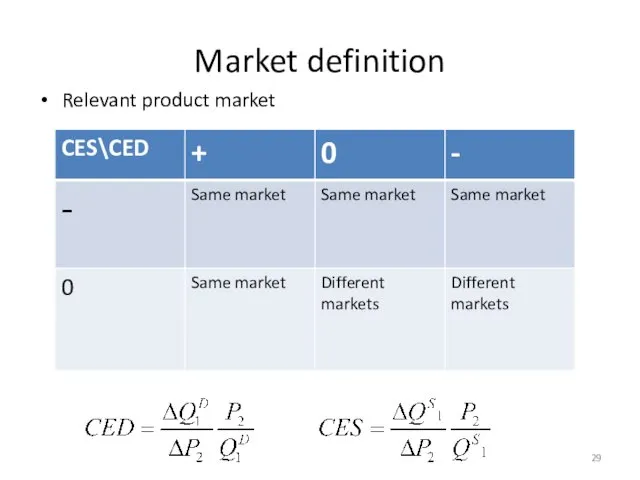
Market definition
Relevant product market
Market definition
Relevant product market

Market definition
Relevant geographic market
CED and CES analysis
Limitations of market definition
Market definition
Market definition
Relevant geographic market
CED and CES analysis
Limitations of market definition
Market definition
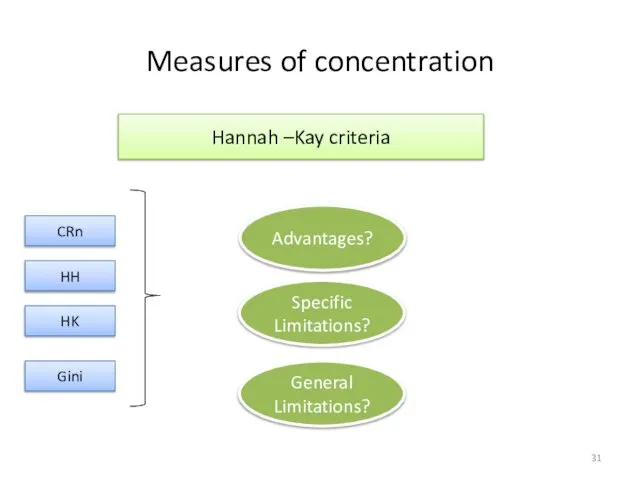
Measures of concentration
Hannah –Kay criteria
CRn
HH
HK
Gini
Advantages?
General Limitations?
Specific Limitations?
Measures of concentration
Hannah –Kay criteria
CRn
HH
HK
Gini
Advantages?
General Limitations?
Specific Limitations?

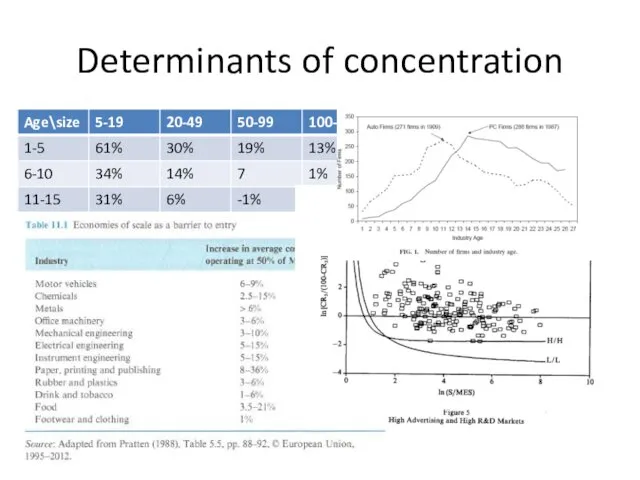
Determinants of concentration
More concentration
Less
concentration
Sunk costs: endogenous or exogenous
Industry life cycle
Gibrat’s
Determinants of concentration
More concentration
Less
concentration
Sunk costs: endogenous or exogenous
Industry life cycle
Gibrat’s
Determinants of concentration
Determinants of concentration

Views on SCP
Abuse of market
power
Concentration
Profits
Efficiency
Profitability
Firm
Growth
Concentration
SCP:
Chicago:
school
Issue 1: Measurement of profitability
Tobin’s
Views on SCP
Abuse of market
power
Concentration
Profits
Efficiency
Profitability
Firm
Growth
Concentration
SCP:
Chicago:
school
Issue 1: Measurement of profitability
Tobin’s
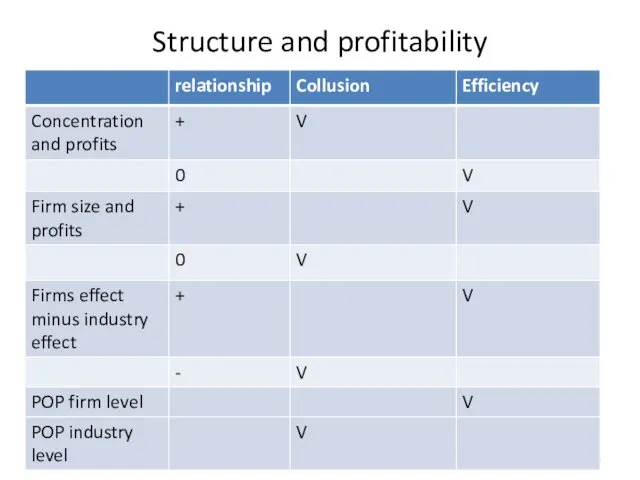
Structure and profitability
Structure and profitability
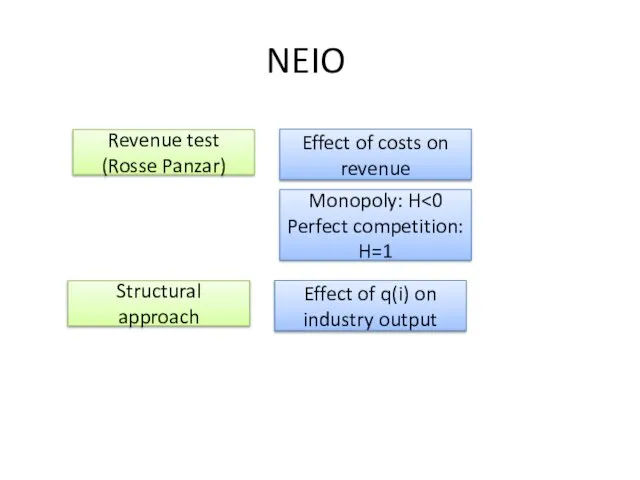
NEIO
Revenue test (Rosse Panzar)
Monopoly: H<0
Perfect competition: H=1
Effect of costs on revenue
Structural
NEIO
Revenue test (Rosse Panzar)
Monopoly: H<0
Perfect competition: H=1
Effect of costs on revenue
Structural
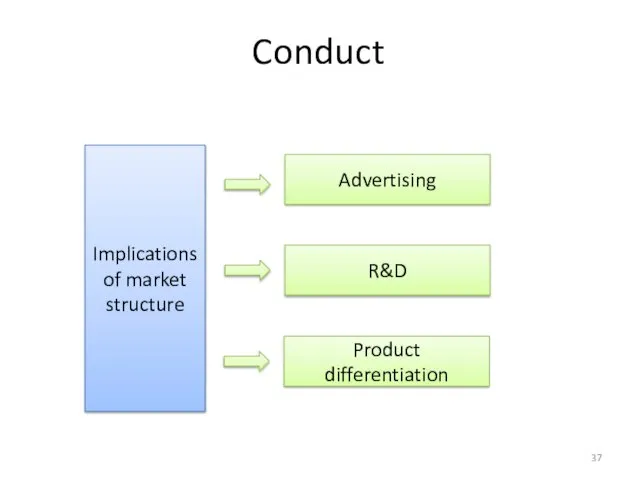
Conduct
Implications of market structure
Advertising
R&D
Product differentiation
Conduct
Implications of market structure
Advertising
R&D
Product differentiation

Market structure and advertising
Dorfman-Steiner condition
Monopoly advertising
<
Oligopoly advertising
Keywords: AED/PED, impact of advertising
Market structure and advertising
Dorfman-Steiner condition
Monopoly advertising
<
Oligopoly advertising
Keywords: AED/PED, impact of advertising

Market structure and advertising
Concentration
Advertising
Dorfman-Steiner
Entry barriers, sunk costs,
Informative vs. persuasive advertising
Market structure and advertising
Concentration
Advertising
Dorfman-Steiner
Entry barriers, sunk costs,
Informative vs. persuasive advertising

Welfare and advertising
Persuasive advertising
Which preferences to consider?
Advertising can increase/decrease welfare
New
Welfare and advertising
Persuasive advertising
Which preferences to consider?
Advertising can increase/decrease welfare
New

R&D and market structure
Schumpeter hypothesis
Prospect of monopoly power
Arrow
Replacement effect
High concentration
Perfect competition
Potential
R&D and market structure
Schumpeter hypothesis
Prospect of monopoly power
Arrow
Replacement effect
High concentration
Perfect competition
Potential
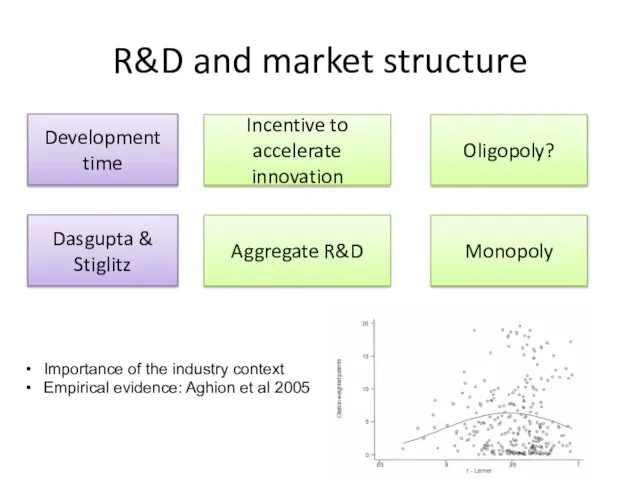
R&D and market structure
Development time
Incentive to accelerate innovation
Oligopoly?
Dasgupta & Stiglitz
Aggregate R&D
Monopoly
Importance
R&D and market structure
Development time
Incentive to accelerate innovation
Oligopoly?
Dasgupta & Stiglitz
Aggregate R&D
Monopoly
Importance
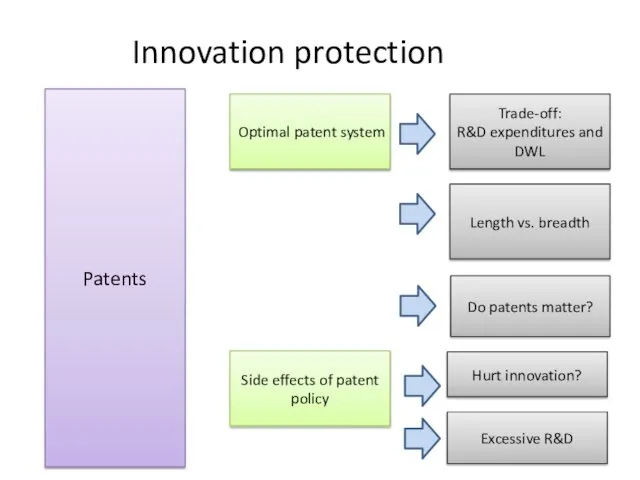
Innovation protection
Patents
Optimal patent system
Trade-off:
R&D expenditures and DWL
Length vs. breadth
Side effects of
Innovation protection
Patents
Optimal patent system
Trade-off:
R&D expenditures and DWL
Length vs. breadth
Side effects of

Product differentiation
Sources of differentiation
Geography
Technology
Brand
Preferences
Services
Factors influencing differentiation
Monopolistic competition
Elasticity of substitution
Economies of scale
Hotelling’s
Product differentiation
Sources of differentiation
Geography
Technology
Brand
Preferences
Services
Factors influencing differentiation
Monopolistic competition
Elasticity of substitution
Economies of scale
Hotelling’s
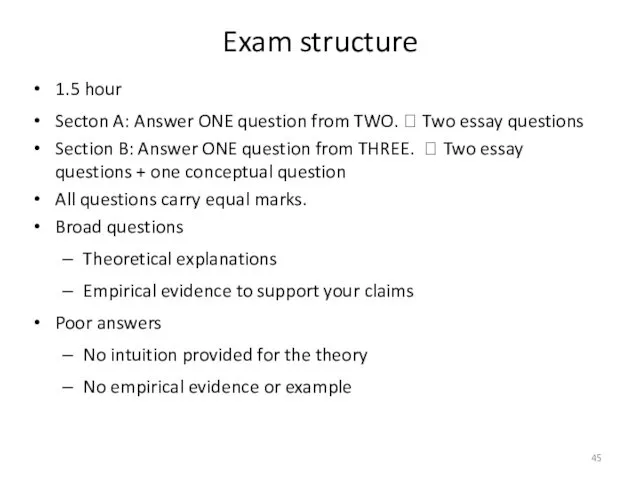
Exam structure
1.5 hour
Secton A: Answer ONE question from TWO. ? Two
Exam structure
1.5 hour
Secton A: Answer ONE question from TWO. ? Two

Do not reproduce prepared essays without regard to what the question
Do not reproduce prepared essays without regard to what the question
Good Practice
Use examples whenever possible to support arguments
Define technical terms as
Good Practice
Use examples whenever possible to support arguments
Define technical terms as

More Good Practice
Label graph axes etc.
Explain diagrammes or figures
Equations/figures etc that
More Good Practice
Label graph axes etc.
Explain diagrammes or figures
Equations/figures etc that

Bullet Points Answers?
Reproducing bullet points does not constitute a good answer,
Bullet Points Answers?
Reproducing bullet points does not constitute a good answer,
 Международная торговля товарами и услугами
 Мировое хозяйство
 Экономическая деятельность ВНП
 Қазақстандағы әртүрлі әлеуметтік және мәдени топтар арасындағы қатынастар
 Экономическая система общества. Типы экономических систем
 Слайды. Винницкая область
 Интернет-исследование. Виниловые наклейки
 Макроэкономические показатели и система национального счетоводства
 Виды, причины и последствия инфляции
 AGC Automotive Europe. Базовые принципы 2014
 Урбанизация и её последствия
 Количественная оценка экономических рисков
 Licensed products vs pirates
 Особенности инновационных работ
 Регион как целостное образование. Комплексный подход при характеристике региональных взаимосвязей
 Роль государства в экономике. ВВП. ВНП. НД
 Международная экономическая интеграция. Сущность, формы и роль в современной мировой экономике
 Выявление перспективных рынков сбыта промышленной продукции крымских предприятий в условиях санкций
 Микроэкономическое обоснование макроэкономических моделей: потребительская и инвестиционная функции
 Проект «Биогазовый комплекс»
 Адам Сміт
 Финансы организаций. Оборотные средства. (Тема 3.3)
 OEE – czyli całkowita efektywność wyposażenia,
 Анализ рисков в проекте
 Определение экономически выгодной толщины теплоизоляции трубопровода тепловой сети
 Эконометрика-II. Оценивание SVAR в EViews 6
 Формирование и развитие объектов инфраструктуры муниципального образования на примере городского поселения Видное
 Географические объекты и явления