- The data of macroeconomics

Содержание
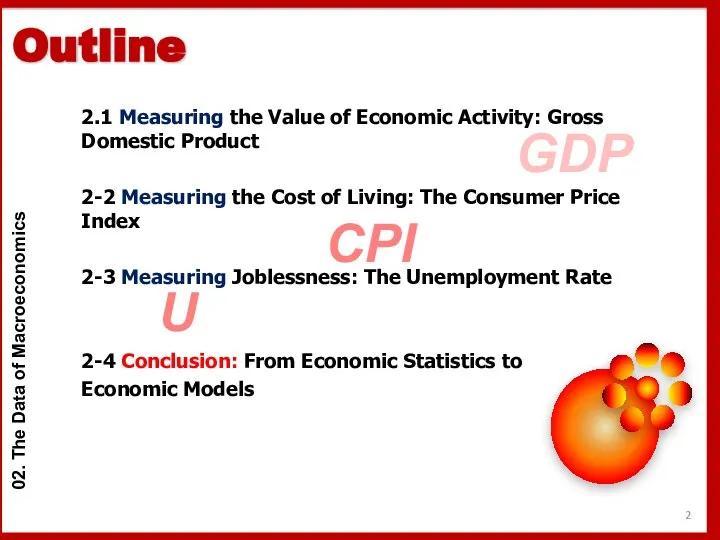
- 2. 2.1 Measuring the Value of Economic Activity: Gross Domestic Product 2-2 Measuring the Cost of Living:
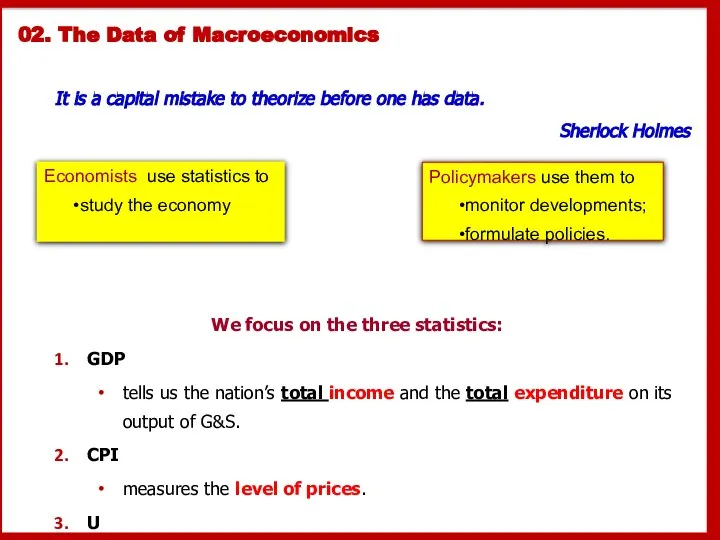
- 3. 02. The Data of Macroeconomics It is a capital mistake to theorize before one has data.
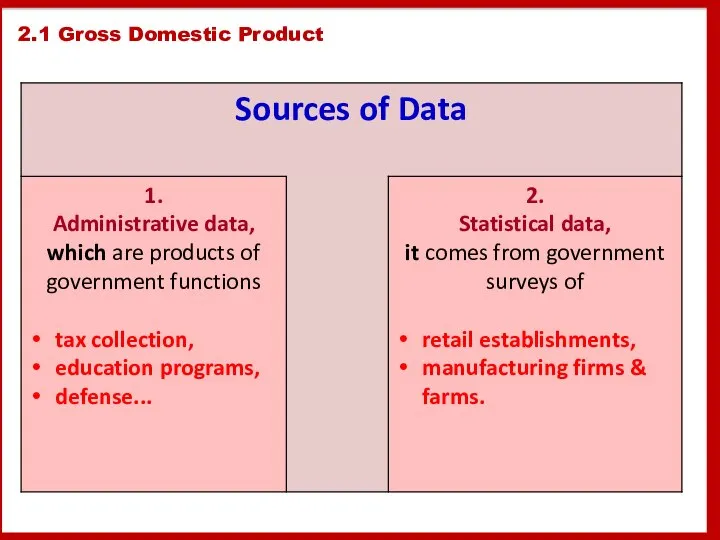
- 4. 2.1 Gross Domestic Product
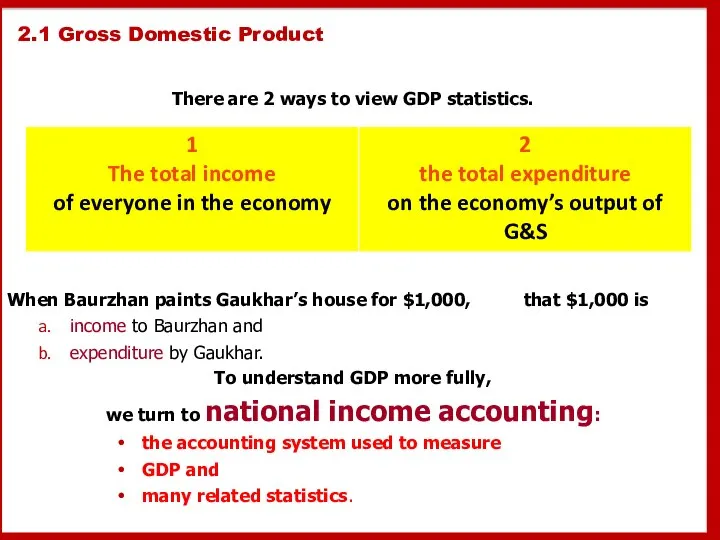
- 5. 2.1 Gross Domestic Product There are 2 ways to view GDP statistics. Income must equal expenditure.
- 6. 2.1 Measuring the Value of Economic Activity: Gross Domestic Product Income, Expenditure, and the Circular Flow
- 7. A stock is a quantity measured at a given point in time, A flow is a
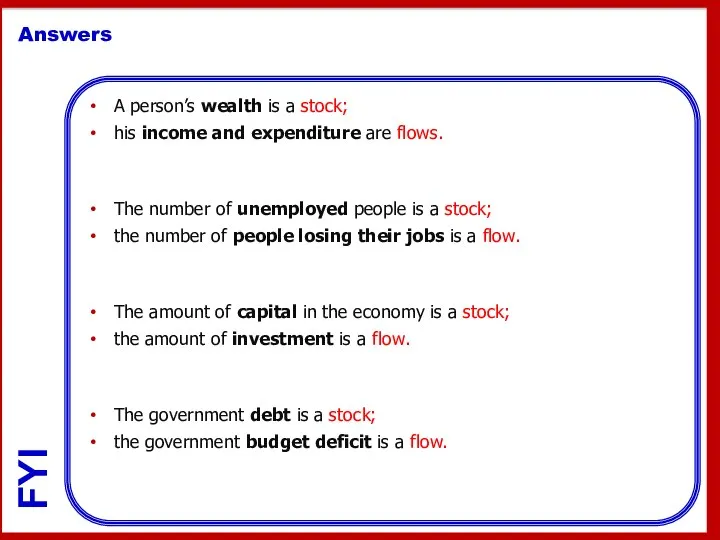
- 8. A person’s wealth is a stock; his income and expenditure are flows. The number of unemployed
- 9. A person’s wealth is a stock; his income and expenditure are flows. The number of unemployed
- 10. GDP = (Price of Apples × Quantity of Apples) + (Price of Oranges × Quantity of
- 11. Intermediate Goods and Value Added GDP is the total value of final G&S produced. Examle A
- 12. Housing Services and Other Imputations Some G&S are not sold in the marketplace and do not
- 13. 2.1 Measuring the Value of Economic Activity: Gross Domestic Product Income, Expenditure, and the Circular Flow
- 14. The imperfections are most PROBLEMATIC when comparing standards of living across countries. The imperfections remains fairly
- 15. E X A M P L E Real GDP in 2011 would be Real GDP =
- 16. GDP deflator or implicit price deflator for GDP, is the ratio of nominal GDP to real
- 17. Chain-weighted measures of real GDP, 1995 The base year changes continuously over time. This CWM of
- 18. TWO ARITHMETIC TRICKS FOR WORKING WITH PERCENTAGE CHANGES growth in Y+ growth in P = 8%
- 19. The national income accounts divide GDP into four broad categories of spending: 2.1 Gross Domestic Product
- 20. WHAT IS INVESTMENT?
- 21. GDP AND ITS COMPONENTS
- 22. GNP Gross national product = GDP + Factor Payments from Abroad – Factor Payments to Abroad.
- 23. NI national income ≈NNP They two differ by a small correction called the statistical discrepancy, which
- 24. I - Workers 1 Compensation of employees (63%). II -Firms 2 Corporate profits (14%). The income
- 25. Personal Income = National Income − Indirect Business Taxes − Corporate Profits + Dividends − Social
- 26. Most of the economic statistics reported in the newspaper are seasonally adjusted. This means that the
- 27. The increase in the overall level of prices, called inflation. The most commonly used measure of
- 28. The PRODUCER price index, a typical basket of goods bought by firms. price indexes for SPECIFIC
- 29. GDP deflator measures the prices of All G&S produced includes only those goods produced domestically assigns
- 30. The GDP Deflator and the CPI This figure shows the % change in the GDP deflator
- 31. 2-2 Measuring the Cost of Living: The Consumer Price Index The Price of a Basket of
- 32. Why the CPI Overstate Inflation? One problem is the substitution bias we have already discussed. A
- 33. Cavallo and Rigobon collect data on the prices charged by ONLINE retailers. From their offices in
- 34. The unemployment rate is the statistic that measures the % of those people wanting to work
- 35. Who wants a job but has given up looking—a discouraged worker— is counted as not being
- 37. TRENDS IN LABOR-FORCE PARTICIPATION Labor-Force Participation. Over the past several decades, the labor-force participation rate for
- 38. 2-3 Measuring Joblessness: The Unemployment Rate The Household Survey The Establishment Survey
- 39. 2-4 Conclusion: From Economic Statistics to Economic Models The three statistics quantify the performance of the
- 41. Скачать презентацию
2.1 Measuring the Value of Economic Activity: Gross Domestic Product
2-2
2.1 Measuring the Value of Economic Activity: Gross Domestic Product
2-2
02. The Data of Macroeconomics
It is a capital mistake to theorize
02. The Data of Macroeconomics
It is a capital mistake to theorize
2.1 Gross Domestic Product
2.1 Gross Domestic Product
2.1 Gross Domestic Product
There are 2 ways to view GDP
2.1 Gross Domestic Product
There are 2 ways to view GDP
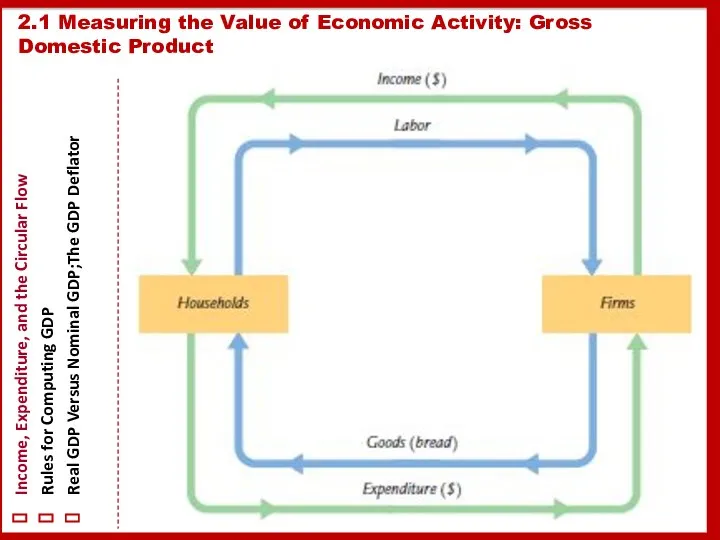
2.1 Measuring the Value of Economic Activity: Gross Domestic Product
Income,
2.1 Measuring the Value of Economic Activity: Gross Domestic Product
Income,
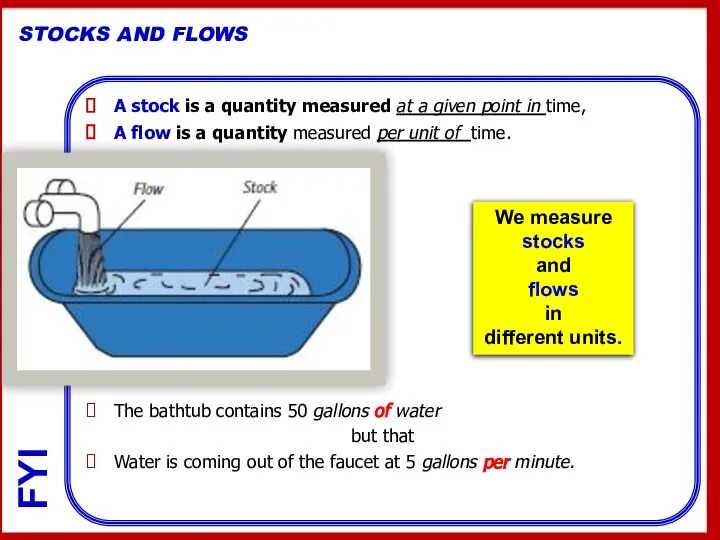
A stock is a quantity measured at a given point in
A stock is a quantity measured at a given point in
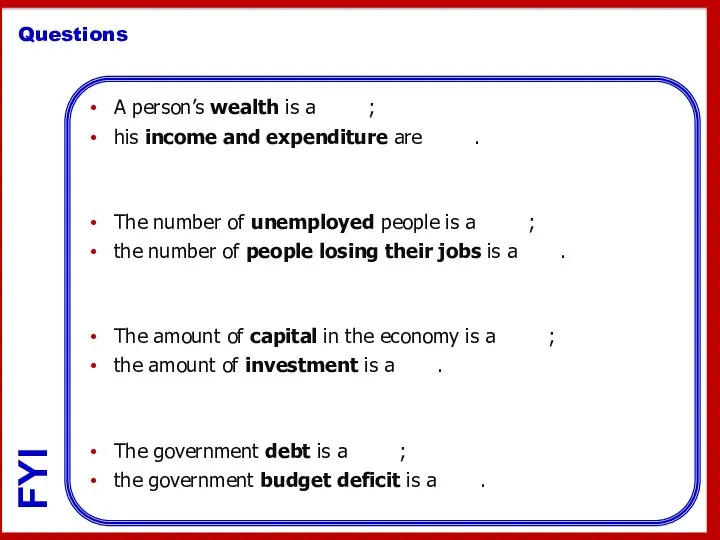
A person’s wealth is a stock;
his income and expenditure are
A person’s wealth is a stock;
his income and expenditure are
A person’s wealth is a stock;
his income and expenditure are
A person’s wealth is a stock;
his income and expenditure are
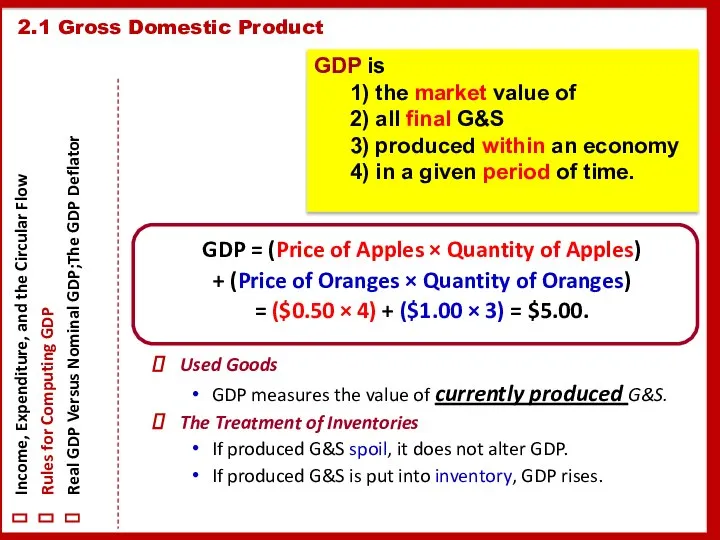
GDP = (Price of Apples × Quantity of Apples)
+ (Price of
GDP = (Price of Apples × Quantity of Apples)
+ (Price of
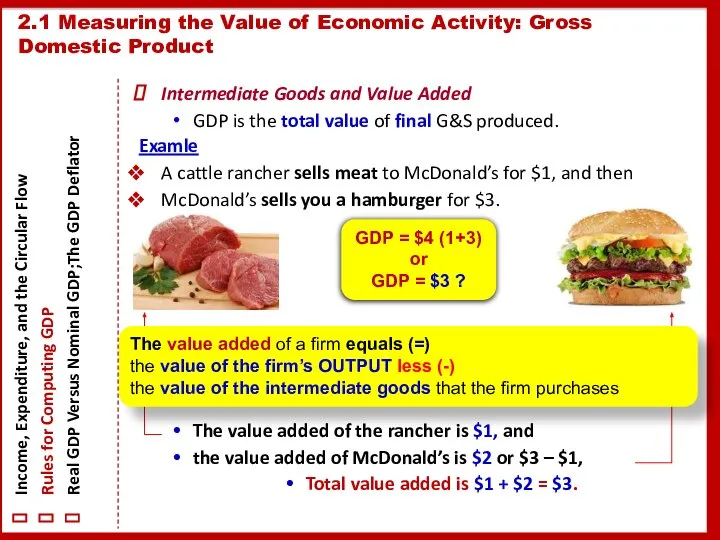
Intermediate Goods and Value Added
GDP is the total value of final
Intermediate Goods and Value Added
GDP is the total value of final

Housing Services and Other Imputations
Some G&S are
not sold in the
Housing Services and Other Imputations
Some G&S are
not sold in the

2.1 Measuring the Value of Economic Activity: Gross Domestic Product
Income,
2.1 Measuring the Value of Economic Activity: Gross Domestic Product
Income,

The imperfections are most PROBLEMATIC
when comparing standards of living across
when comparing standards of living across
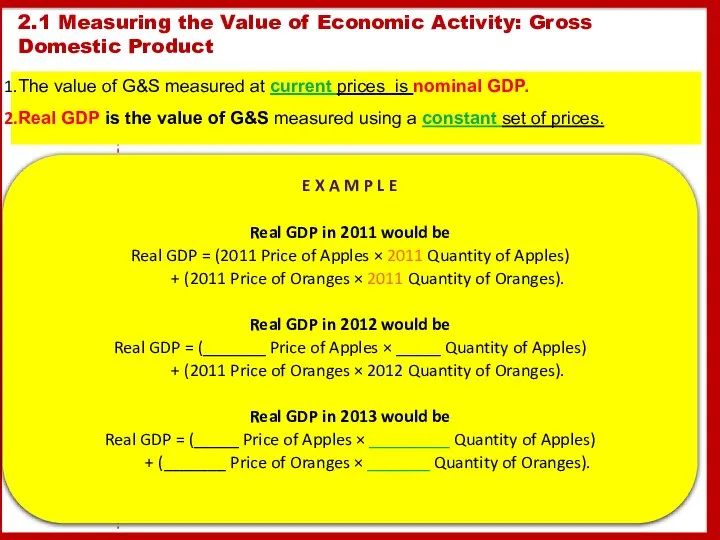
E X A M P L E
Real GDP in 2011
E X A M P L E
Real GDP in 2011
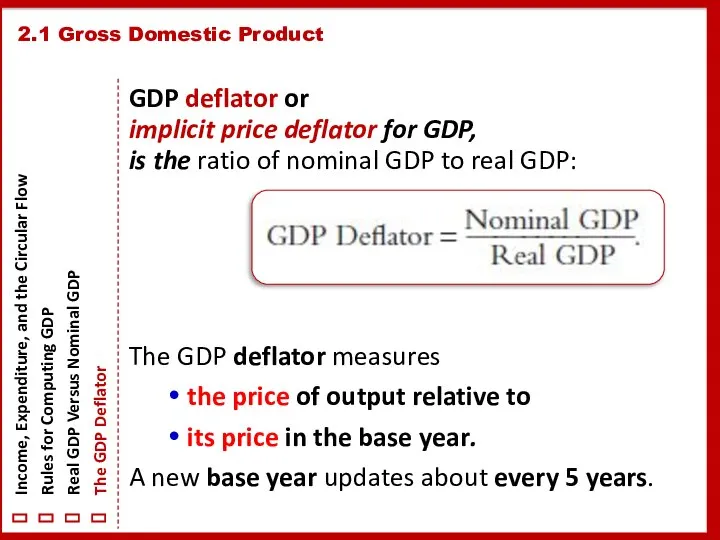
GDP deflator or
implicit price deflator for GDP,
is the ratio
GDP deflator or
implicit price deflator for GDP,
is the ratio

Chain-weighted measures of real GDP, 1995
The base year changes continuously
Chain-weighted measures of real GDP, 1995
The base year changes continuously
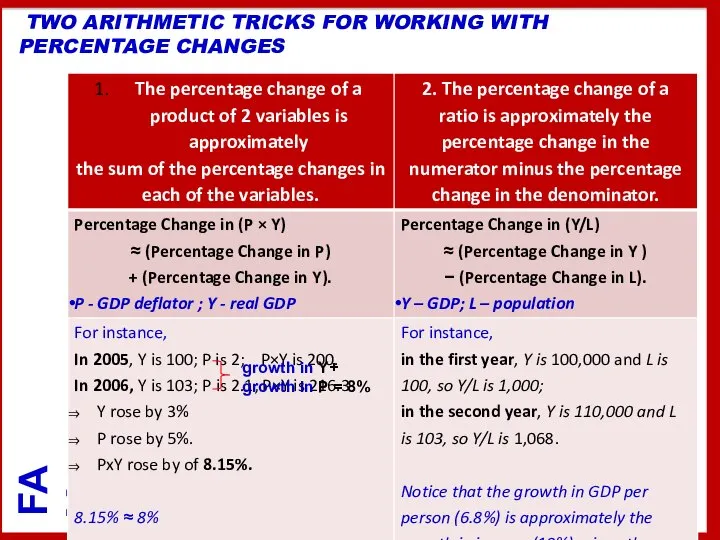
TWO ARITHMETIC TRICKS FOR WORKING WITH PERCENTAGE CHANGES
growth in
TWO ARITHMETIC TRICKS FOR WORKING WITH PERCENTAGE CHANGES
growth in

The national income accounts divide GDP into four broad categories
of spending:
2.1
The national income accounts divide GDP into four broad categories
of spending:
2.1
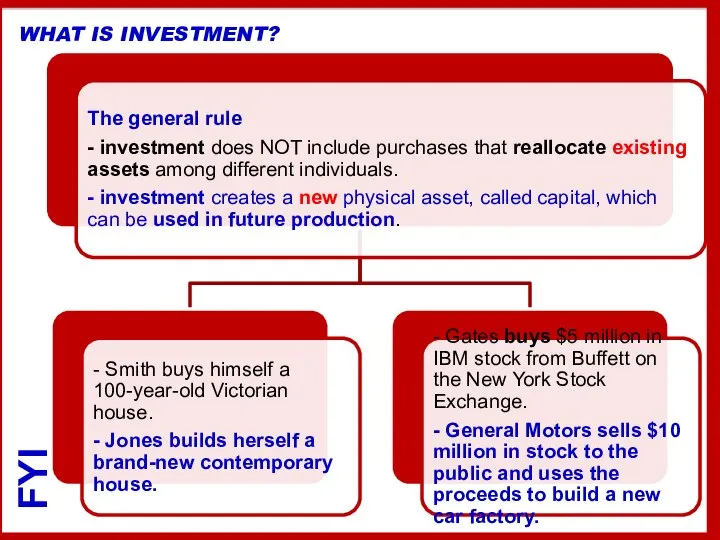
WHAT IS INVESTMENT?
WHAT IS INVESTMENT?
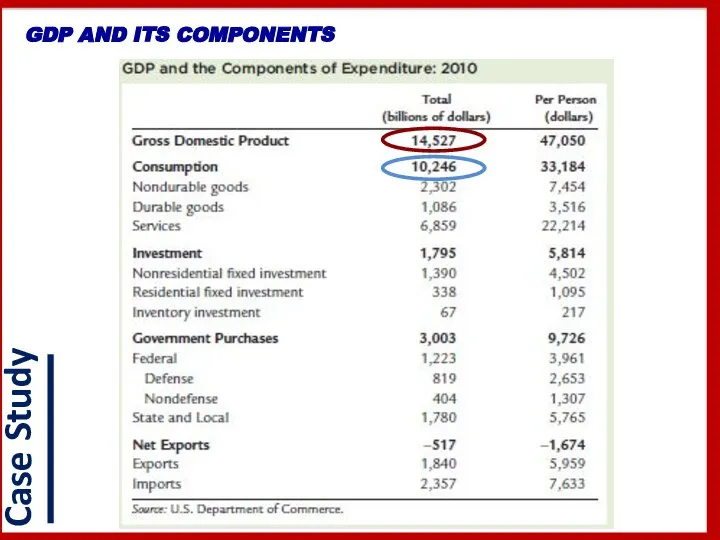
GDP AND ITS COMPONENTS
GDP AND ITS COMPONENTS

GNP
Gross national product = GDP
+ Factor Payments from Abroad
–
GNP
Gross national product = GDP
+ Factor Payments from Abroad
–

NI
national income ≈NNP
They two differ by a small correction called the
NI
national income ≈NNP
They two differ by a small correction called the
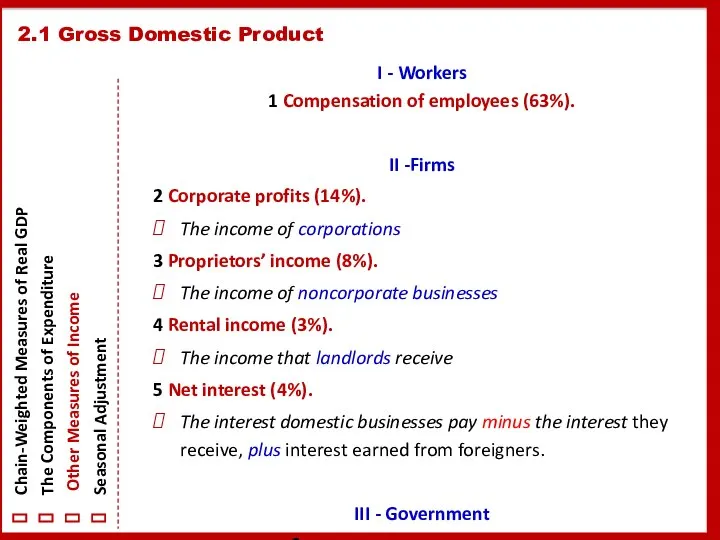
I - Workers
1 Compensation of employees (63%).
II -Firms
2 Corporate profits
I - Workers
1 Compensation of employees (63%).
II -Firms
2 Corporate profits
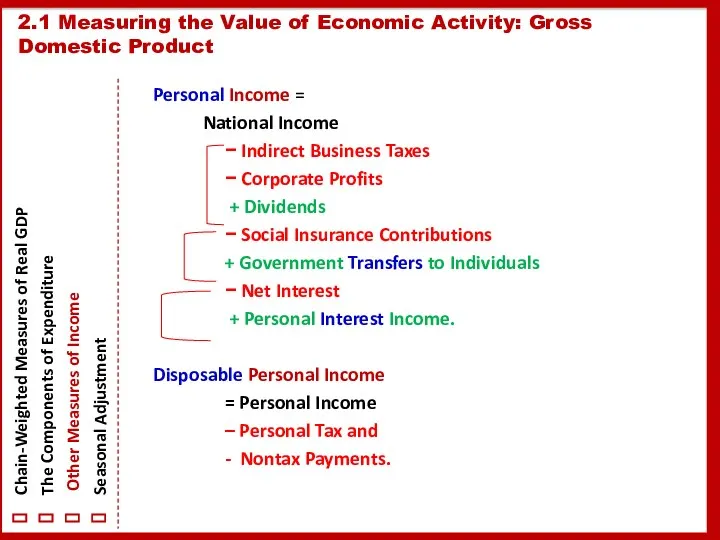
Personal Income =
National Income
− Indirect Business Taxes
− Corporate Profits
Personal Income =
National Income
− Indirect Business Taxes
− Corporate Profits
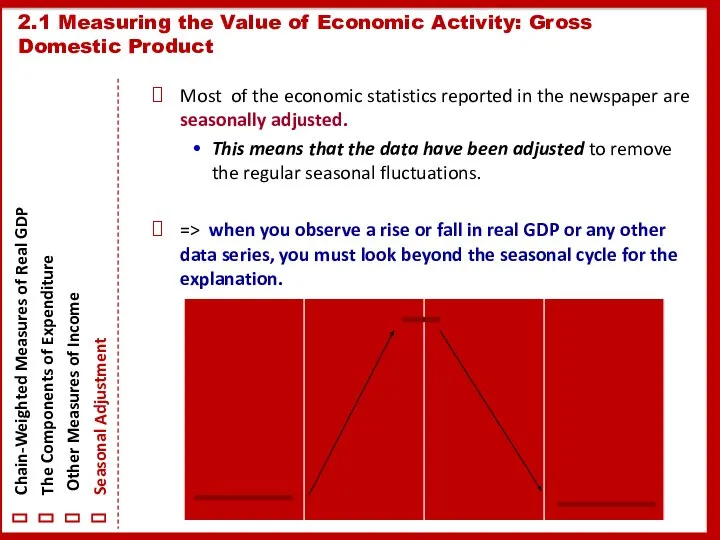
Most of the economic statistics reported in the newspaper are seasonally
Most of the economic statistics reported in the newspaper are seasonally
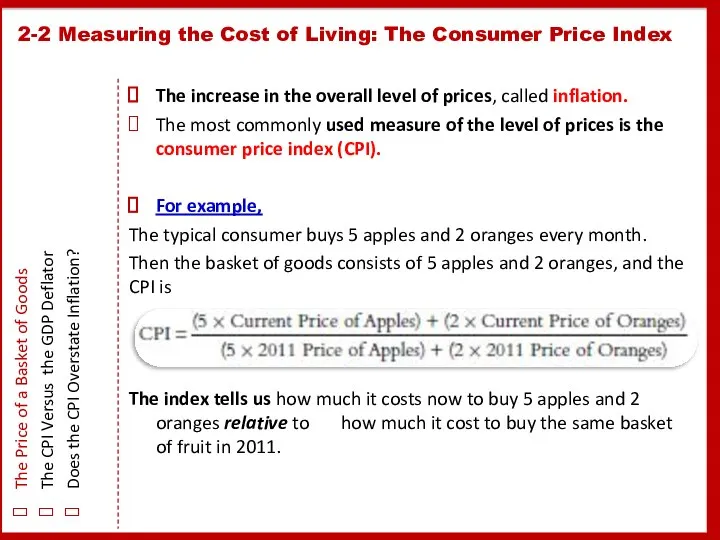
The increase in the overall level of prices, called inflation.
The most
The increase in the overall level of prices, called inflation.
The most

The PRODUCER price index,
a typical basket of goods bought by
The PRODUCER price index,
a typical basket of goods bought by
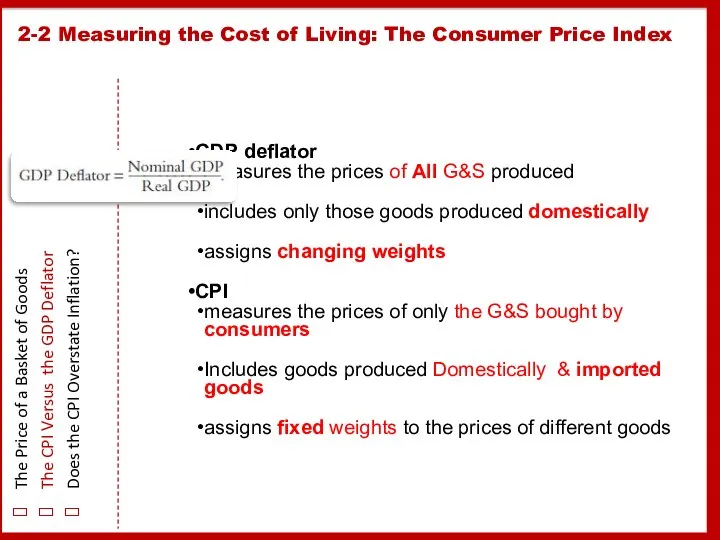
GDP deflator
measures the prices of All G&S produced
includes only those goods
GDP deflator
measures the prices of All G&S produced
includes only those goods
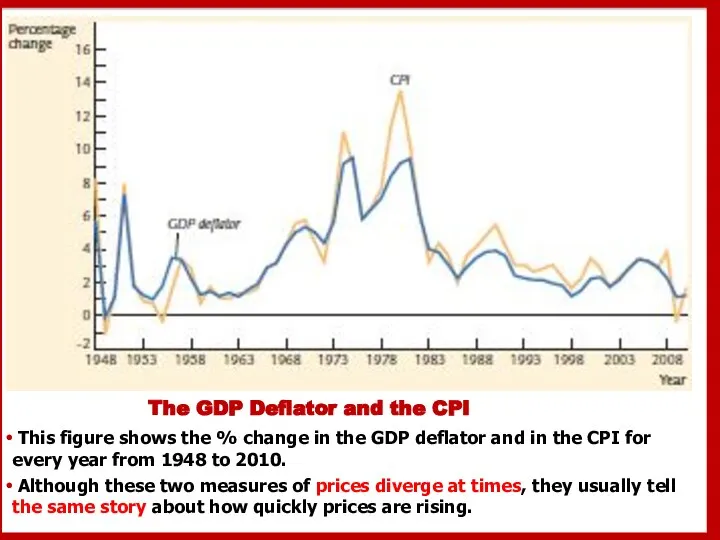
The GDP Deflator and the CPI
This figure shows the
The GDP Deflator and the CPI
This figure shows the
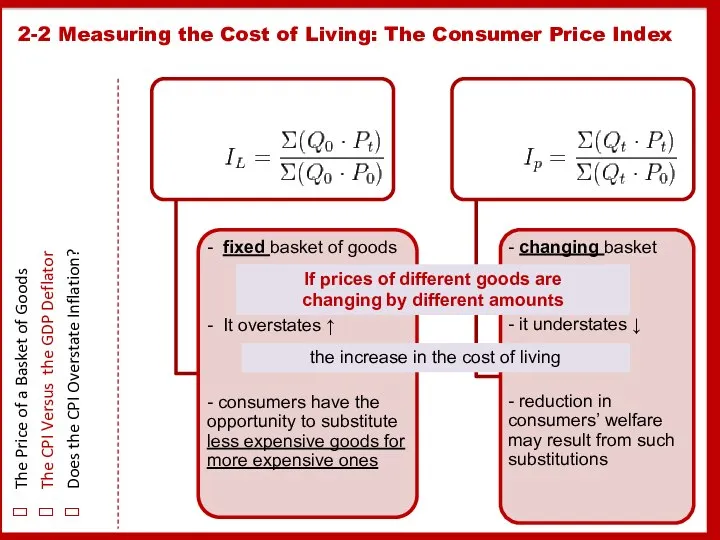
2-2 Measuring the Cost of Living: The Consumer Price Index
The Price
2-2 Measuring the Cost of Living: The Consumer Price Index
The Price
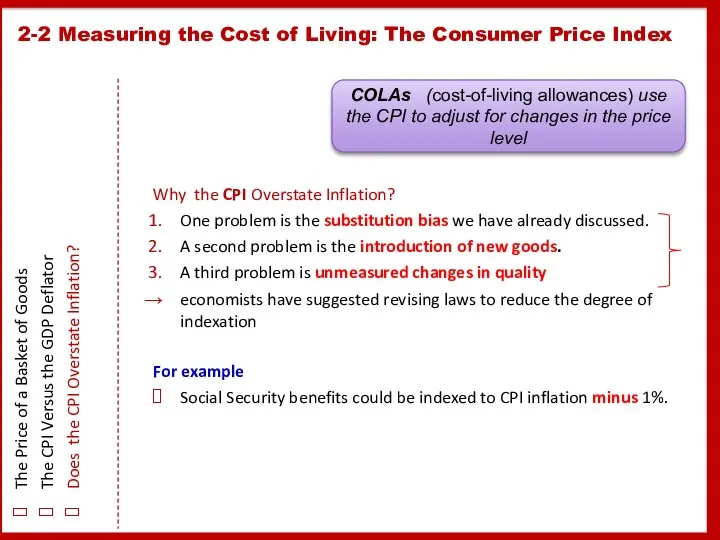
Why the CPI Overstate Inflation?
One problem is the substitution bias
Why the CPI Overstate Inflation?
One problem is the substitution bias
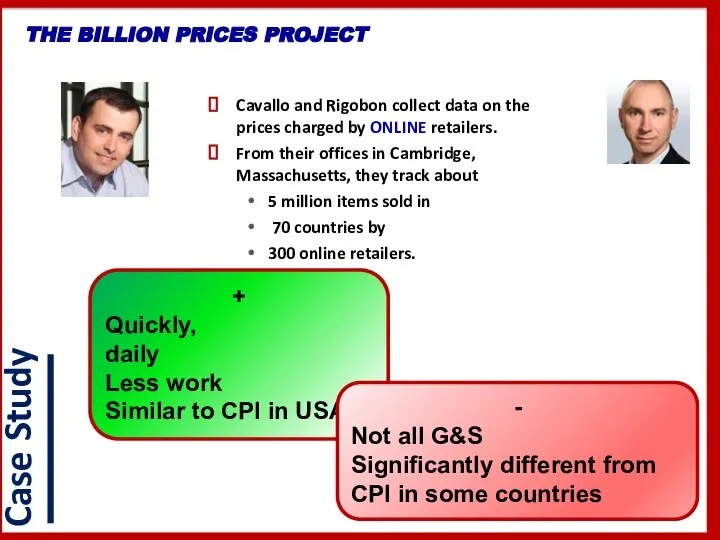
Cavallo and Rigobon collect data on the prices charged by ONLINE
Cavallo and Rigobon collect data on the prices charged by ONLINE
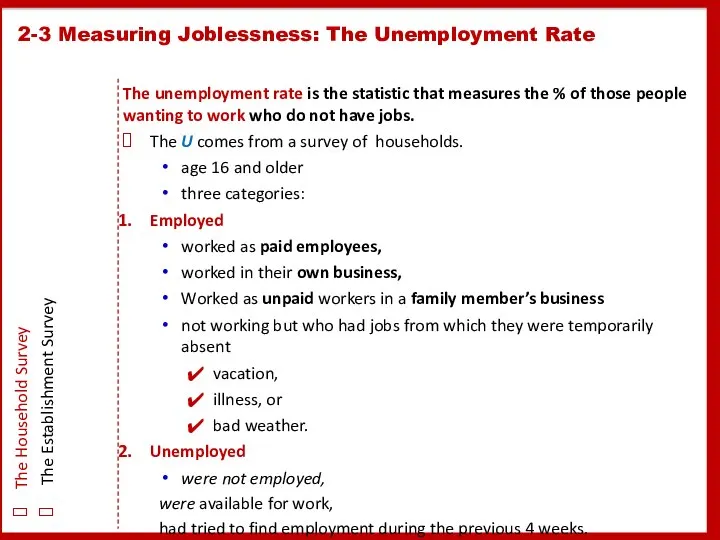
The unemployment rate is the statistic that measures the % of
The unemployment rate is the statistic that measures the % of
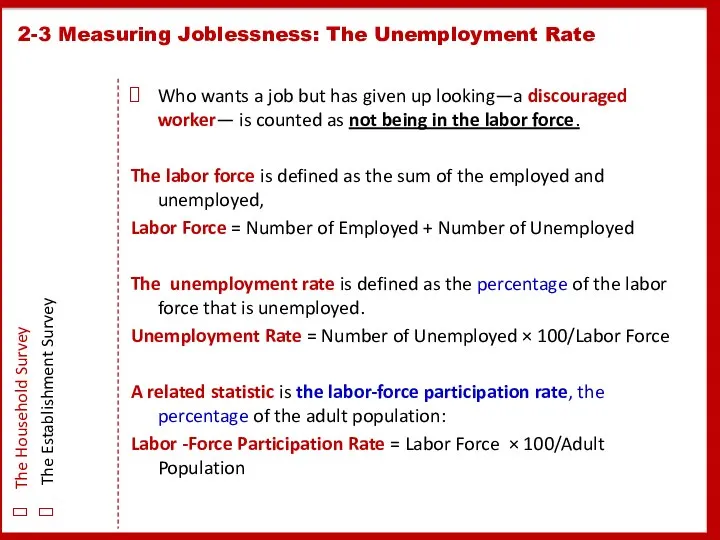
Who wants a job but has given up looking—a discouraged worker—
Who wants a job but has given up looking—a discouraged worker—

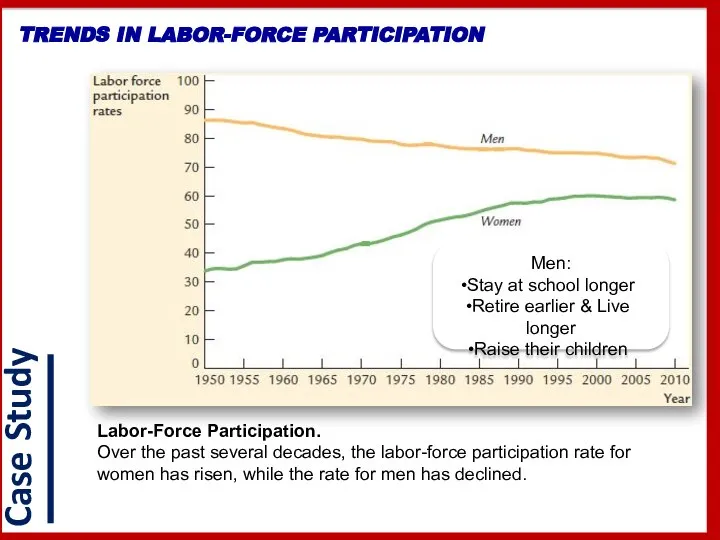
TRENDS IN LABOR-FORCE PARTICIPATION
Labor-Force Participation.
Over the past several decades, the labor-force
TRENDS IN LABOR-FORCE PARTICIPATION
Labor-Force Participation.
Over the past several decades, the labor-force

2-3 Measuring Joblessness: The Unemployment Rate
The Household Survey
The Establishment Survey
2-3 Measuring Joblessness: The Unemployment Rate
The Household Survey
The Establishment Survey
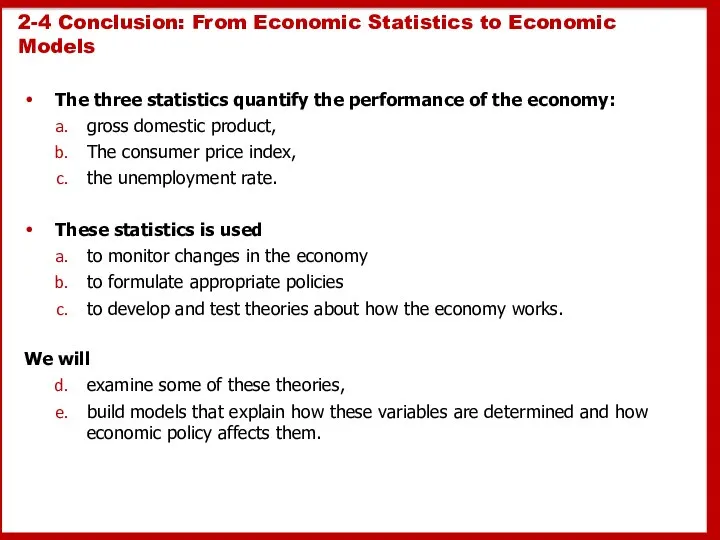
2-4 Conclusion: From Economic Statistics to Economic Models
The three statistics quantify
2-4 Conclusion: From Economic Statistics to Economic Models
The three statistics quantify
 Индивидуальная предпринимательская деятельность
 Глобальные проблемы человечества
 Основы общественного производства. Экономические системы
 Модели взаимодействия рынка и государства
 ИС в современной организации и их основные классы
 Определение автокорреляции
 CryptInvest. Saas решения для ICO
 Модернизация и постиндустриальное общество. Процессы модернизации Запада и Востока. (Лекция 12)
 Рост пенсионного возраста в России: причины и последствия для экономики страны
 Банкротство. Коэффициенты ликвидности, рентабельности. Финансовый рычаг
 Промышленность города Москвы
 Introduction to Japanese Business. History of Japanese Economic Development
 Роль управляющей организации в сфере ЖКХ на современном этапе
 Экономический рост, его типы
 Энергия. Энергосбережение
 Правовая охрана изобретений Федина Юля
 Квалиметрия. Квазиметрия
 Бережливое производство
 Глобальные проблемы человечества
 Экономический рост
 Экономическая система Российской Федерации и ее особенности
 Европейский Союз и Европейская экономическая интеграция
 Презентация Критерии истинности наших знаний
 Рациональность в поведенческой экономике. (Лекция 2)
 Федеральный закон от 28 июня 2014 г. N 172-ФЗ "О стратегическом планировании в Российской Федерации"
 Кредитная Карта 100 дней (1)
 Становление современной системы международных экономических отношений
 Основные фонды предприятия: показатели использования. Тема 3