- The Stock Market, the Theory of Rational Expectations, and the Efficient Markets Hypothesis

Содержание
- 2. © 2008 Pearson Education Canada 7. Ch 7: Stock Markets and Efficient Market Hypothesis. (*) Topics:
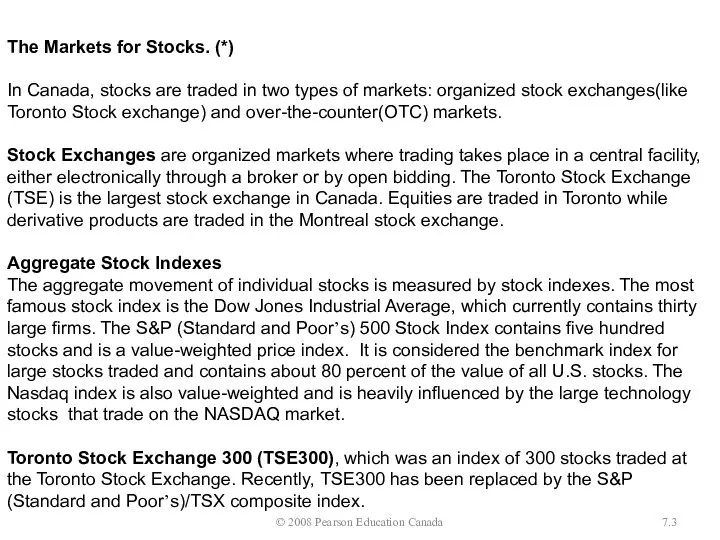
- 3. © 2008 Pearson Education Canada 7. The Markets for Stocks. (*) In Canada, stocks are traded
- 4. Common Stock Common stock is the principal way that corporations raise equity capital. Stockholders have the
- 5. Several Kinds of “Value” There are several types of value, of which we are concerned with
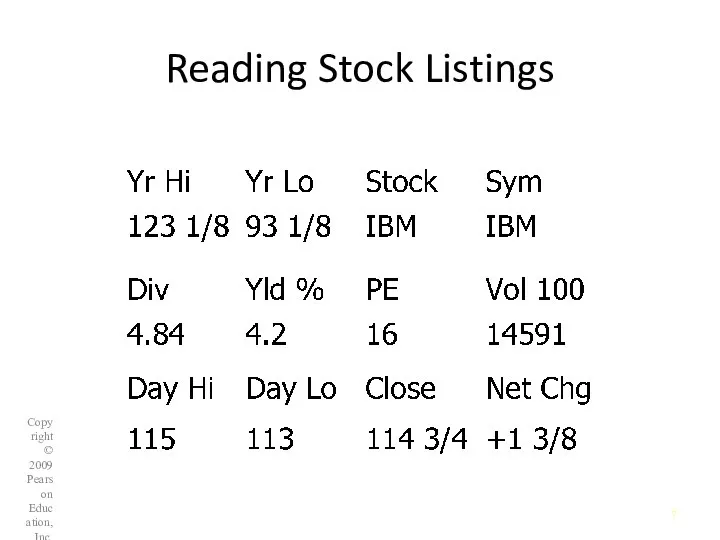
- 6. 9.1 Reading Stock Listings The following newspaper stock listing is usually printed as a horizontal string
- 7. Reading Stock Listings Copyright © 2009 Pearson Education, Inc. Publishing as Prentice Hall
- 8. Reading Stock Listings Hi = 123 1/8: The highest price the stock has traded at over
- 9. Reading Stock Listings Div = 4.84: The last quarterly dividend multiplied by 4 Yld % =
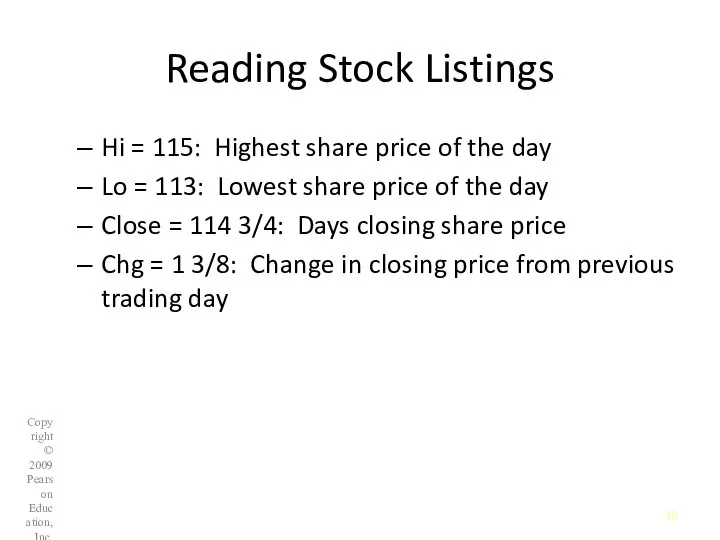
- 10. Reading Stock Listings Hi = 115: Highest share price of the day Lo = 113: Lowest
- 11. © 2008 Pearson Education Canada 7. The price of common stock. (*) Common stocks have two
- 12. Equation Total Return Copyright © 2007 Pearson Addison-Wesley. All rights reserved. 9-
- 13. Rate of Total Return Copyright © 2008 Pearson Education Canada 10-
- 14. One-Period Valuation Model © 2008 Pearson Education Canada 7.
- 15. Generalized Dividend Valuation Model © 2008 Pearson Education Canada 7.
- 16. Gordon Growth Model © 2008 Pearson Education Canada 7.
- 17. © 2008 Pearson Education Canada 7. According to the above model, current stock prices depend on
- 18. Example 9.1 Stock Prices and Returns Copyright © 2007 Pearson Addison-Wesley. All rights reserved. 9-
- 19. Example 9.1 Stock Prices and Returns Copyright © 2007 Pearson Addison-Wesley. All rights reserved. 9-
- 20. Example Valuing a Firm with Constant Dividend Growth Copyright © 2007 Pearson Addison-Wesley. All rights reserved.
- 21. Example 9.2 Valuing a Firm with Constant Dividend Growth Copyright © 2007 Pearson Addison-Wesley. All rights
- 22. Factors Affecting Stock Prices Business cycles Interest rate changes Investor sentiment about Economy, Earnings And markets
- 23. interest rate = risk free rate + risk premium, ke = rf + rp then
- 24. higher risk free rate, lower stock price higher risk premium, lower stock price higher dividends, higher
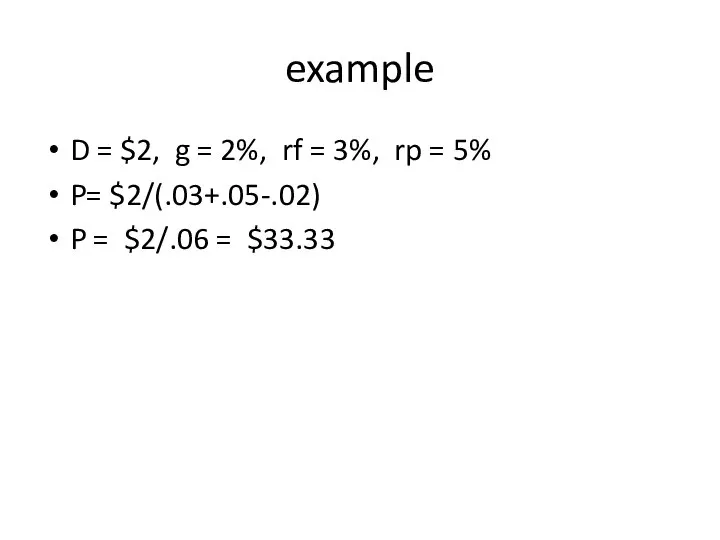
- 25. example D = $2, g = 2%, rf = 3%, rp = 5% P= $2/(.03+.05-.02) P
- 26. what if risk premium rises to 7%? P = $2/(.03+.07-.02) = $2/.08 = $12.50 what if
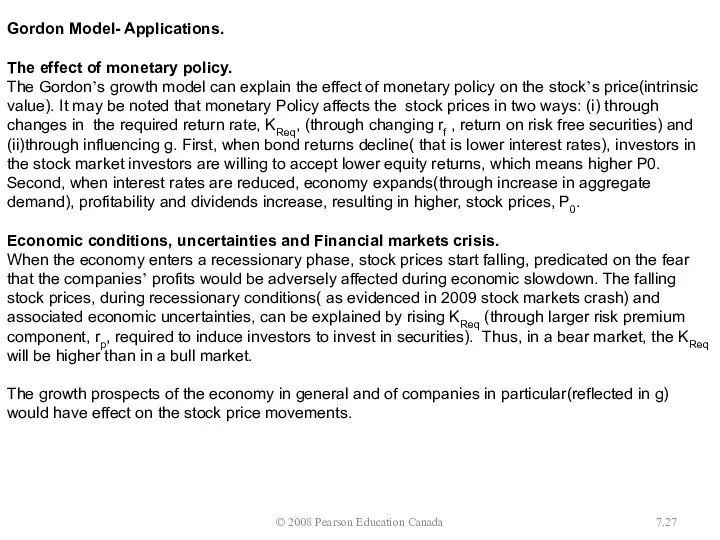
- 27. © 2008 Pearson Education Canada 7. Gordon Model- Applications. The effect of monetary policy. The Gordon’s
- 28. © 2008 Pearson Education Canada 7. Price-Earnings Ratio: The price/earnings ratio, which equals to the company’s
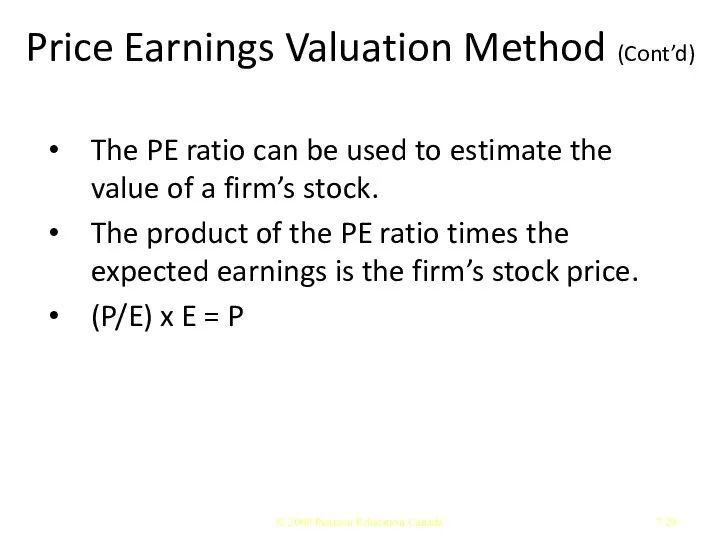
- 29. Price Earnings Valuation Method (Cont’d) The PE ratio can be used to estimate the value of
- 30. Stock Analysis Fundamental analysis Quantitative analysis Based on financial statements Qualitative analysis More subjective Examines management
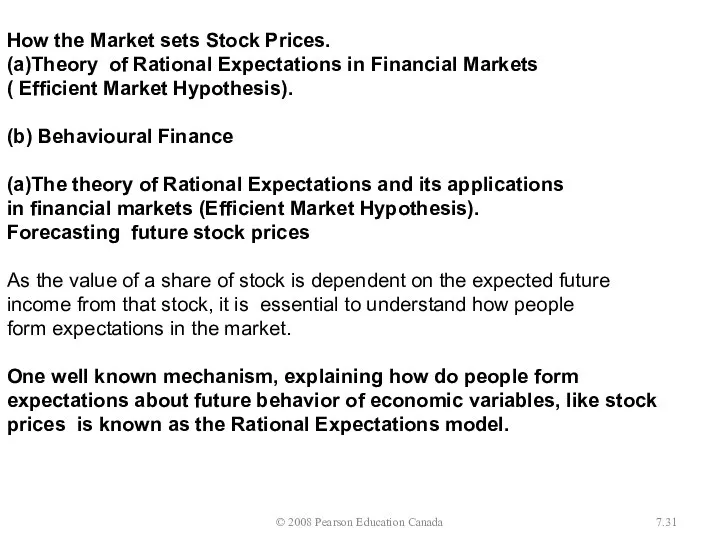
- 31. © 2008 Pearson Education Canada 7. How the Market sets Stock Prices. (a)Theory of Rational Expectations
- 32. © 2008 Pearson Education Canada 7. Rational Expectations Rational expectations theory views expectations as being identical
- 33. The Efficient Market The efficient-market hypothesis (EMH) asserts that financial markets are "informationally efficient", or that
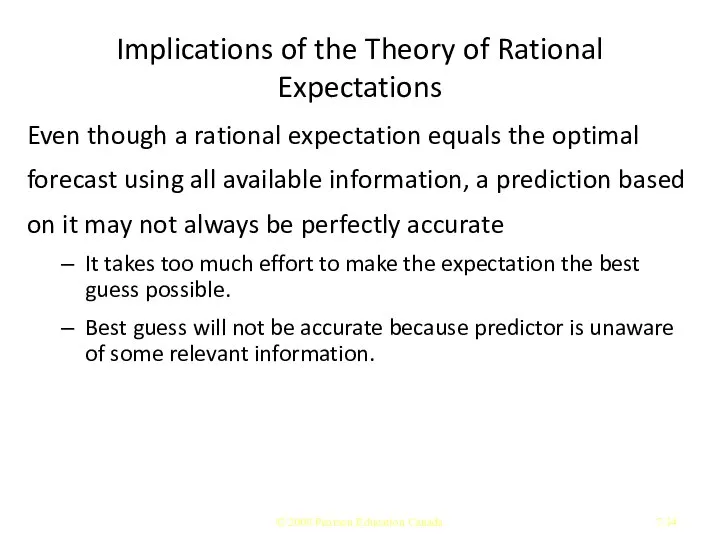
- 34. Implications of the Theory of Rational Expectations Even though a rational expectation equals the optimal forecast
- 35. Implications If there is a change in the way a variable moves, the way in which
- 36. Efficient Markets: An Application of Rational Expectations © 2008 Pearson Education Canada 7.
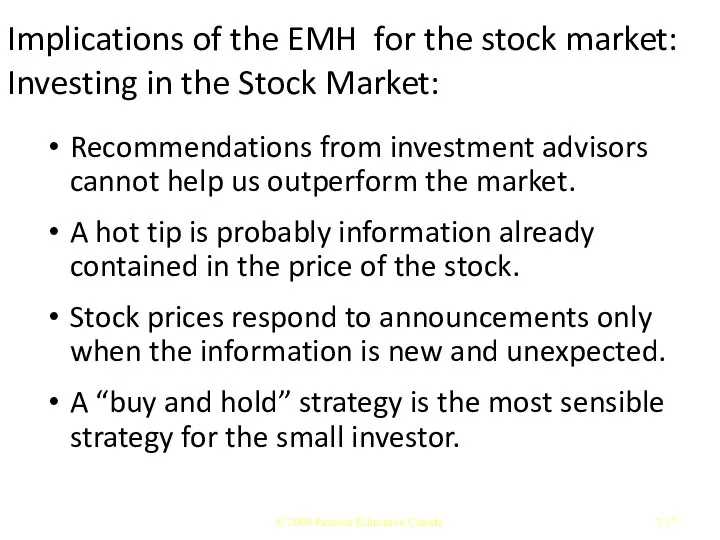
- 37. Implications of the EMH for the stock market: Investing in the Stock Market: Recommendations from investment
- 38. Evidence Against Market Efficiency Small-firm effect January Effect Market Overreaction Excessive Volatility Mean Reversion New information
- 39. (b)Behavioural Finance. The lack of short selling (causing over-priced stocks) may be explained by loss aversion.
- 40. (b) Behavioural Finance. Behavioral economists attribute the imperfections in financial markets to a combination of cognitive
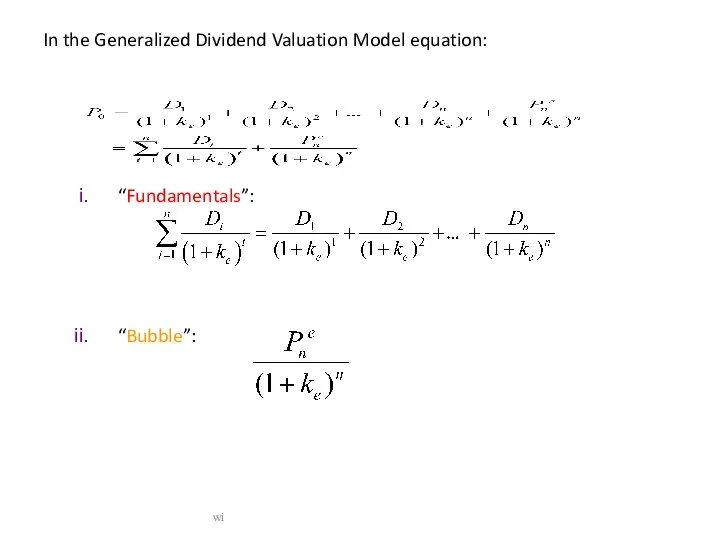
- 41. Bubbles Large gaps between actual asset price and fundamental value Internet stock bubble of late 1990s
- 42. In the Generalized Dividend Valuation Model equation: “Fundamentals”: “Bubble”: wi
- 43. Implications of efficiency evidence very difficult for average person to beat the market trying to do
- 45. Скачать презентацию

© 2008 Pearson Education Canada
7.
Ch 7: Stock Markets and Efficient Market
7.
Ch 7: Stock Markets and Efficient Market
© 2008 Pearson Education Canada
7.
The Markets for Stocks. (*)
In Canada, stocks
7.
The Markets for Stocks. (*)
In Canada, stocks

Common Stock
Common stock is the principal way that corporations raise equity
Common Stock
Common stock is the principal way that corporations raise equity

Several Kinds of “Value”
There are several types of value, of which
Several Kinds of “Value”
There are several types of value, of which

9.1 Reading Stock Listings
The following newspaper stock listing is usually printed
9.1 Reading Stock Listings
The following newspaper stock listing is usually printed
Reading Stock Listings
Copyright © 2009 Pearson Education, Inc. Publishing as Prentice
Reading Stock Listings
Copyright © 2009 Pearson Education, Inc. Publishing as Prentice

Reading Stock Listings
Hi = 123 1/8: The highest price the stock
Reading Stock Listings
Hi = 123 1/8: The highest price the stock

Reading Stock Listings
Div = 4.84: The last quarterly dividend multiplied by
Reading Stock Listings
Div = 4.84: The last quarterly dividend multiplied by
Reading Stock Listings
Hi = 115: Highest share price of the day
Lo
Reading Stock Listings
Hi = 115: Highest share price of the day
Lo
© 2008 Pearson Education Canada
7.
The price of common stock. (*)
Common stocks
7.
The price of common stock. (*)
Common stocks
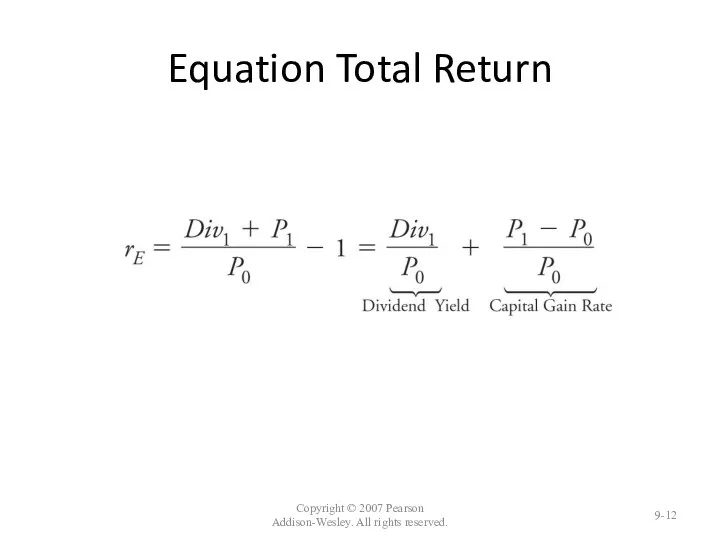
Equation Total Return
Copyright © 2007 Pearson Addison-Wesley. All rights reserved.
9-
Equation Total Return
Copyright © 2007 Pearson Addison-Wesley. All rights reserved.
9-
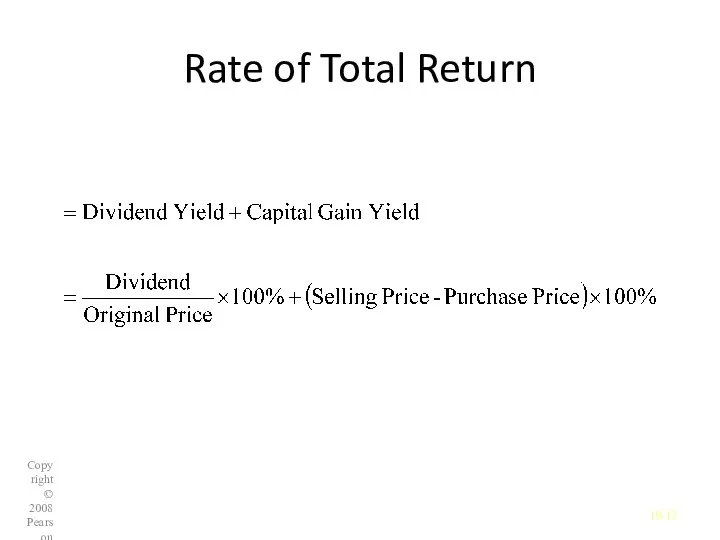
Rate of Total Return
Copyright © 2008 Pearson Education Canada
10-
Rate of Total Return
Copyright © 2008 Pearson Education Canada
10-

One-Period Valuation Model
© 2008 Pearson Education Canada
7.
One-Period Valuation Model
© 2008 Pearson Education Canada
7.

Generalized Dividend
Valuation Model
© 2008 Pearson Education Canada
7.
Generalized Dividend
Valuation Model
© 2008 Pearson Education Canada
7.

Gordon Growth Model
© 2008 Pearson Education Canada
7.
Gordon Growth Model
© 2008 Pearson Education Canada
7.

© 2008 Pearson Education Canada
7.
According to the above model, current stock
7.
According to the above model, current stock
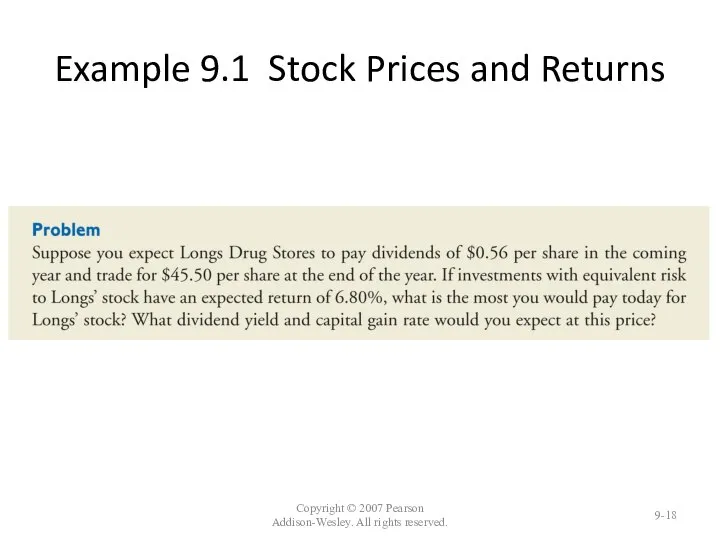
Example 9.1 Stock Prices and Returns
Copyright © 2007 Pearson Addison-Wesley. All
Example 9.1 Stock Prices and Returns
Copyright © 2007 Pearson Addison-Wesley. All

Example 9.1 Stock Prices and Returns
Copyright © 2007 Pearson Addison-Wesley. All
Example 9.1 Stock Prices and Returns
Copyright © 2007 Pearson Addison-Wesley. All

Example Valuing a Firm with Constant Dividend Growth
Copyright © 2007 Pearson
Example Valuing a Firm with Constant Dividend Growth
Copyright © 2007 Pearson
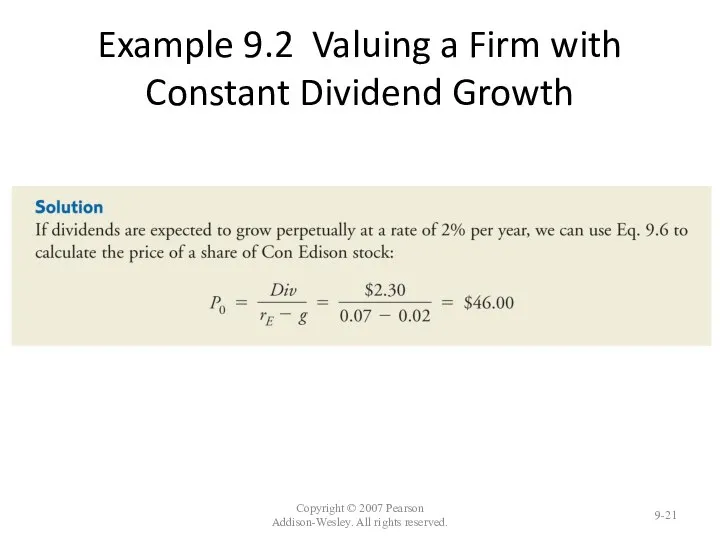
Example 9.2 Valuing a Firm with Constant Dividend Growth
Copyright © 2007
Example 9.2 Valuing a Firm with Constant Dividend Growth
Copyright © 2007

Factors Affecting Stock Prices
Business cycles
Interest rate changes
Investor sentiment about
Economy,
Earnings
And markets
Copyright ©
Factors Affecting Stock Prices
Business cycles
Interest rate changes
Investor sentiment about
Economy,
Earnings
And markets
Copyright ©

interest rate = risk free rate + risk premium, ke =
interest rate = risk free rate + risk premium, ke =
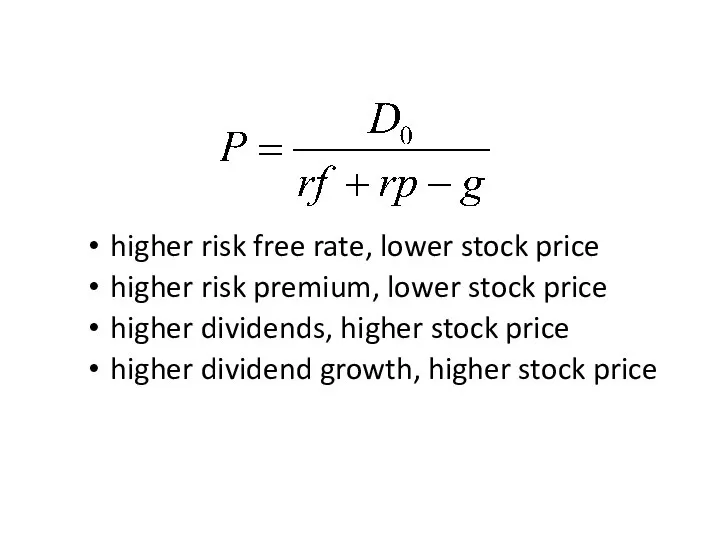
higher risk free rate, lower stock price
higher risk premium, lower stock
higher risk free rate, lower stock price
higher risk premium, lower stock
example
D = $2, g = 2%, rf = 3%, rp =
example
D = $2, g = 2%, rf = 3%, rp =

what if risk premium rises to 7%?
P = $2/(.03+.07-.02) = $2/.08
what if risk premium rises to 7%?
P = $2/(.03+.07-.02) = $2/.08
© 2008 Pearson Education Canada
7.
Gordon Model- Applications.
The effect of monetary policy.
The
7.
Gordon Model- Applications.
The effect of monetary policy.
The

© 2008 Pearson Education Canada
7.
Price-Earnings Ratio: The price/earnings ratio, which equals
7.
Price-Earnings Ratio: The price/earnings ratio, which equals
Price Earnings Valuation Method (Cont’d)
The PE ratio can be used to
Price Earnings Valuation Method (Cont’d)
The PE ratio can be used to

Stock Analysis
Fundamental analysis
Quantitative analysis
Based on financial statements
Qualitative analysis
More subjective
Examines management skill
Technical
Stock Analysis
Fundamental analysis
Quantitative analysis
Based on financial statements
Qualitative analysis
More subjective
Examines management skill
Technical
© 2008 Pearson Education Canada
7.
How the Market sets Stock Prices.
(a)Theory of
7.
How the Market sets Stock Prices.
(a)Theory of

© 2008 Pearson Education Canada
7.
Rational Expectations
Rational expectations theory views expectations as
7.
Rational Expectations
Rational expectations theory views expectations as

The Efficient Market
The efficient-market hypothesis (EMH) asserts that financial markets are
"informationally efficient", or that
The efficient-market hypothesis (EMH) asserts that financial markets are
"informationally efficient", or that
Implications of the Theory of Rational Expectations
Even though a rational expectation
Implications of the Theory of Rational Expectations
Even though a rational expectation

Implications
If there is a change in the way a variable moves,
Implications
If there is a change in the way a variable moves,

Efficient Markets: An Application of Rational Expectations
© 2008 Pearson Education
Efficient Markets: An Application of Rational Expectations
© 2008 Pearson Education
Implications of the EMH for the stock market: Investing in the
Implications of the EMH for the stock market: Investing in the

Evidence Against Market Efficiency
Small-firm effect
January Effect
Market Overreaction
Excessive Volatility
Mean Reversion
New information is
Evidence Against Market Efficiency
Small-firm effect
January Effect
Market Overreaction
Excessive Volatility
Mean Reversion
New information is

(b)Behavioural Finance.
The lack of short selling (causing
over-priced stocks) may be
(b)Behavioural Finance.
The lack of short selling (causing over-priced stocks) may be

(b) Behavioural Finance.
Behavioral economists attribute the imperfections in financial markets
to a
(b) Behavioural Finance.
Behavioral economists attribute the imperfections in financial markets
to a

Bubbles
Large gaps between actual asset price and fundamental value
Internet stock bubble
Bubbles
Large gaps between actual asset price and fundamental value
Internet stock bubble
In the Generalized Dividend Valuation Model equation:
“Fundamentals”:
“Bubble”:
wi
In the Generalized Dividend Valuation Model equation:
“Fundamentals”:
“Bubble”:
wi

Implications of efficiency evidence
very difficult for average person to beat the
Implications of efficiency evidence
very difficult for average person to beat the
 Ընդհանուր պատկերացումներ տնտեսության մասին
 Елдердің экономикалық көшбасшылары. Елдер түрлері: орталық, жартылай перифериялы, перифериялы. Географиялық орталықтар
 Актуальные вопросы туризма в России
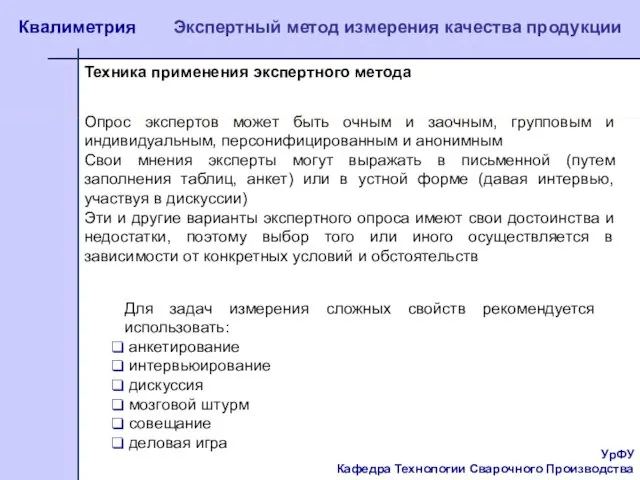 Квалиметрия. Техника применения экспертного метода измерения качества продукции
 Политические институты и экономические результаты
 Безработица. Типы и формы безработицы
 Экономикалық теорияның пәні және әдістері
 История становления предпринимательства в России
 Пятиэтапная модель Роберта Гранта. GAP-анализ
 Малиновский район міста Одеси. Слайды
 Содержание дисциплины Экономика и ее задачи
 Роль иностранного капитала в экономике России XIX-XX веков
 Мировое хозяйство и международная торговля
 Экономика - искусство ведения хозяйства
 Типы экономических систем
 Внешнеэкономическая деятельность Торгово-промышленной палаты Российской Федерации
 Основи аналізу попиту
 Customer behavior specifics in the access economy: comparison of Russian and Italian carsharing customers
 Презентация Таможенная политика в период складывания единого централизованного государства.
 Планирование производственных процессов и определение состава машинно-тракторного парка в ООО «Милославский ячмень»
 Еколого-економічне обґрунтування структури угідь та організації сівозмін фермерського господарства
 Поддорское сельское поселение. Проект поддержки местных инициатив
 Организационная структура отрасли «торговля»
 Рынки факторов производства Цель: изучить специфику факторных рынков
 ВТО
ВТО Процедура взаимодействия СК с поставщиками по сервису (Мониторинг KPI и производственный аудит)
 Нарықтық экономикалық жүйе және нарықтық механизм
 Анализ региона: Юго-Восточная Азия