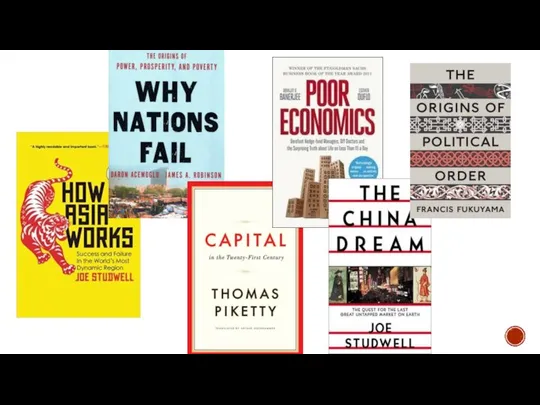
- World economics intro

Содержание
- 3. COURSE STRUCTURE
- 4. PROGNOSIS OF COUNTRIES DEVELOPMENT IN 1990S AND REALITY
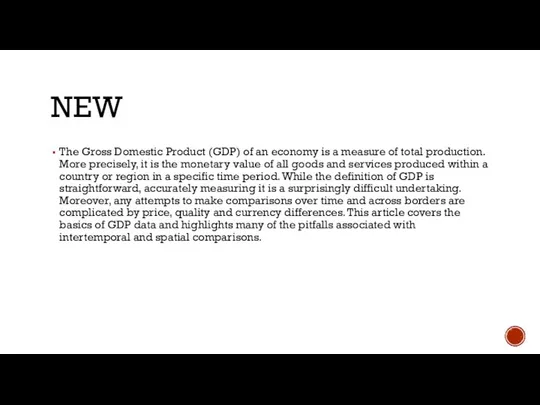
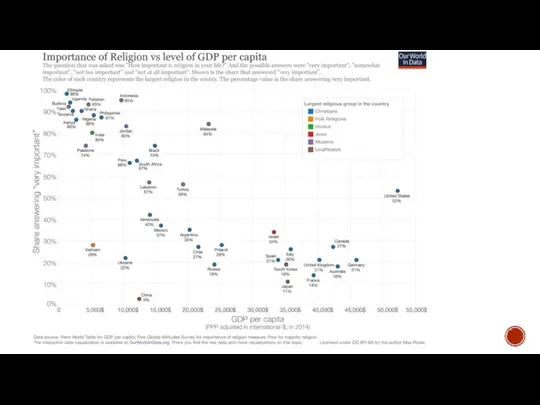
- 5. NEW The Gross Domestic Product (GDP) of an economy is a measure of total production. More
- 6. WORLD DEVELOPMENT IN DYNAMIC GDP, PPP (current international $) GDP growth (annual %)
- 7. GDP, GNP, GNI AND GDP PPP
- 8. TOP 100 COMPANIES BY COUNTRY – TRENDS 2009-2017
- 11. CHANGING WORLD The history of urbanization, 3700 BC – 2000 AD http://metrocosm.com/history-of-cities/
- 12. The economy of the United States is the largest in the world. At $18 trillion, it
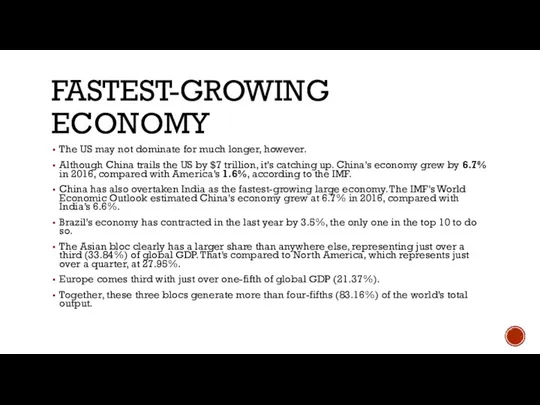
- 13. FASTEST-GROWING ECONOMY The US may not dominate for much longer, however. Although China trails the US
- 14. THE BIGGEST ECONOMIES IN 2050 A new study by PricewaterhouseCooper says that China will be in
- 15. THE WORLD IN 2050
- 16. RULE 72 The rule of 72 is a shortcut to estimate the number of years required
- 17. INCOME Incomes per person in poorest countries are $300-500, for developed – above $20,000 For transition
- 18. The most time has spent on growth from low level to middle (!) the stable growth
- 21. Скачать презентацию
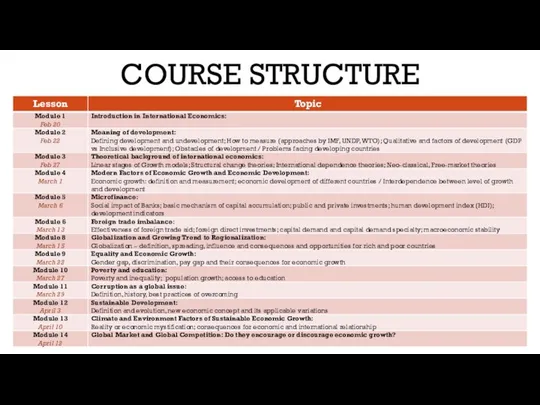
COURSE STRUCTURE
COURSE STRUCTURE
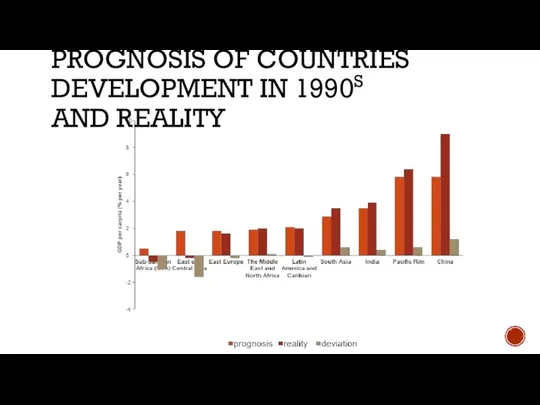
PROGNOSIS OF COUNTRIES DEVELOPMENT IN 1990S AND REALITY
PROGNOSIS OF COUNTRIES DEVELOPMENT IN 1990S AND REALITY
NEW
The Gross Domestic Product (GDP) of an economy is a
NEW
The Gross Domestic Product (GDP) of an economy is a
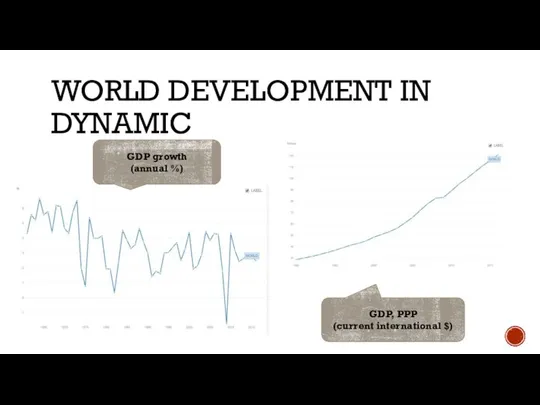
WORLD DEVELOPMENT IN DYNAMIC
GDP, PPP
(current international $)
GDP growth
(annual
WORLD DEVELOPMENT IN DYNAMIC
GDP, PPP
(current international $)
GDP growth
(annual
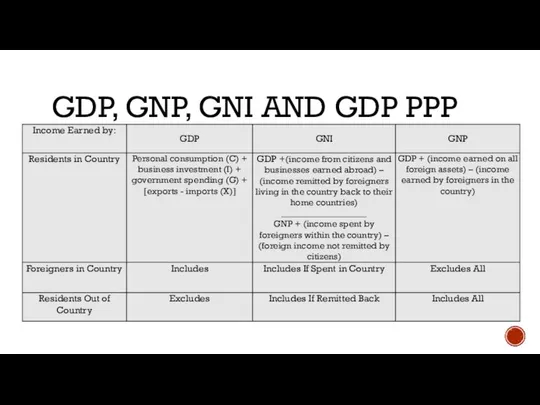
GDP, GNP, GNI AND GDP PPP
GDP, GNP, GNI AND GDP PPP
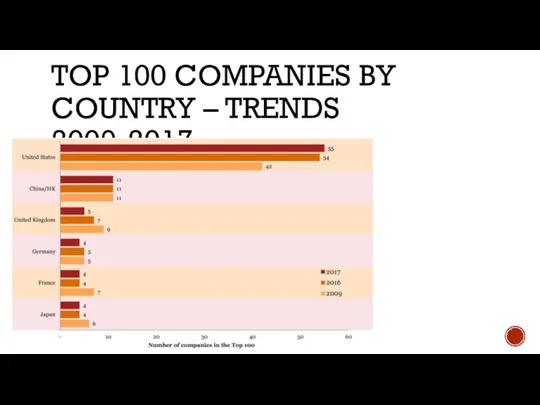
TOP 100 COMPANIES BY COUNTRY – TRENDS 2009-2017
TOP 100 COMPANIES BY COUNTRY – TRENDS 2009-2017
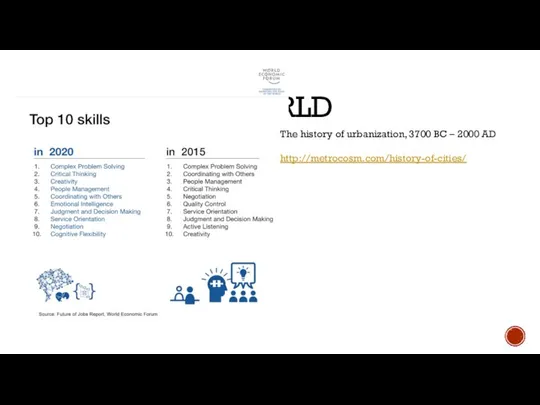
CHANGING WORLD
The history of urbanization, 3700 BC – 2000 AD
http://metrocosm.com/history-of-cities/
CHANGING WORLD
The history of urbanization, 3700 BC – 2000 AD
http://metrocosm.com/history-of-cities/
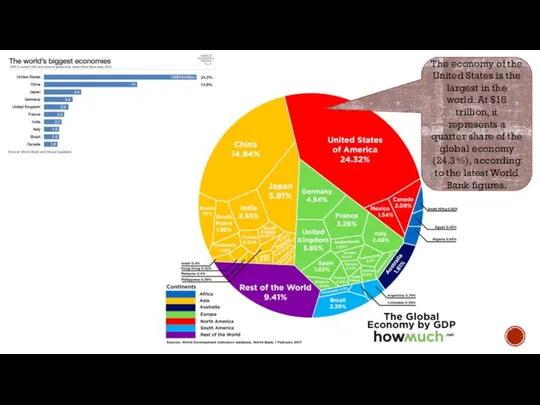
The economy of the United States is the largest in the
The economy of the United States is the largest in the
FASTEST-GROWING ECONOMY
The US may not dominate for much longer, however.
Although China
FASTEST-GROWING ECONOMY
The US may not dominate for much longer, however.
Although China
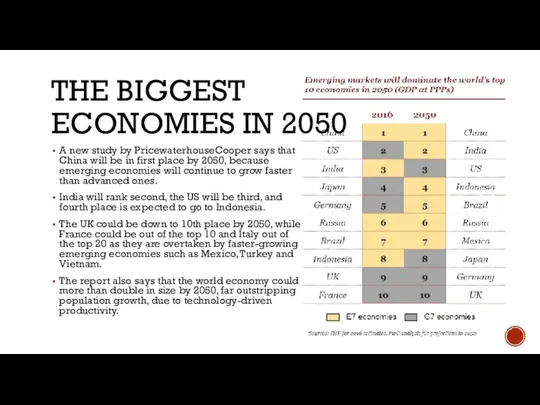
THE BIGGEST
ECONOMIES IN 2050
A new study by PricewaterhouseCooper says that
THE BIGGEST
ECONOMIES IN 2050
A new study by PricewaterhouseCooper says that
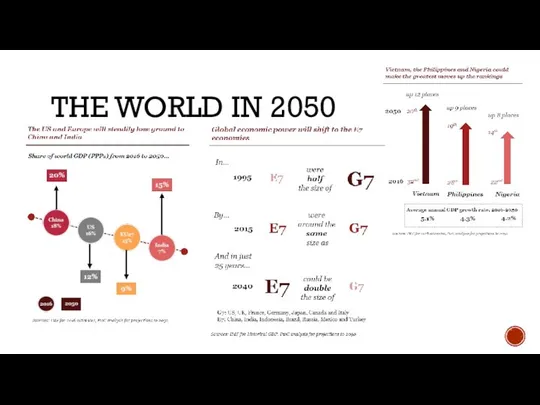
THE WORLD IN 2050
THE WORLD IN 2050
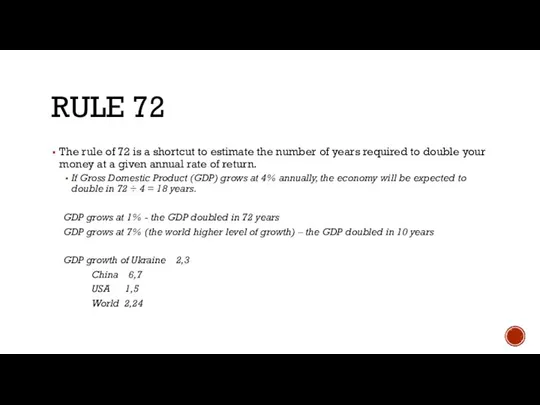
RULE 72
The rule of 72 is a shortcut to estimate the
RULE 72
The rule of 72 is a shortcut to estimate the
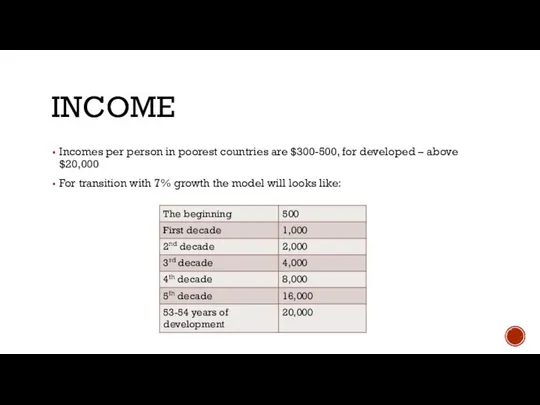
INCOME
Incomes per person in poorest countries are $300-500, for developed –
INCOME
Incomes per person in poorest countries are $300-500, for developed –
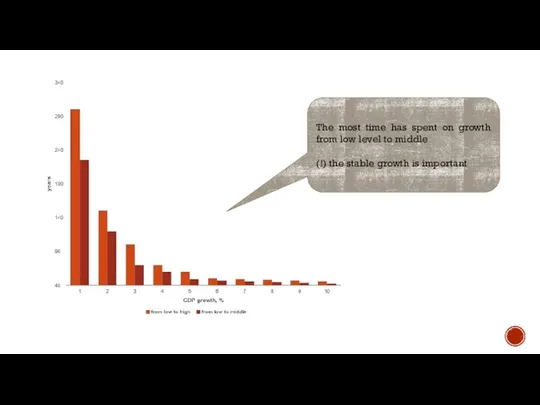
The most time has spent on growth from low level to
The most time has spent on growth from low level to
 Монополия как рыночная структура
 Макроэкономическая нестабильность: безработица
 Достоинства и недостатки рынка совершенной конкуренции
 Управление затратами предприятия (на примере ООО «РЕГИОН-СТРОЙ»)
 Буржуазная демократия как форма диктатуры буржуазии
 Демографическая ситуация в России
 Экономические циклы. Критерии экономического роста
 Задача управления товарными запасами (на примере ООО «Форсаж»)
 Статистика производства продуктов и услуг
 Флагман. Корпоративная информационная система для управления средними и крупными предприятиями. Общий взгляд
 Протекционизм в международной торговле
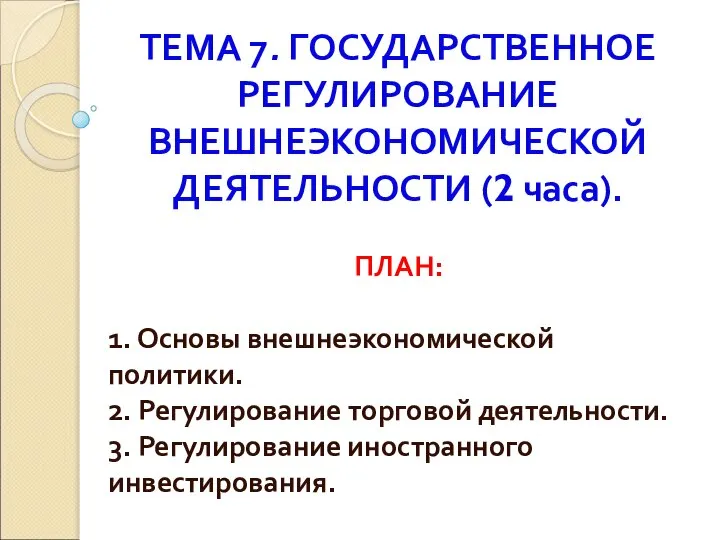 Государственное регулирование внешнеэкономической деятельности. Тема 7
 Федеральный закон от 28 июня 2014 г. N 172-ФЗ "О стратегическом планировании в Российской Федерации"
 Narzędzia ekonomiczne
 Финансирование инвестиционного проекта. Лекция 6. Инвестиционный анализ
 Статистика и анализ безработицы в РФ
 Американдық қанағаттану индексі CSI
 Теория сравнительного преимущества Давида Рикардо
 Международная валютная система и российский рубль
 Введение в управленческую экономику
 Планирование в системе социально-экономического мониторинга
 Проектування регіонального індустріального кластера
 Налоговая система и ее функции
 Формирование и развитие объектов инфраструктуры муниципального образования на примере городского поселения Видное
 Swot-анализ рыночной экономики
 Види ринків
 Экономический рост и развитие
 Ученые степени и ученые звания в истории отечественной науки и высшего образования Выполнила студентка 2 курса ЭФ группы Э121Б Б