- Logistic regression

Содержание
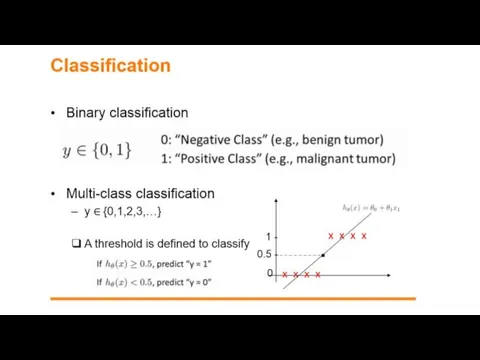
- 2. Logistic Regression is a statistical method of classification of objects. In this tutorial, we will focus
- 3. A doctor classifies the tumor as malignant or benign. A bank transaction may be fraudulent or
- 4. Logistic Regression is just one part of machine learning used for solving this kind of binary
- 5. There are other classification problems in which the output may be classified into more than two
- 9. The sigmoid function also known as the logistic function is going to be the key to
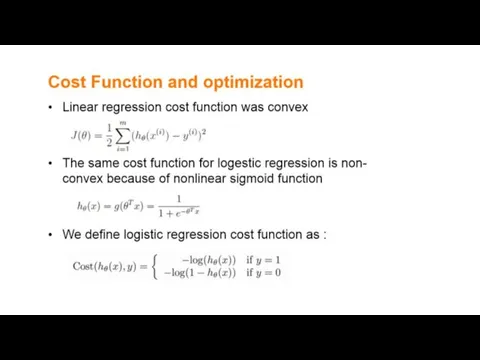
- 10. We can take our linear regression solution and place it into the sigmoid function and it
- 11. We can set a cutoff point at 0.5and we can say anything below 0.5 results in
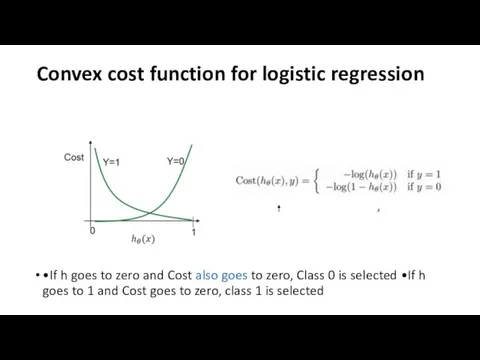
- 13. Convex cost function for logistic regression •If h goes to zero and Cost also goes to
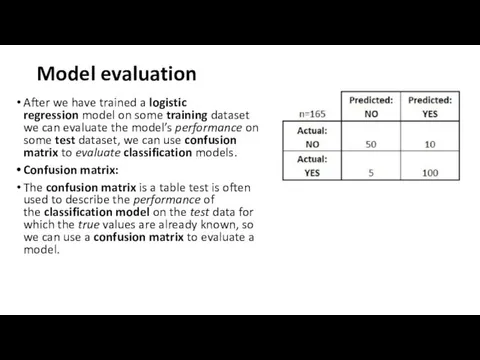
- 14. Model evaluation After we have trained a logistic regression model on some training dataset we can
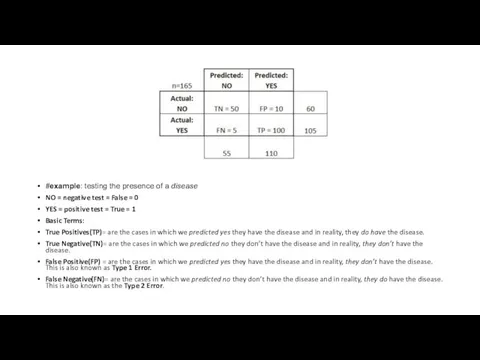
- 15. #example: testing the presence of a disease NO = negative test = False = 0 YES
- 16. Misclassification Rate: how often is it wrong? MR = (FP+FN)/total MR = (10+5)/165 = 0.09 This
- 18. Multi-class classification One-vs-all strategy: working with multiple binary classifications We train one logistic regression classifier for
- 20. How to deal with overfitting Seems having higher order of polynomials is good fit, but how
- 21. Advantages: it doesn’t require high computational power is easily interpretable is used widely by the data
- 22. Disadvantages: while working with Logistic regression you are not able to handle a large number of
- 23. https://www.youtube.com/watch?v=yIYKR4sgzI8
- 25. Скачать презентацию
Logistic Regression is a statistical method of classification of objects.
In this
Logistic Regression is a statistical method of classification of objects.
In this
A doctor classifies the tumor as malignant or benign.
A bank
A doctor classifies the tumor as malignant or benign.
A bank
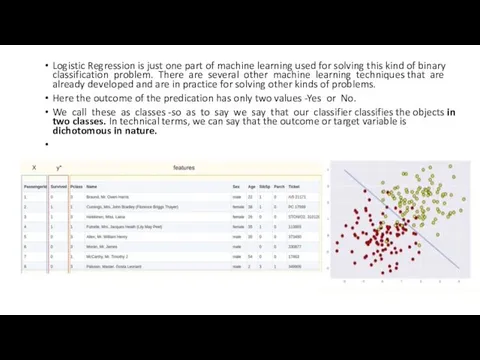
Logistic Regression is just one part of machine learning used for
Logistic Regression is just one part of machine learning used for
There are other classification problems in which the output may be
There are other classification problems in which the output may be


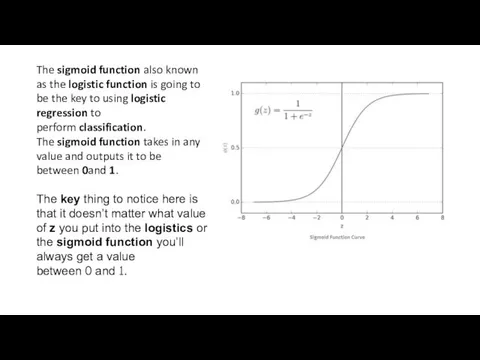
The sigmoid function also known as the logistic function is going to be the key
The sigmoid function also known as the logistic function is going to be the key
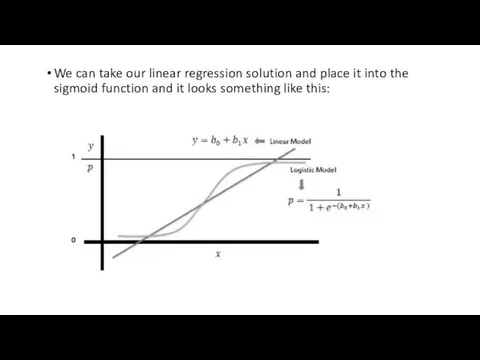
We can take our linear regression solution and place it into
We can take our linear regression solution and place it into
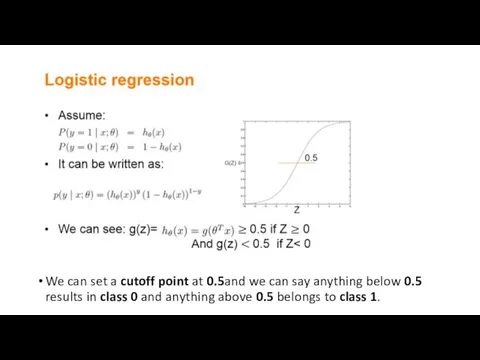
We can set a cutoff point at 0.5and we can say anything below 0.5 results
We can set a cutoff point at 0.5and we can say anything below 0.5 results
Convex cost function for logistic regression
•If h goes to zero and
Convex cost function for logistic regression
•If h goes to zero and
Model evaluation
After we have trained a logistic regression model on some training dataset we can
Model evaluation
After we have trained a logistic regression model on some training dataset we can
#example: testing the presence of a disease
NO = negative test = False =
#example: testing the presence of a disease
NO = negative test = False =
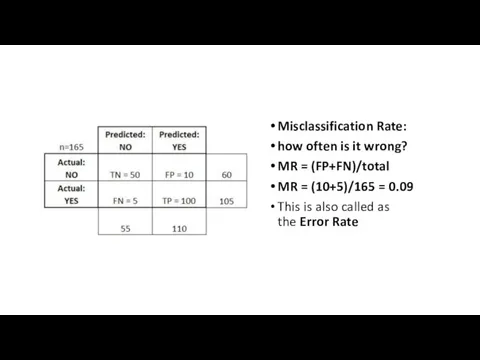
Misclassification Rate:
how often is it wrong?
MR = (FP+FN)/total
MR = (10+5)/165 =
Misclassification Rate:
how often is it wrong?
MR = (FP+FN)/total
MR = (10+5)/165 =

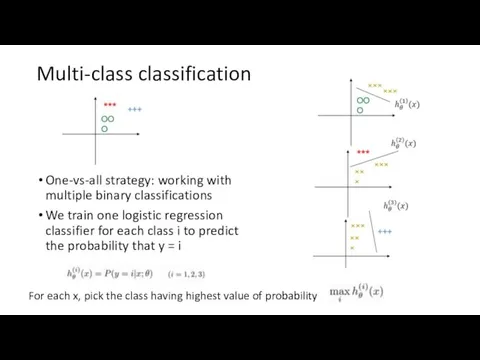
Multi-class classification
One-vs-all strategy: working with multiple binary classifications
We train one
Multi-class classification
One-vs-all strategy: working with multiple binary classifications
We train one
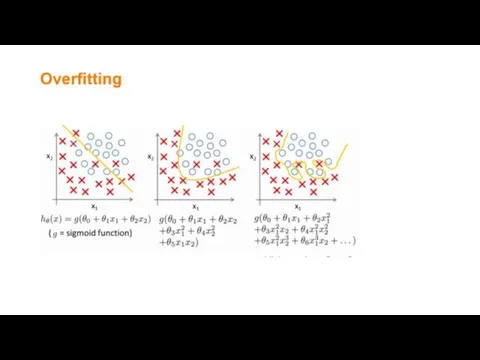
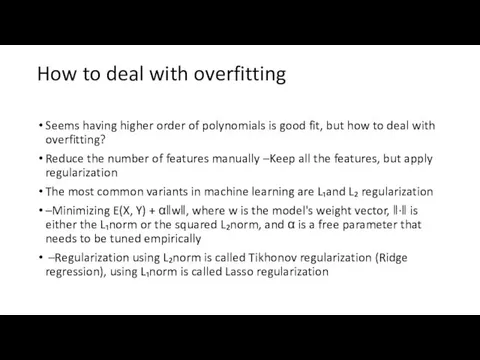
How to deal with overfitting
Seems having higher order of polynomials
How to deal with overfitting
Seems having higher order of polynomials
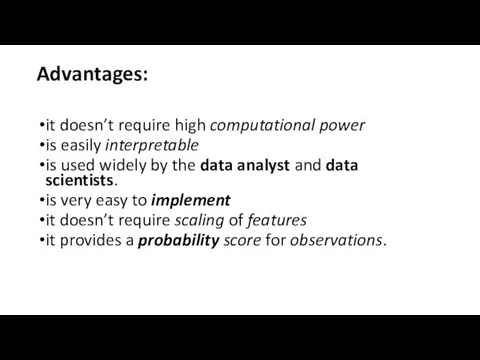
Advantages:
it doesn’t require high computational power
is easily interpretable
is used widely by the data analyst and data
Advantages:
it doesn’t require high computational power
is easily interpretable
is used widely by the data analyst and data
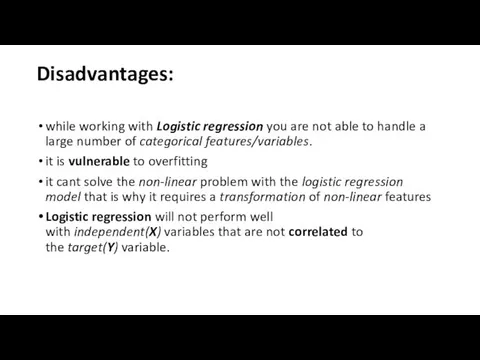
Disadvantages:
while working with Logistic regression you are not able to handle a large
Disadvantages:
while working with Logistic regression you are not able to handle a large

https://www.youtube.com/watch?v=yIYKR4sgzI8
https://www.youtube.com/watch?v=yIYKR4sgzI8
 Робота у системі електронного документообігу університету (далі - СЕД)
 Топологии компьютерных сетей
 Обновленные пакеты БИЗНЕС и ULTIMATE
 Иерархические и сетевые базы данных
 Розробка програмного забезпечення для обробки зображень шліфів напівкоштовних мінералів
 IT під час війни
 Prezentatsia_Romanets_Antona_1PKD_-_212 (1)
 Программирование детализации и подвидов учета в системе
 Новый механизм обеспечения инвалидов средствами реабилитации
 Аттестационная работа. Методическая разработка исследовательского урока Знакомство с фотоаппаратом
 Разработка автоматизированной информационной системы для салона красоты
 Instagram в помощь формированию положительного имиджа библиотеки
 Графы. Поиск в ширину (bfs) кратчайшие пути в невзвешенном графе
 МОДЕЛИРОВАНИЕ В СРЕДЕ ГРАФИЧЕСКОГО РЕДАКТОРА PAINT
 Табличные модели. Информационное моделирование на компьютере
 Структура презентации
 Программирование на языке PL/SQL. Часть 1. Введение в Oracle PL/SQL
 Навыки облегчающие работу в Excel. Клавиша F4
 Роботу виконала Нечволода Тетяна учениця 11-Б класу Роботу виконала Нечволода Тетяна учениця 11-Б класу
 Генерация файлов формата *.docx в ситуационно-ориентированных базах данных
 Презентация "Локальные сети" - скачать презентации по Информатике
 Разработка информационного обеспечения для сопоставления текстовых документов
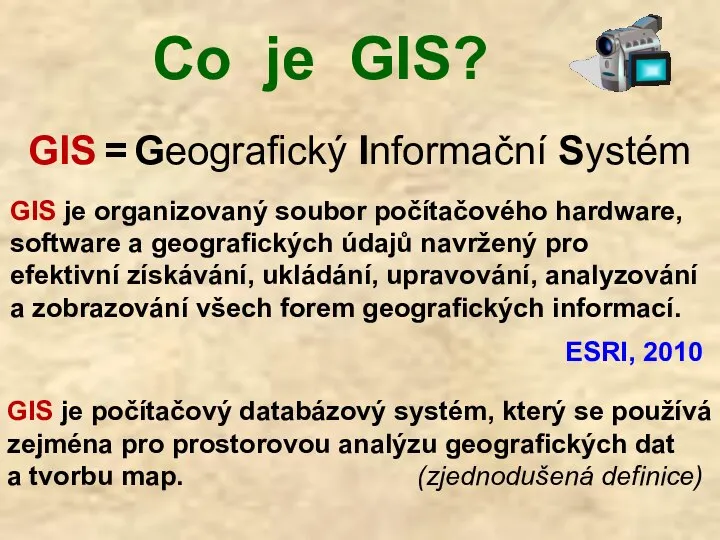 Co je GIS?
 Отношения между понятиями. Сравнение понятий
 Презентация "Основы HTML. Разработка Web-сайта" - скачать презентации по Информатике
 Безопасность в в сети Интернет
 ФУНКЦИИ и формулы в MS EXCEL
 Курсовое проектирование по ТРПО