- IE350 Alternative Energy Course

Содержание
- 2. Your homework -3 use a more appropriate number format, e.g. 1,000,000 = mln. Please provide the
- 3. 2008 Energy Use = 505 Quads
- 4. Oil and Gas Liquids
- 5. Oil drilling & refining is hazardous to workers, fire, explosion, etc. spills into the environment Transporting
- 6. Mostly used to for transportation, cars, trucks, aircraft, rail, etc. Also used to make petrochemicals, asphalt,
- 7. Coal
- 8. Coal mining is very dangerous fires and explosions black lung Transportation can be hazardous Burning coal
- 9. Mostly used to make electricity Abundant domestically & world-wide (US has the most) Abundance = affordable
- 10. Natural Gas
- 11. Gas drilling is hazardous to workers, fire, explosion, etc. pumping fluids reaching groundwater leaks from fractured
- 12. Gas drilling is hazardous to workers, fire, explosion, etc. pumping fluids reaching groundwater leaks from fractured
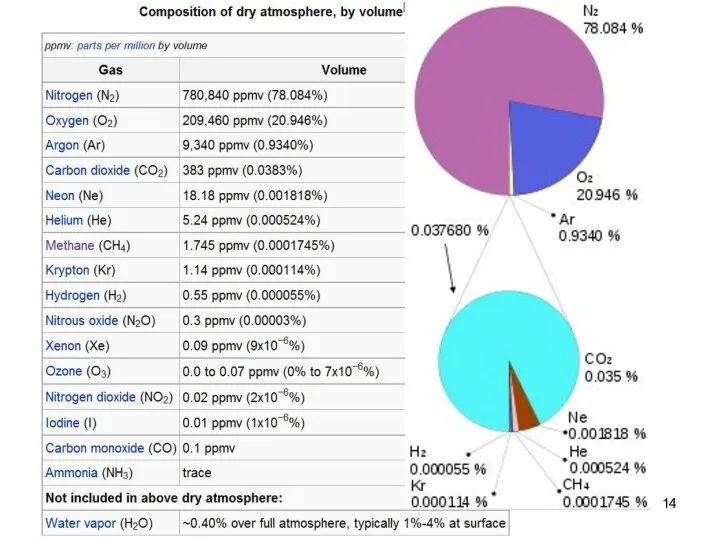
- 13. Earth atmosphere composition Lecture #3 - Energy Resources: Carbon Cycle
- 14. Lecture #3 - Energy Resources: Carbon Cycle
- 15. Global Warming Potential - GWP Lecture #3 - Energy Resources: Carbon Cycle Carbon dioxide has a
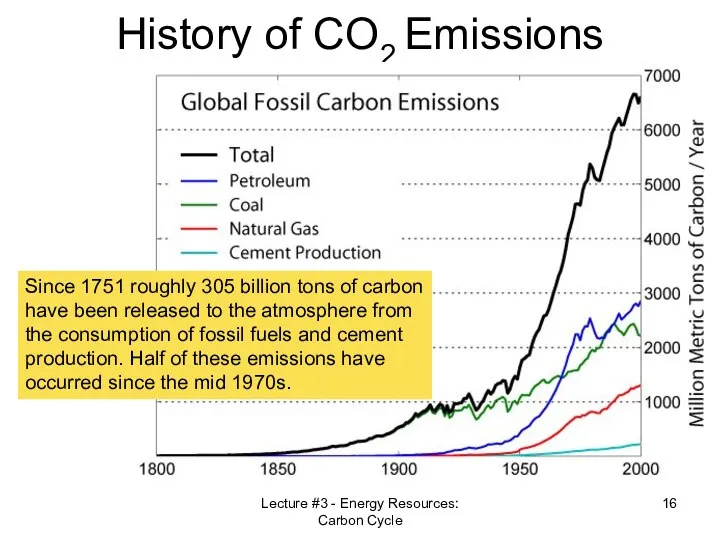
- 16. Lecture #3 - Energy Resources: Carbon Cycle History of CO2 Emissions Since 1751 roughly 305 billion
- 17. Lecture #3 - Energy Resources: Carbon Cycle
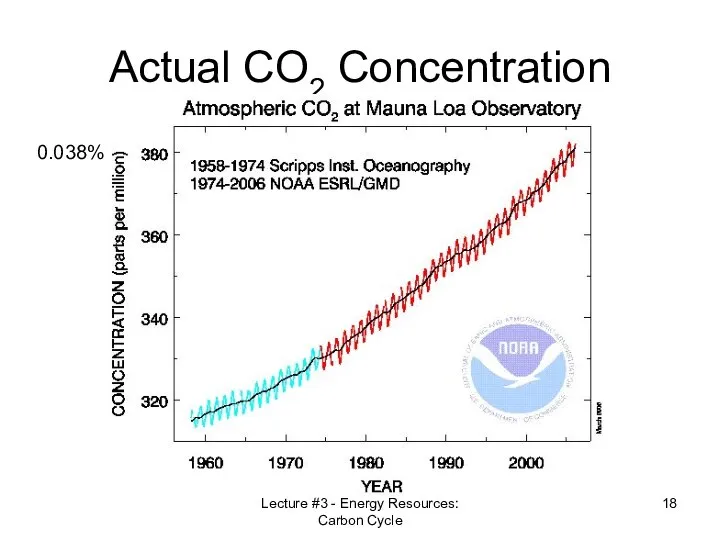
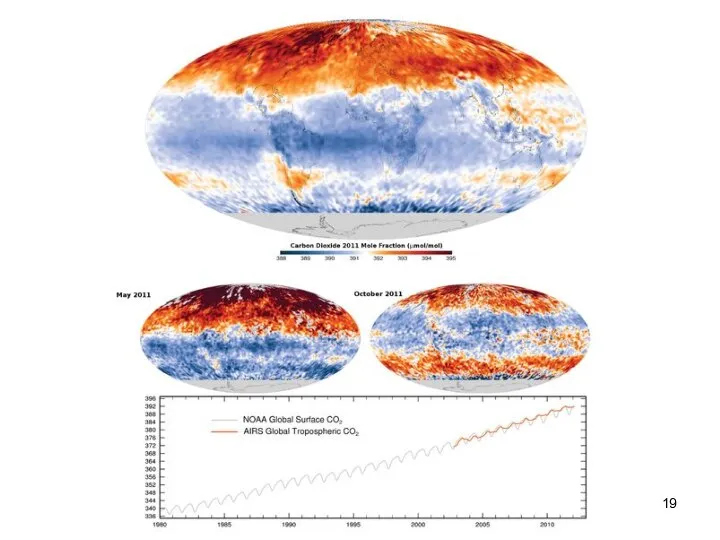
- 18. Lecture #3 - Energy Resources: Carbon Cycle Actual CO2 Concentration 0.038%
- 19. Lecture #3 - Energy Resources: Carbon Cycle
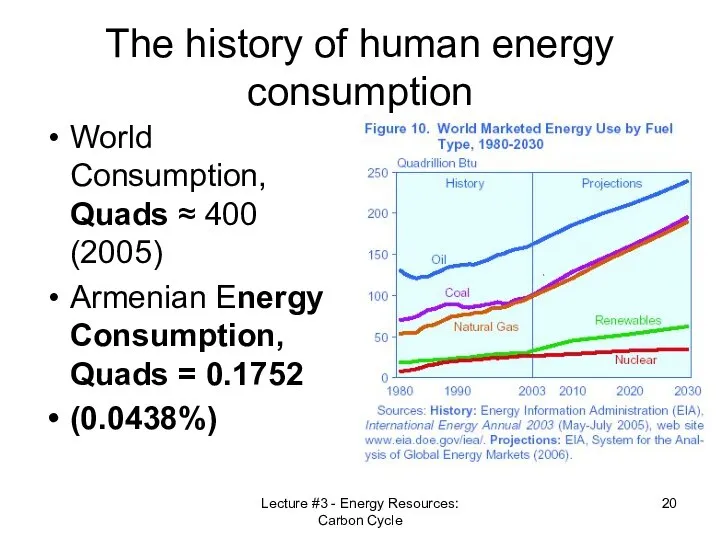
- 20. Lecture #3 - Energy Resources: Carbon Cycle The history of human energy consumption World Consumption, Quads
- 21. World energy consumption per capita Lecture #3 - Energy Resources: Carbon Cycle
- 22. Comparison In 2008 energy use per person was in the USA 4.1 fold, EU 1.9 fold
- 23. Primary energy Transport Generation T&D Industrial processes Industrial production Available energy A Look at the Electricity
- 24. World Energy-related CO2 emissions reduction Source: international Energy Agency www.worldenergy.com Giga ton CO2 1 2 3
- 25. Amount of electricity used to produce $1 of GDP A challenge for mature and emerging markets
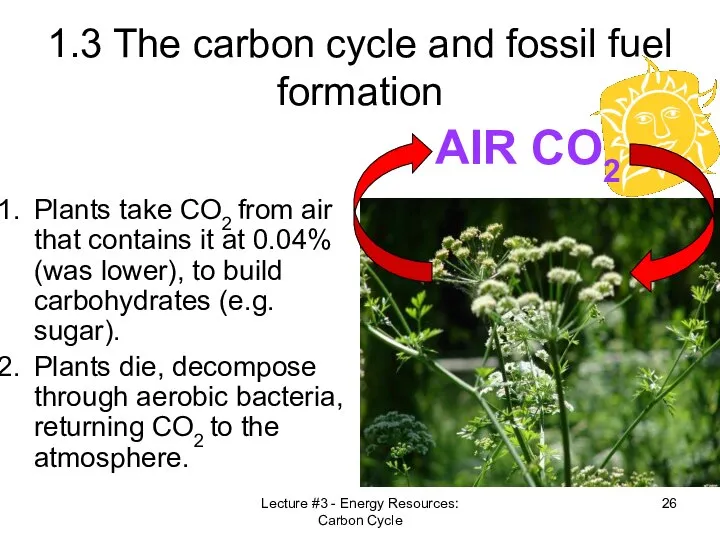
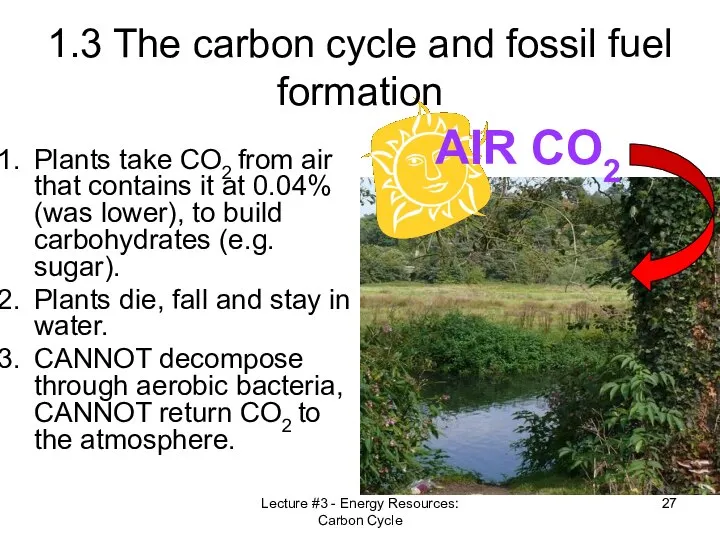
- 26. Lecture #3 - Energy Resources: Carbon Cycle 1.3 The carbon cycle and fossil fuel formation Plants
- 27. Lecture #3 - Energy Resources: Carbon Cycle 1.3 The carbon cycle and fossil fuel formation Plants
- 28. Lecture #3 - Energy Resources: Carbon Cycle Here geological times are involved
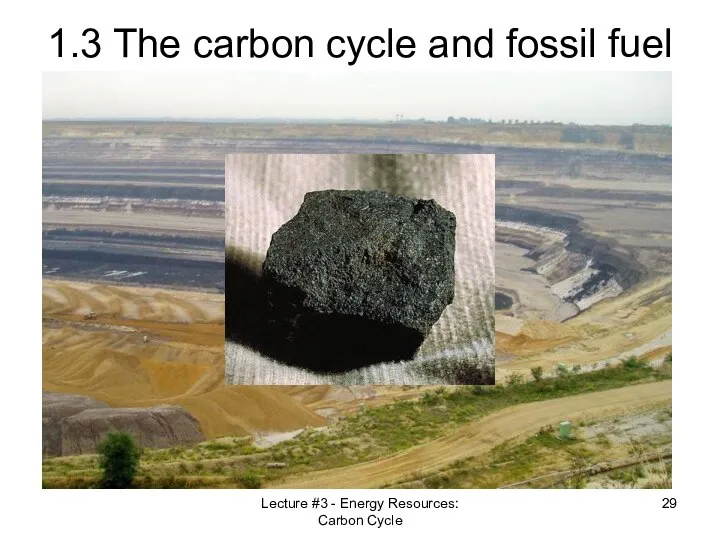
- 29. Lecture #3 - Energy Resources: Carbon Cycle 1.3 The carbon cycle and fossil fuel formation
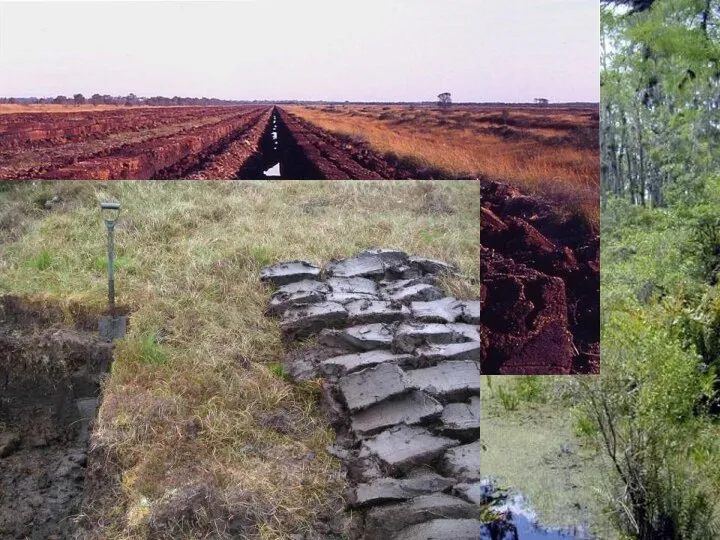
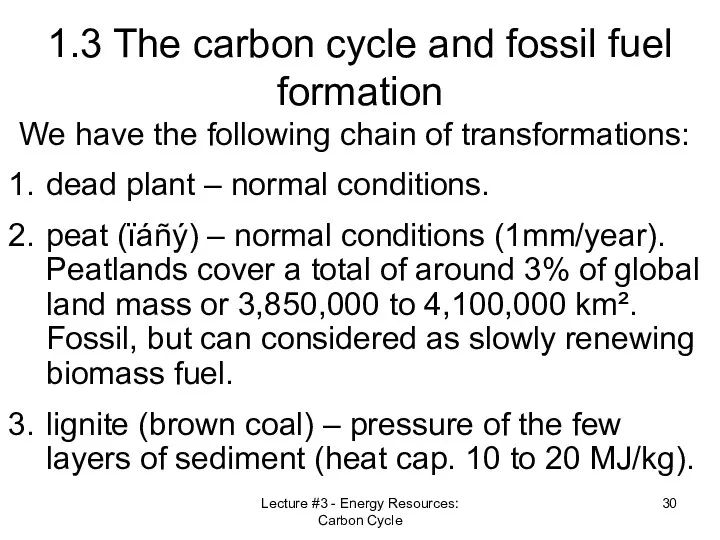
- 30. Lecture #3 - Energy Resources: Carbon Cycle 1.3 The carbon cycle and fossil fuel formation We
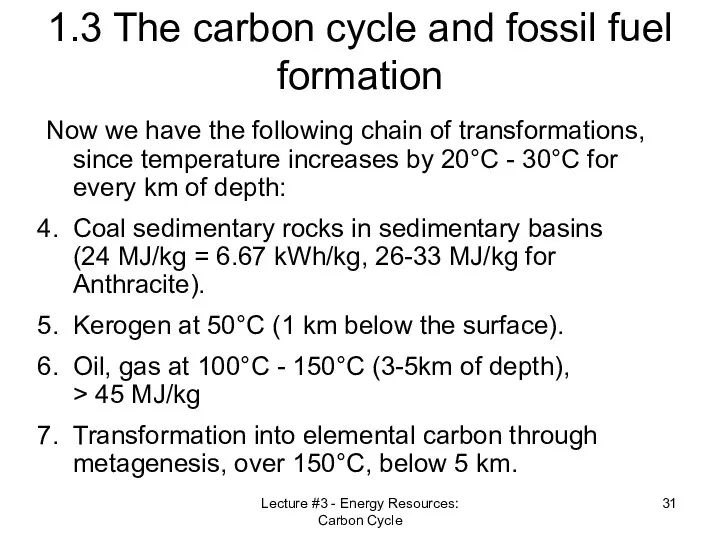
- 31. Lecture #3 - Energy Resources: Carbon Cycle 1.3 The carbon cycle and fossil fuel formation Now
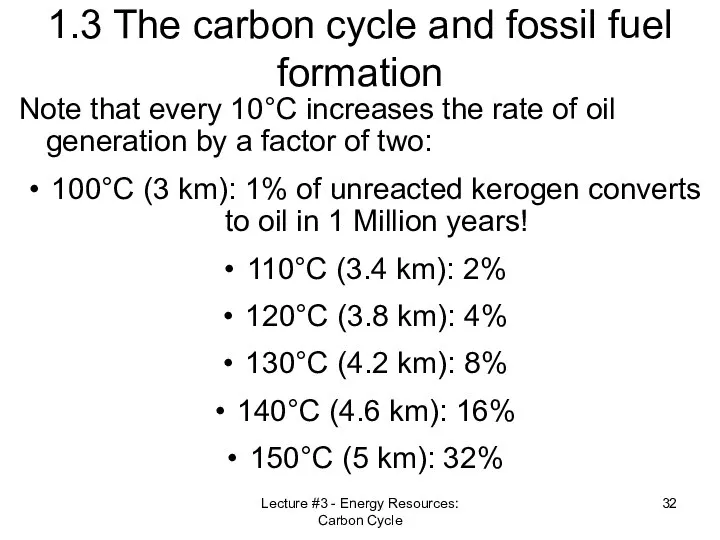
- 32. Lecture #3 - Energy Resources: Carbon Cycle 1.3 The carbon cycle and fossil fuel formation Note
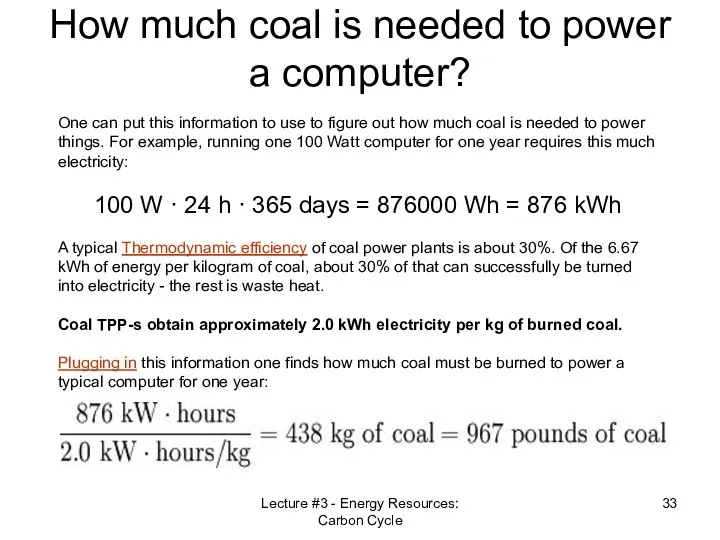
- 33. Lecture #3 - Energy Resources: Carbon Cycle How much coal is needed to power a computer?
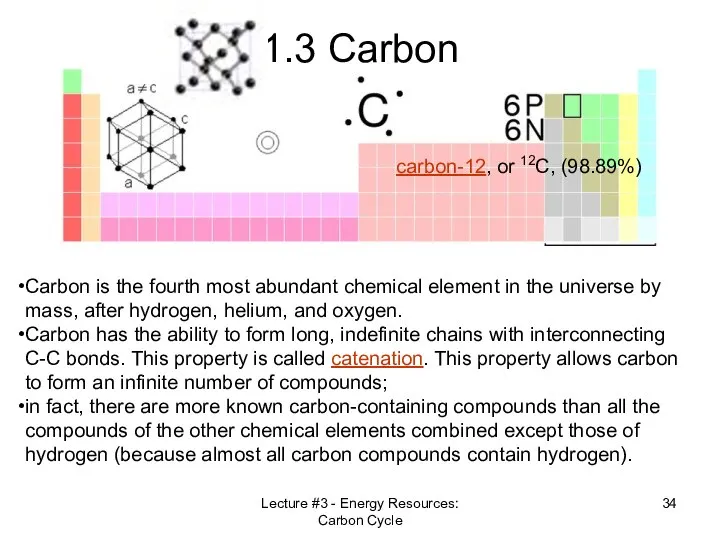
- 34. Lecture #3 - Energy Resources: Carbon Cycle 1.3 Carbon Carbon is the fourth most abundant chemical
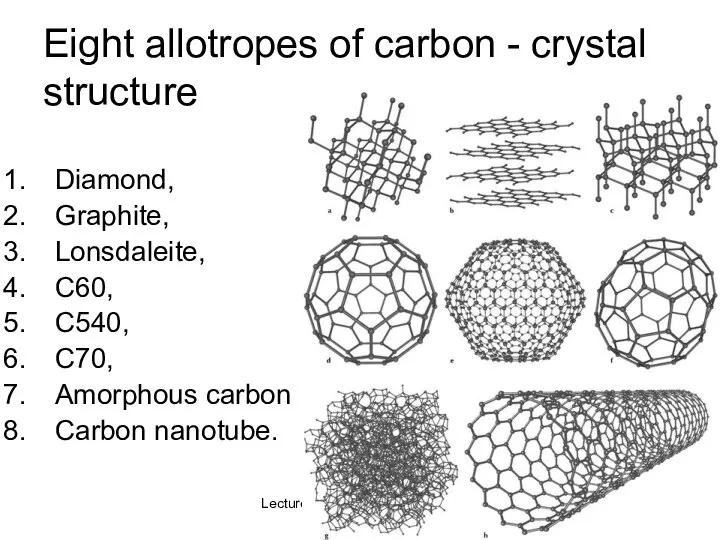
- 35. Lecture #3 - Energy Resources: Carbon Cycle Eight allotropes of carbon - crystal structure Diamond, Graphite,
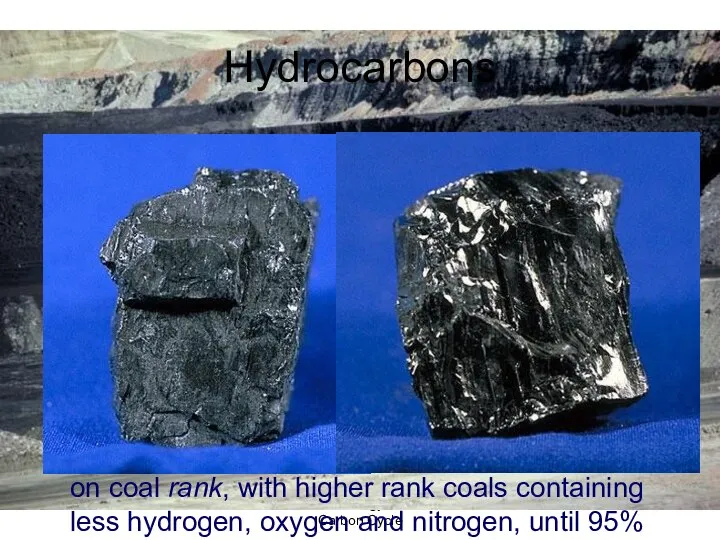
- 36. Lecture #3 - Energy Resources: Carbon Cycle Hydrocarbons HydrocarbonsHydrocarbons (such as coalHydrocarbons (such as coal, petroleumHydrocarbons
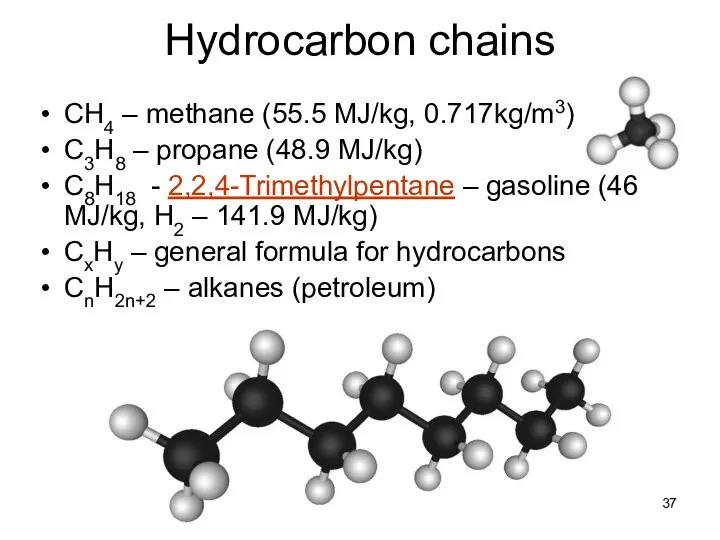
- 37. Lecture #3 - Energy Resources: Carbon Cycle Hydrocarbon chains CH4 – methane (55.5 MJ/kg, 0.717kg/m3) C3H8
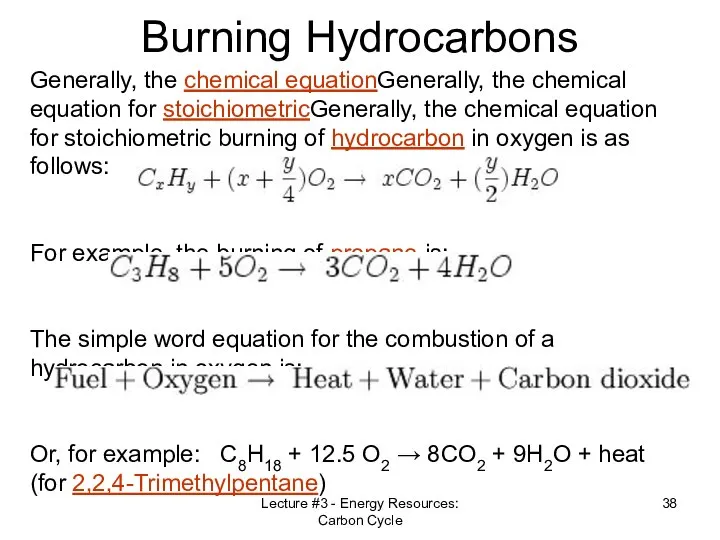
- 38. Lecture #3 - Energy Resources: Carbon Cycle Burning Hydrocarbons Generally, the chemical equationGenerally, the chemical equation
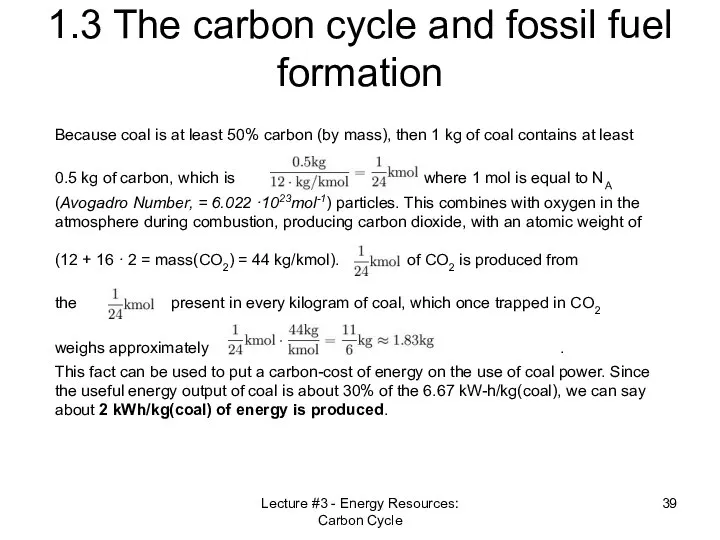
- 39. Lecture #3 - Energy Resources: Carbon Cycle 1.3 The carbon cycle and fossil fuel formation Because
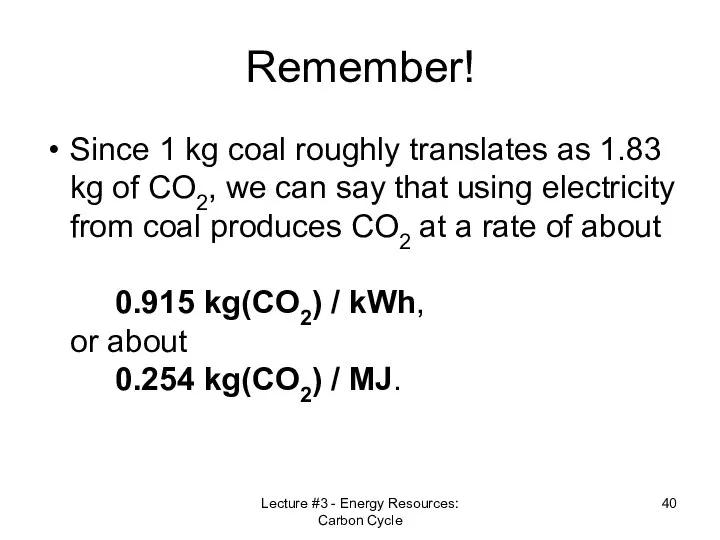
- 40. Remember! Since 1 kg coal roughly translates as 1.83 kg of CO2, we can say that
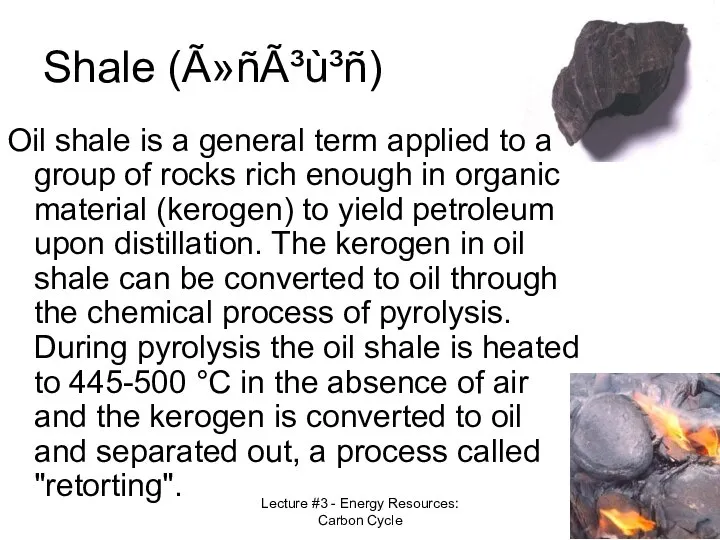
- 41. Lecture #3 - Energy Resources: Carbon Cycle Shale (ûñóù³ñ) Oil shale is a general term applied
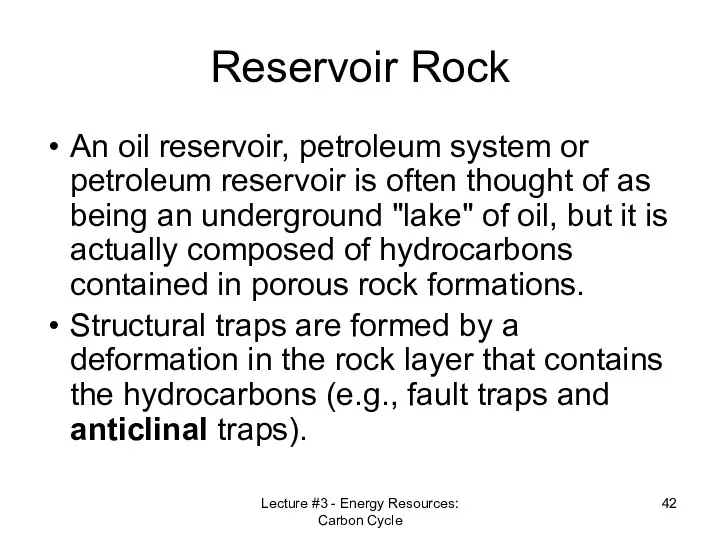
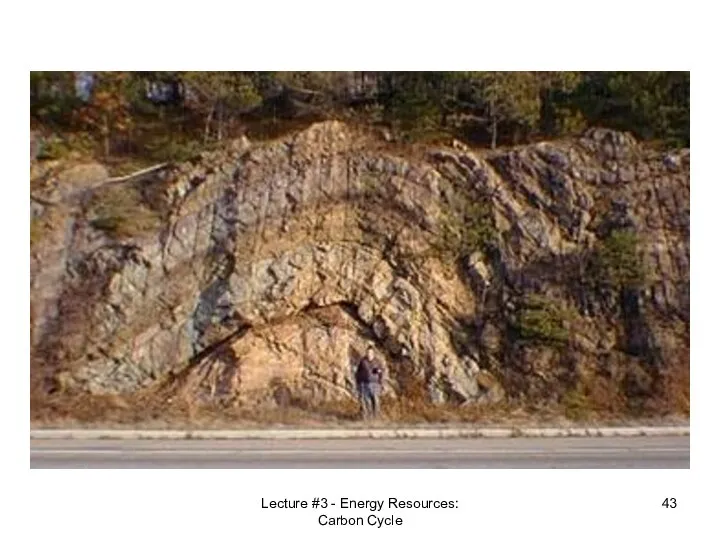
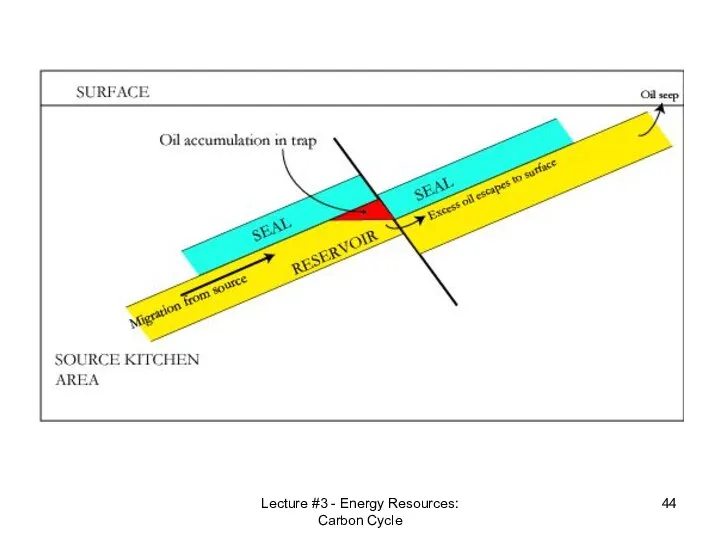
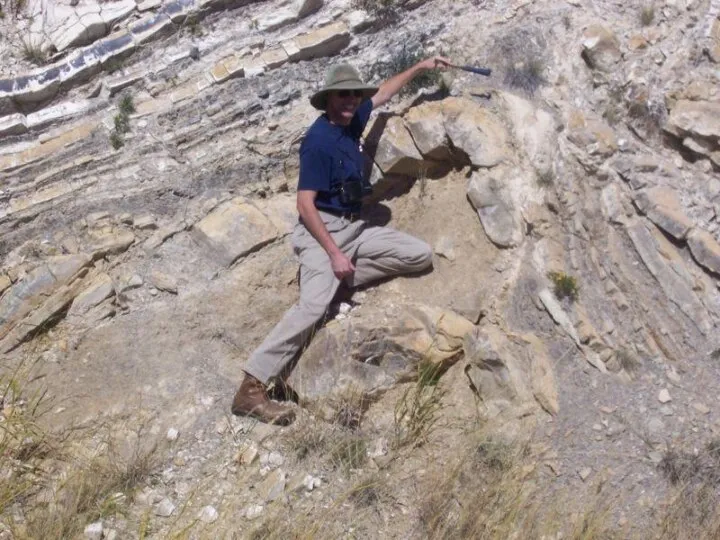
- 42. Lecture #3 - Energy Resources: Carbon Cycle Reservoir Rock An oil reservoir, petroleum system or petroleum
- 43. Lecture #3 - Energy Resources: Carbon Cycle
- 44. Lecture #3 - Energy Resources: Carbon Cycle
- 45. Lecture #3 - Energy Resources: Carbon Cycle
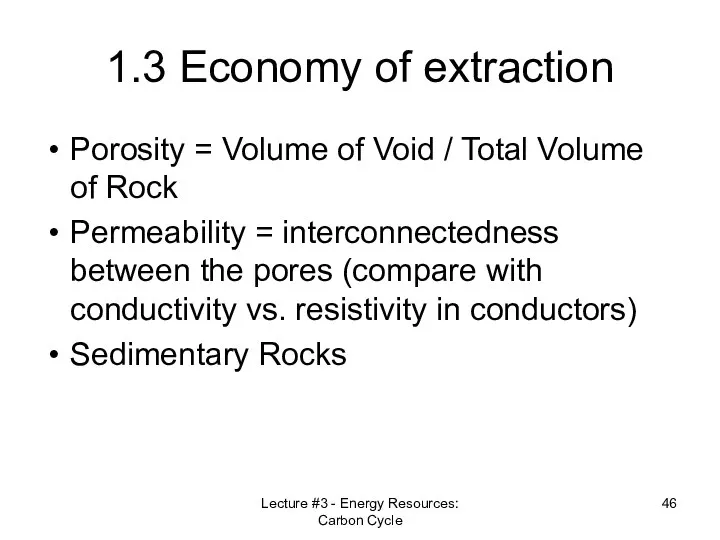
- 46. Lecture #3 - Energy Resources: Carbon Cycle 1.3 Economy of extraction Porosity = Volume of Void
- 47. Lecture #3 - Energy Resources: Carbon Cycle
- 48. Liquid fuel volume units The standard barrel of crude oil or other petroleum product (abbreviated bbl)
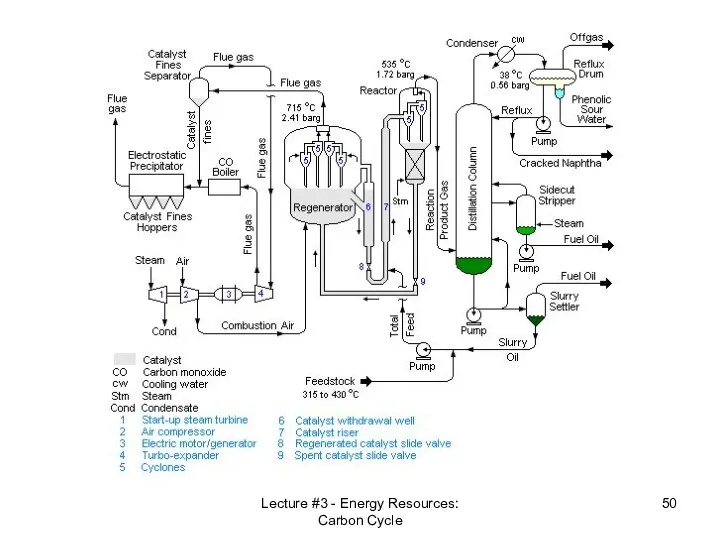
- 49. Oil extraction – gulf of Mexico Lecture #3 - Energy Resources: Carbon Cycle Oil refinery -
- 50. Lecture #3 - Energy Resources: Carbon Cycle
- 51. Oil soaked porous rock. Sample comes from offshore fields near Sicily that are too expensive to
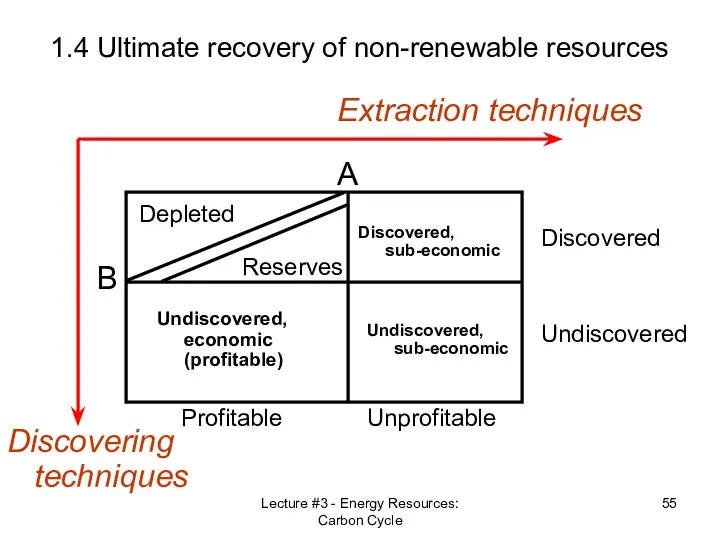
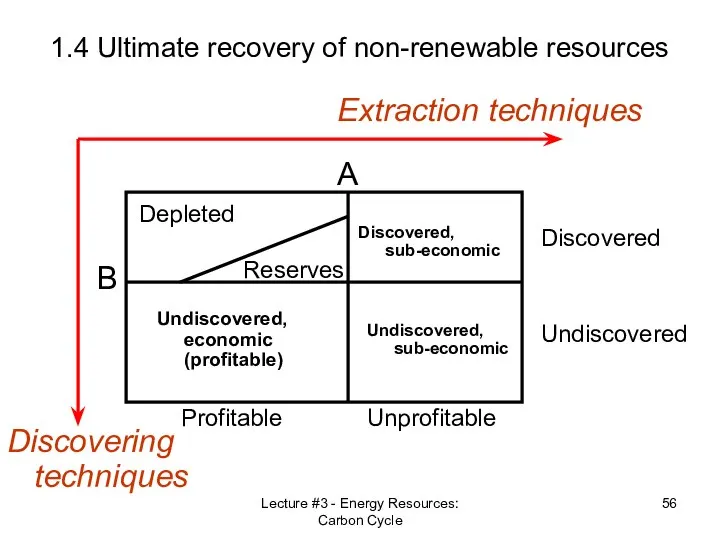
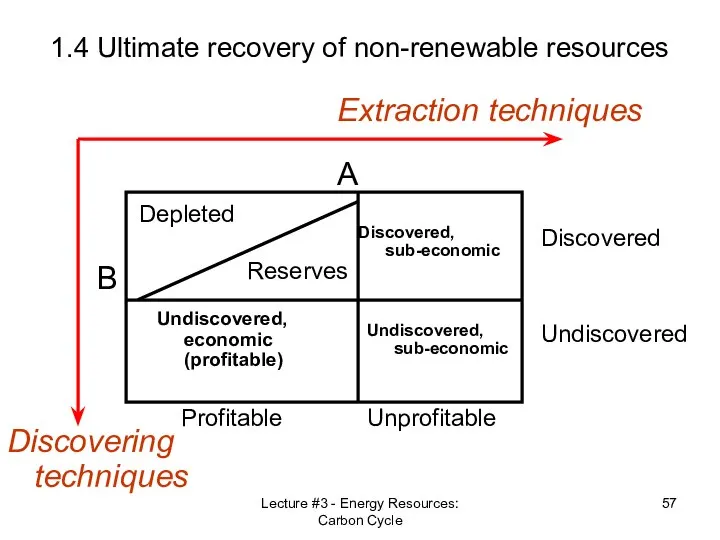
- 52. Lecture #3 - Energy Resources: Carbon Cycle 1.4 Ultimate recovery of non-renewable resources Reserves vs. Resources
- 53. Oil extraction technologies Lecture #3 - Energy Resources: Carbon Cycle
- 54. More oil extraction technologies Lecture #3 - Energy Resources: Carbon Cycle
- 55. Lecture #3 - Energy Resources: Carbon Cycle 1.4 Ultimate recovery of non-renewable resources Discovering techniques Extraction
- 56. Lecture #3 - Energy Resources: Carbon Cycle 1.4 Ultimate recovery of non-renewable resources Discovering techniques Extraction
- 57. Lecture #3 - Energy Resources: Carbon Cycle 1.4 Ultimate recovery of non-renewable resources Discovering techniques Extraction
- 58. Consumable Energy Reserves >36,000 Quads Light Oils 8,500 U238 2,200 Coal 19,100 Gas 6,200 Heavy Oils
- 59. Consumable Energy Reserves
- 60. Energy Use Always Increases Does “Current Consumption” Exist? Are reserves infinite?
- 61. Example: US Oil Production Adapted from 1956 data presented by M. King Hubbert to Spring Meeting
- 62. What Happened? "Our ignorance is not so vast as our failure to use what we know."
- 63. Importance of “Peak Oil” Resource in the ground is fixed (area under curve) Extraction past the
- 64. Fuels: from Hell to Heaven
- 65. US Oil Remaining
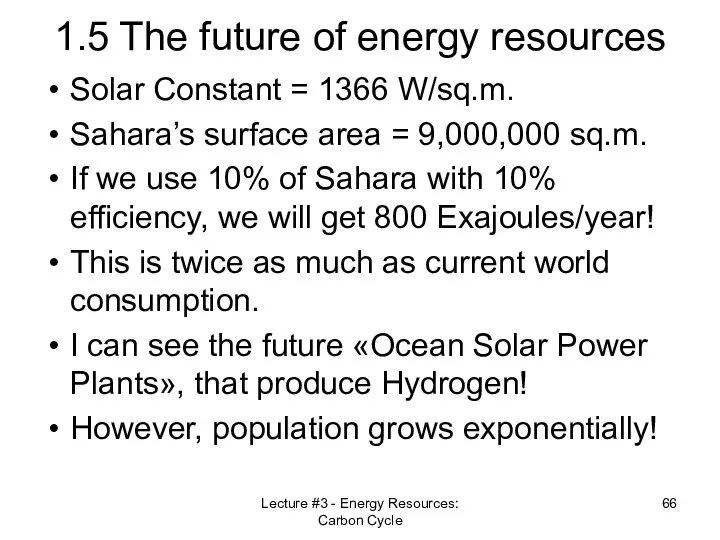
- 66. Lecture #3 - Energy Resources: Carbon Cycle 1.5 The future of energy resources Solar Constant =
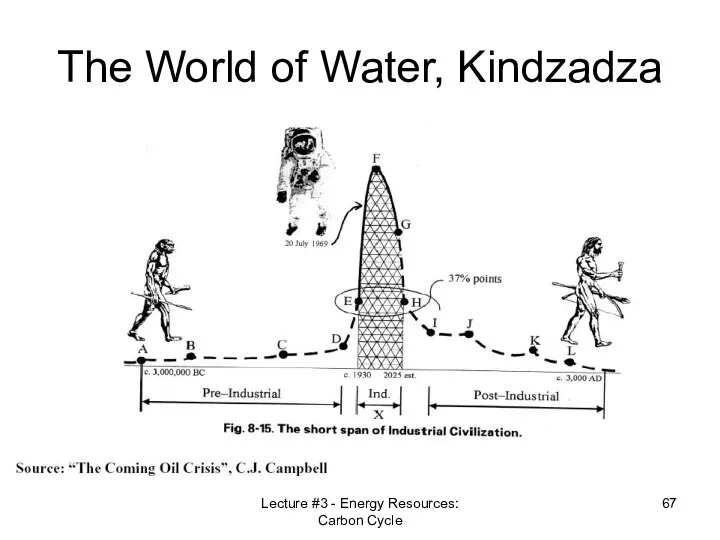
- 67. Lecture #3 - Energy Resources: Carbon Cycle The World of Water, Kindzadza
- 68. Lecture #3 - Energy Resources: Carbon Cycle
- 70. Скачать презентацию
Your homework
-3 use a more appropriate number format, e.g. 1,000,000 =
Your homework
-3 use a more appropriate number format, e.g. 1,000,000 =
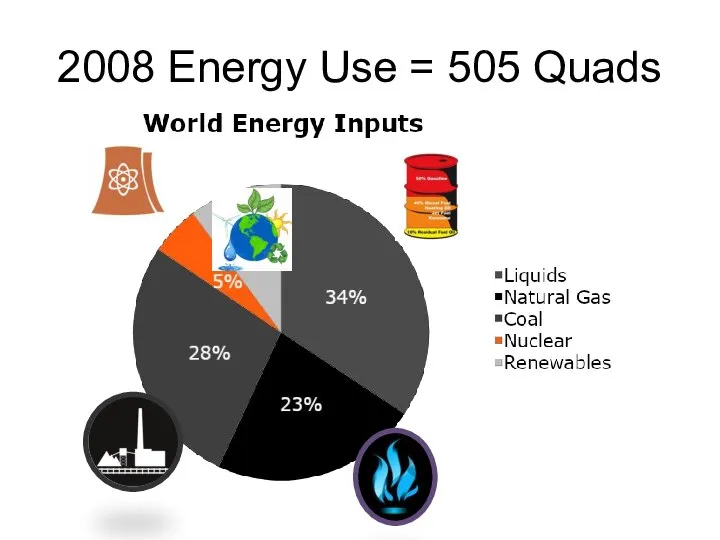
2008 Energy Use = 505 Quads
2008 Energy Use = 505 Quads
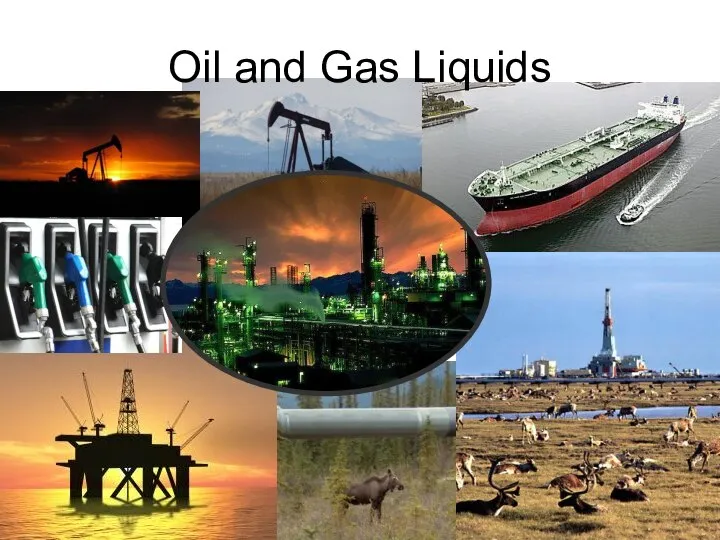
Oil and Gas Liquids
Oil and Gas Liquids
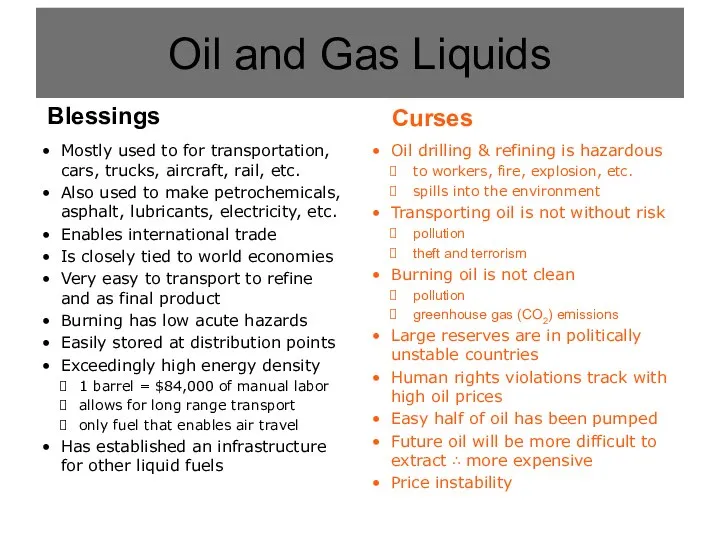
Oil drilling & refining is hazardous
to workers, fire, explosion, etc.
spills into
Oil drilling & refining is hazardous
to workers, fire, explosion, etc.
spills into
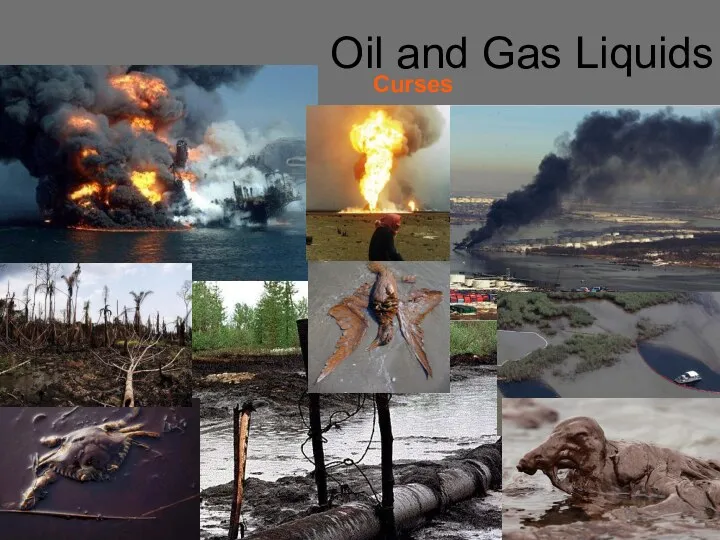
Mostly used to for transportation, cars, trucks, aircraft, rail, etc.
Also used
Mostly used to for transportation, cars, trucks, aircraft, rail, etc.
Also used
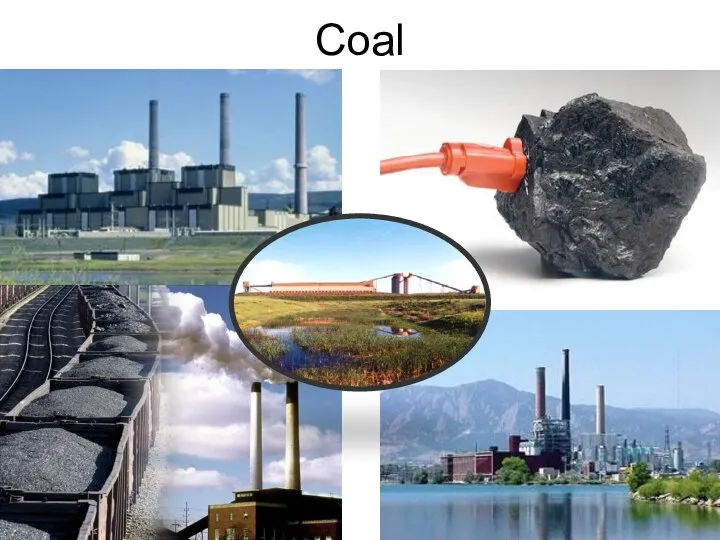
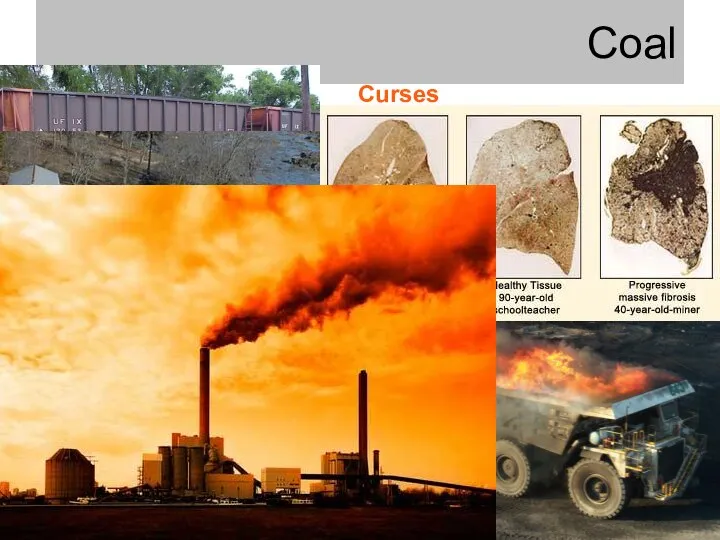
Coal
Coal
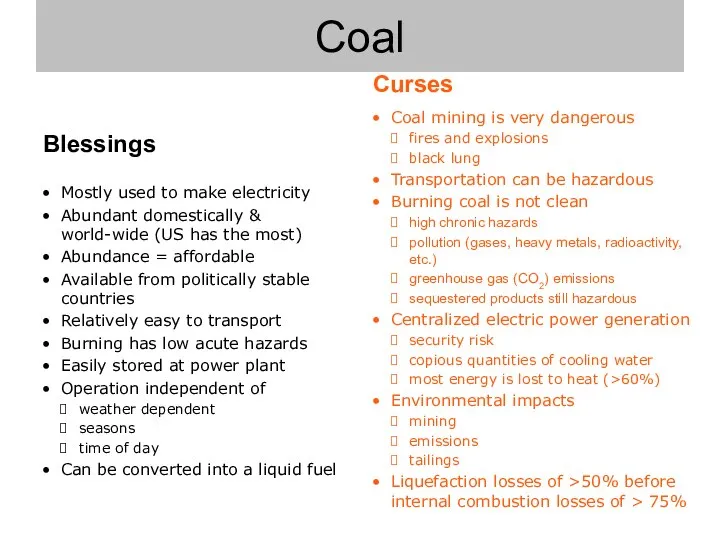
Coal mining is very dangerous
fires and explosions
black lung
Transportation can be hazardous
Burning
Coal mining is very dangerous
fires and explosions
black lung
Transportation can be hazardous
Burning
Mostly used to make electricity
Abundant domestically &
world-wide (US has the
Mostly used to make electricity
Abundant domestically &
world-wide (US has the
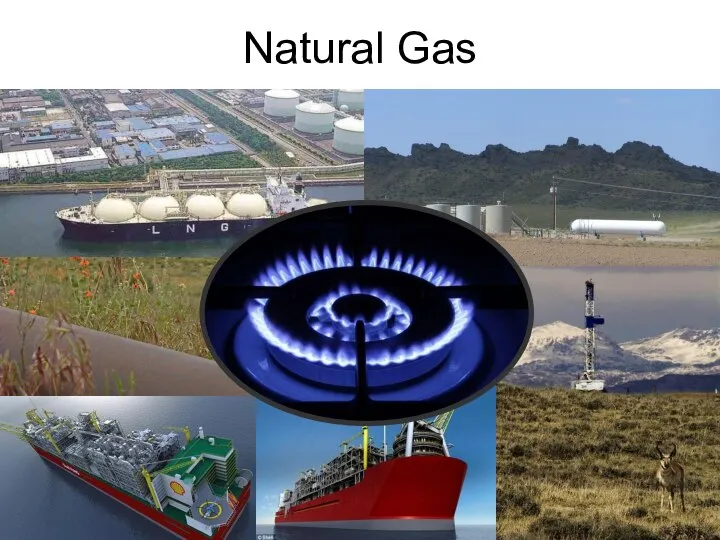
Natural Gas
Natural Gas
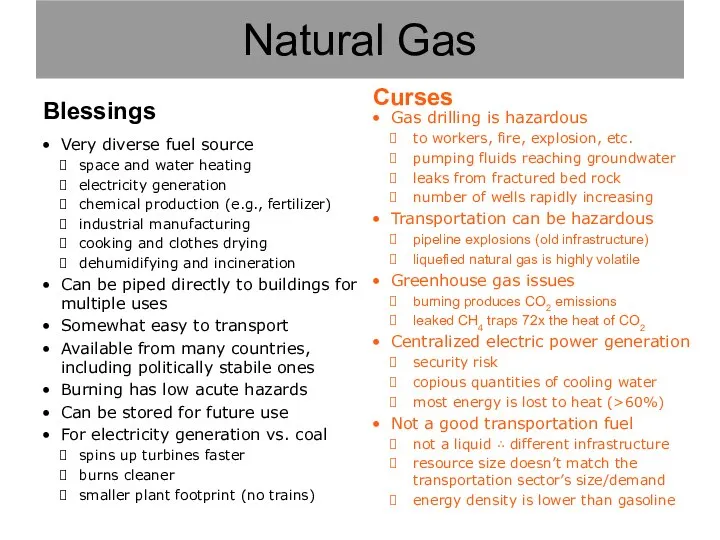
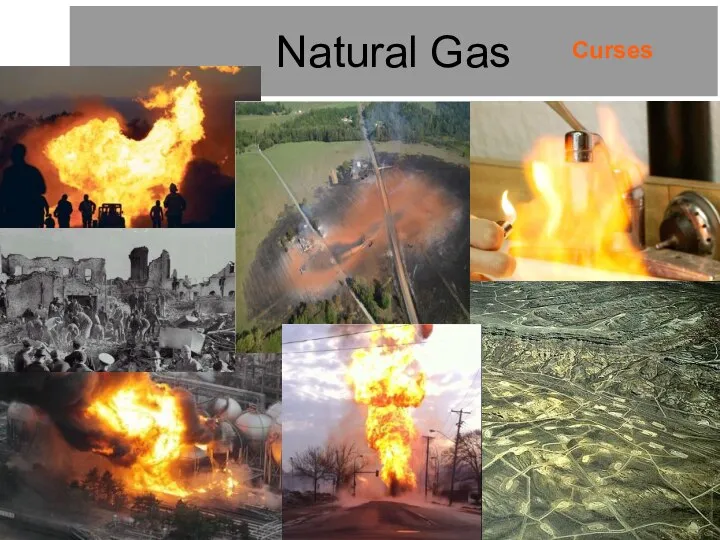
Gas drilling is hazardous
to workers, fire, explosion, etc.
pumping fluids reaching groundwater
leaks
Gas drilling is hazardous
to workers, fire, explosion, etc.
pumping fluids reaching groundwater
leaks
Gas drilling is hazardous
to workers, fire, explosion, etc.
pumping fluids reaching groundwater
leaks
Gas drilling is hazardous
to workers, fire, explosion, etc.
pumping fluids reaching groundwater
leaks
Earth atmosphere composition
Lecture #3 - Energy Resources: Carbon Cycle
Earth atmosphere composition
Lecture #3 - Energy Resources: Carbon Cycle
Lecture #3 - Energy Resources: Carbon Cycle
Lecture #3 - Energy Resources: Carbon Cycle
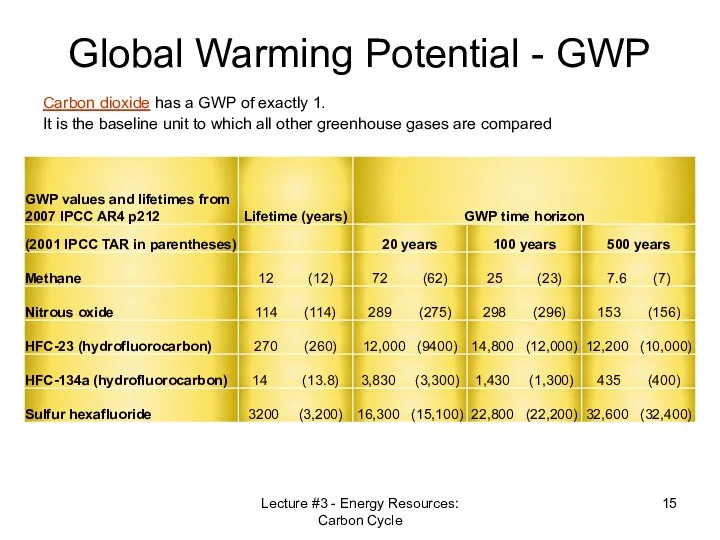
Global Warming Potential - GWP
Lecture #3 - Energy Resources: Carbon Cycle
Carbon
Global Warming Potential - GWP
Lecture #3 - Energy Resources: Carbon Cycle
Carbon
Lecture #3 - Energy Resources: Carbon Cycle
History of CO2 Emissions
Since 1751
Lecture #3 - Energy Resources: Carbon Cycle
History of CO2 Emissions
Since 1751

Lecture #3 - Energy Resources: Carbon Cycle
Lecture #3 - Energy Resources: Carbon Cycle
Lecture #3 - Energy Resources: Carbon Cycle
Actual CO2 Concentration
0.038%
Lecture #3 - Energy Resources: Carbon Cycle
Actual CO2 Concentration
0.038%
Lecture #3 - Energy Resources: Carbon Cycle
Lecture #3 - Energy Resources: Carbon Cycle
Lecture #3 - Energy Resources: Carbon Cycle
The history of human energy
Lecture #3 - Energy Resources: Carbon Cycle
The history of human energy
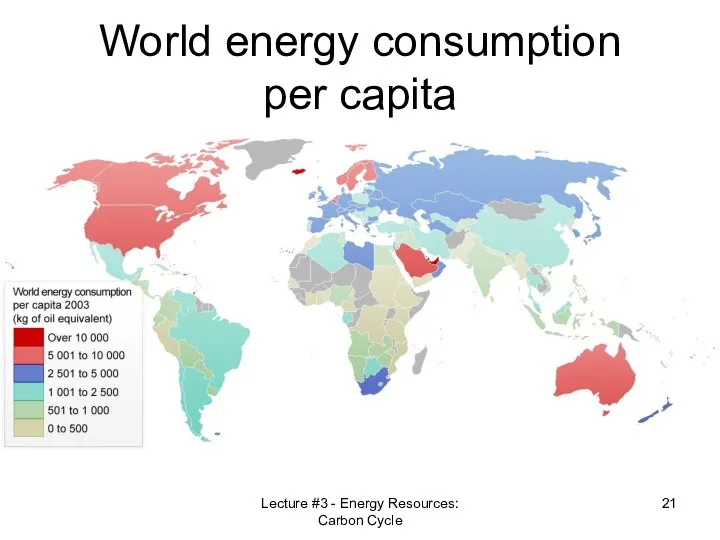
World energy consumption per capita
Lecture #3 - Energy Resources: Carbon Cycle
World energy consumption per capita
Lecture #3 - Energy Resources: Carbon Cycle
Comparison
In 2008 energy use per person was in the USA 4.1
Comparison
In 2008 energy use per person was in the USA 4.1
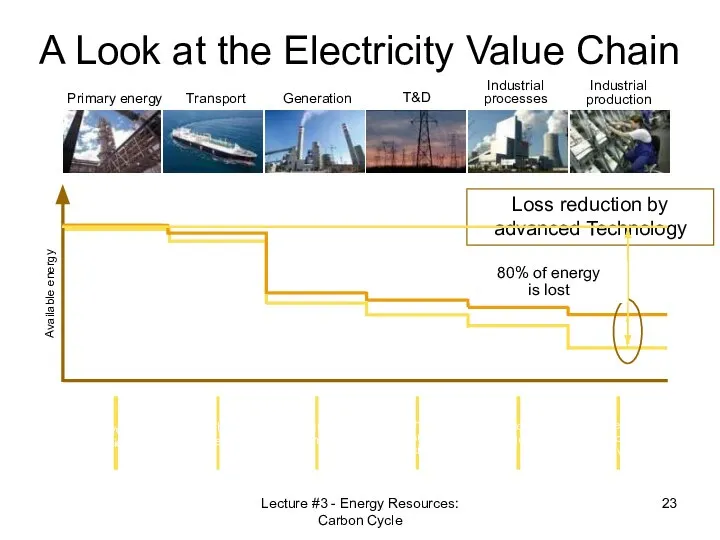
Primary energy
Transport
Generation
T&D
Industrial processes
Industrial production
Available energy
A Look at the Electricity Value Chain
More
Primary energy
Transport
Generation
T&D
Industrial processes
Industrial production
Available energy
A Look at the Electricity Value Chain
More
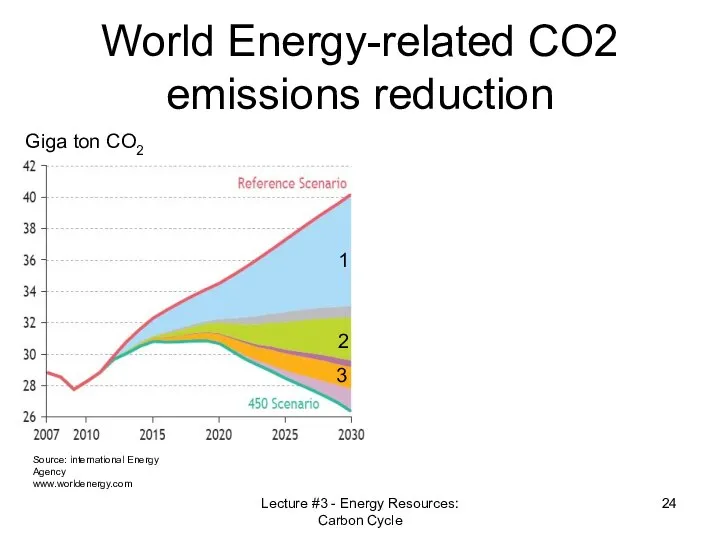
World Energy-related CO2 emissions reduction
Source: international Energy Agency
www.worldenergy.com
Giga ton CO2
1
2
3
Lecture #3
World Energy-related CO2 emissions reduction
Source: international Energy Agency
www.worldenergy.com
Giga ton CO2
1
2
3
Lecture #3
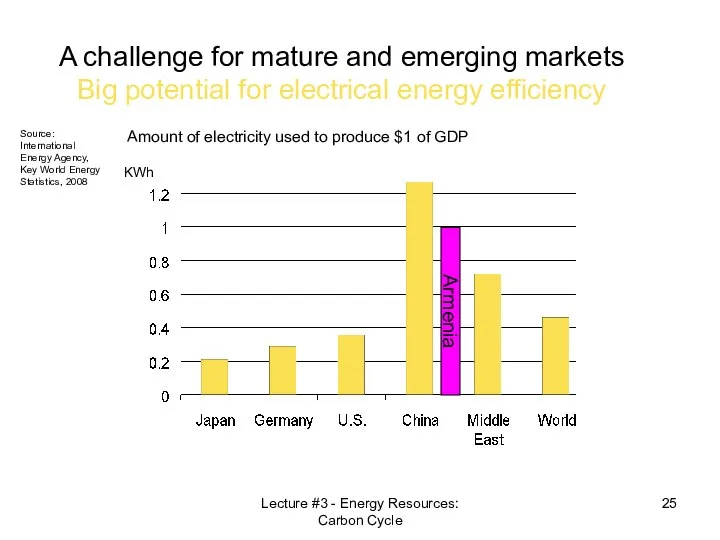
Amount of electricity used to produce $1 of GDP
A challenge for
Amount of electricity used to produce $1 of GDP
A challenge for
Lecture #3 - Energy Resources: Carbon Cycle
1.3 The carbon cycle and
Lecture #3 - Energy Resources: Carbon Cycle
1.3 The carbon cycle and
Lecture #3 - Energy Resources: Carbon Cycle
1.3 The carbon cycle and
Lecture #3 - Energy Resources: Carbon Cycle
1.3 The carbon cycle and
Lecture #3 - Energy Resources: Carbon Cycle
Here geological times are involved
Lecture #3 - Energy Resources: Carbon Cycle
Here geological times are involved
Lecture #3 - Energy Resources: Carbon Cycle
1.3 The carbon cycle and
Lecture #3 - Energy Resources: Carbon Cycle
1.3 The carbon cycle and
Lecture #3 - Energy Resources: Carbon Cycle
1.3 The carbon cycle and
Lecture #3 - Energy Resources: Carbon Cycle
1.3 The carbon cycle and
Lecture #3 - Energy Resources: Carbon Cycle
1.3 The carbon cycle and
Lecture #3 - Energy Resources: Carbon Cycle
1.3 The carbon cycle and
Lecture #3 - Energy Resources: Carbon Cycle
1.3 The carbon cycle and
Lecture #3 - Energy Resources: Carbon Cycle
1.3 The carbon cycle and
Lecture #3 - Energy Resources: Carbon Cycle
How much coal is needed
Lecture #3 - Energy Resources: Carbon Cycle
How much coal is needed
Lecture #3 - Energy Resources: Carbon Cycle
1.3 Carbon
Carbon is the fourth
Lecture #3 - Energy Resources: Carbon Cycle
1.3 Carbon
Carbon is the fourth
Lecture #3 - Energy Resources: Carbon Cycle
Eight allotropes of carbon -
Lecture #3 - Energy Resources: Carbon Cycle
Eight allotropes of carbon -
Lecture #3 - Energy Resources: Carbon Cycle
Hydrocarbons
HydrocarbonsHydrocarbons (such as coalHydrocarbons (such
Lecture #3 - Energy Resources: Carbon Cycle
Hydrocarbons
HydrocarbonsHydrocarbons (such as coalHydrocarbons (such
Lecture #3 - Energy Resources: Carbon Cycle
Hydrocarbon chains
CH4 – methane (55.5
Lecture #3 - Energy Resources: Carbon Cycle
Hydrocarbon chains
CH4 – methane (55.5
Lecture #3 - Energy Resources: Carbon Cycle
Burning Hydrocarbons
Generally, the chemical equationGenerally,
Lecture #3 - Energy Resources: Carbon Cycle
Burning Hydrocarbons
Generally, the chemical equationGenerally,
Lecture #3 - Energy Resources: Carbon Cycle
1.3 The carbon cycle and
Lecture #3 - Energy Resources: Carbon Cycle
1.3 The carbon cycle and
Remember!
Since 1 kg coal roughly translates as 1.83 kg of CO2,
Remember!
Since 1 kg coal roughly translates as 1.83 kg of CO2,
Lecture #3 - Energy Resources: Carbon Cycle
Shale (ûñóù³ñ)
Oil shale is
Lecture #3 - Energy Resources: Carbon Cycle
Shale (ûñóù³ñ)
Oil shale is
Lecture #3 - Energy Resources: Carbon Cycle
Reservoir Rock
An oil reservoir, petroleum
Lecture #3 - Energy Resources: Carbon Cycle
Reservoir Rock
An oil reservoir, petroleum
Lecture #3 - Energy Resources: Carbon Cycle
Lecture #3 - Energy Resources: Carbon Cycle
Lecture #3 - Energy Resources: Carbon Cycle
Lecture #3 - Energy Resources: Carbon Cycle
Lecture #3 - Energy Resources: Carbon Cycle
Lecture #3 - Energy Resources: Carbon Cycle
Lecture #3 - Energy Resources: Carbon Cycle
1.3 Economy of extraction
Porosity =
Lecture #3 - Energy Resources: Carbon Cycle
1.3 Economy of extraction
Porosity =
Lecture #3 - Energy Resources: Carbon Cycle
Lecture #3 - Energy Resources: Carbon Cycle
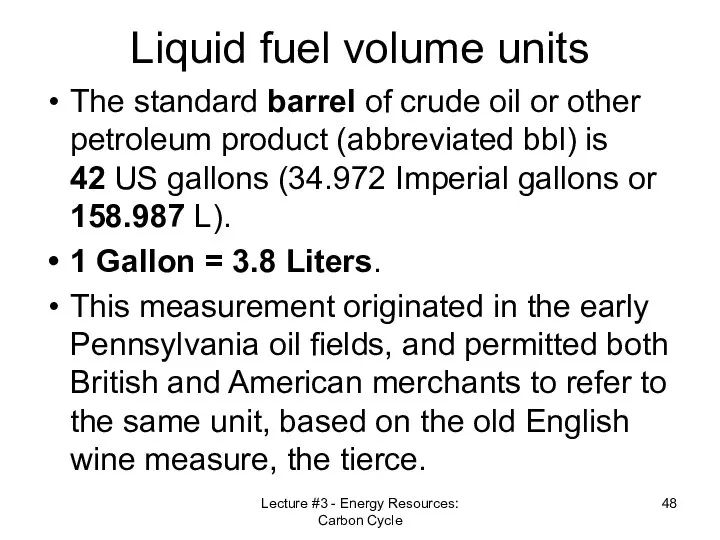
Liquid fuel volume units
The standard barrel of crude oil or other
Liquid fuel volume units
The standard barrel of crude oil or other
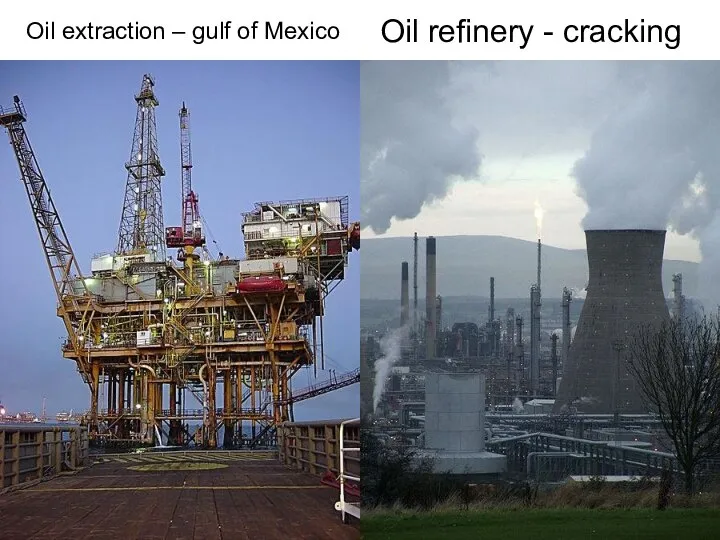
Oil extraction – gulf of Mexico
Lecture #3 - Energy Resources: Carbon
Oil extraction – gulf of Mexico
Lecture #3 - Energy Resources: Carbon
Lecture #3 - Energy Resources: Carbon Cycle
Lecture #3 - Energy Resources: Carbon Cycle
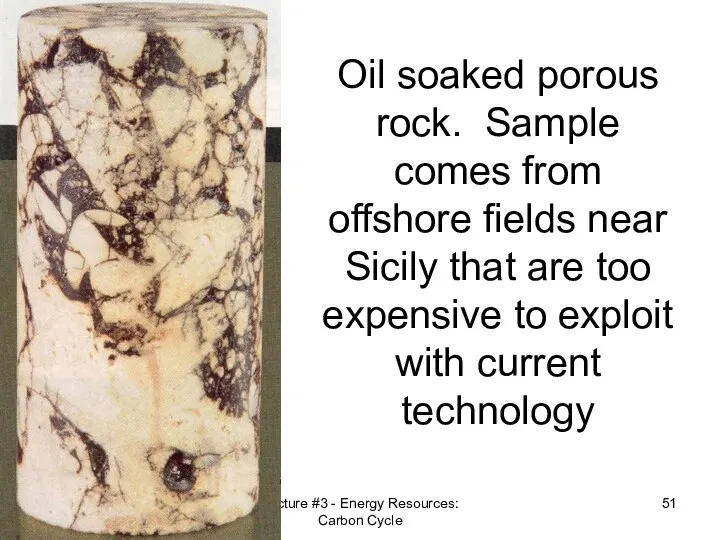
Oil soaked porous rock. Sample comes from offshore fields near Sicily
Oil soaked porous rock. Sample comes from offshore fields near Sicily
Lecture #3 - Energy Resources: Carbon Cycle
1.4 Ultimate recovery of
non-renewable
Lecture #3 - Energy Resources: Carbon Cycle
1.4 Ultimate recovery of non-renewable
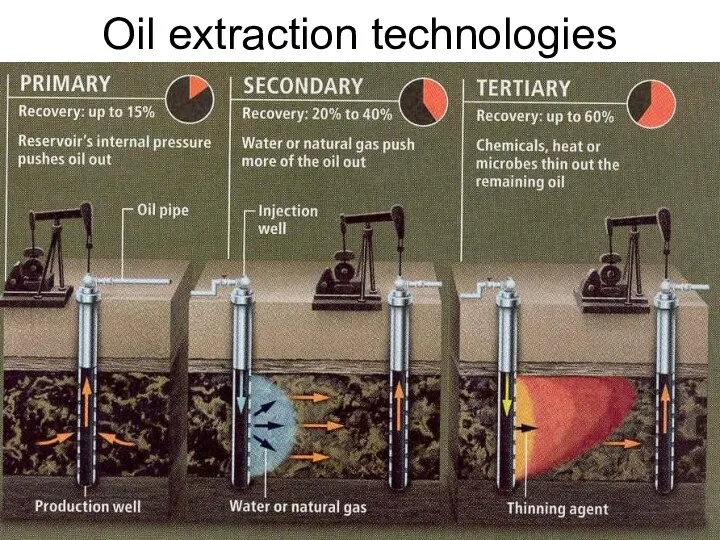
Oil extraction technologies
Lecture #3 - Energy Resources: Carbon Cycle
Oil extraction technologies
Lecture #3 - Energy Resources: Carbon Cycle
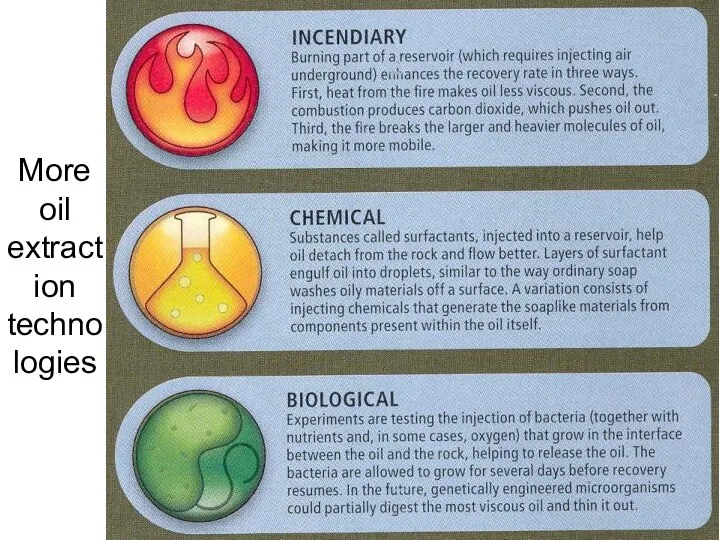
More oil extraction technologies
Lecture #3 - Energy Resources: Carbon Cycle
More oil extraction technologies
Lecture #3 - Energy Resources: Carbon Cycle
Lecture #3 - Energy Resources: Carbon Cycle
1.4 Ultimate recovery of non-renewable
Lecture #3 - Energy Resources: Carbon Cycle
1.4 Ultimate recovery of non-renewable
Lecture #3 - Energy Resources: Carbon Cycle
1.4 Ultimate recovery of non-renewable
Lecture #3 - Energy Resources: Carbon Cycle
1.4 Ultimate recovery of non-renewable
Lecture #3 - Energy Resources: Carbon Cycle
1.4 Ultimate recovery of non-renewable
Lecture #3 - Energy Resources: Carbon Cycle
1.4 Ultimate recovery of non-renewable
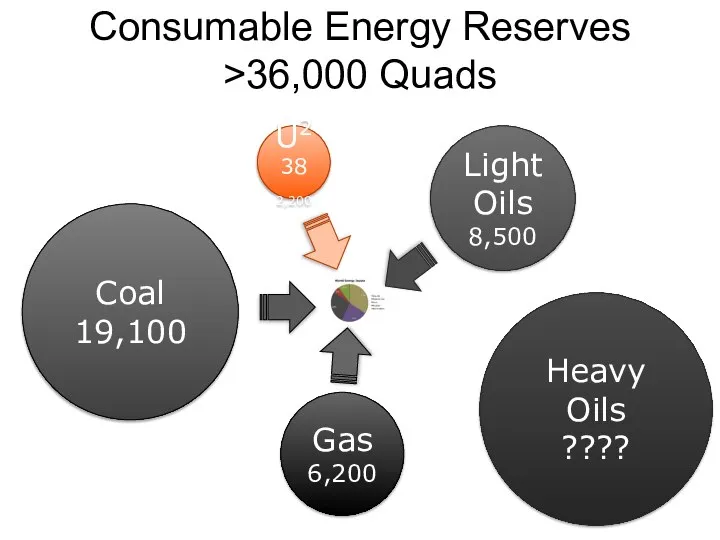
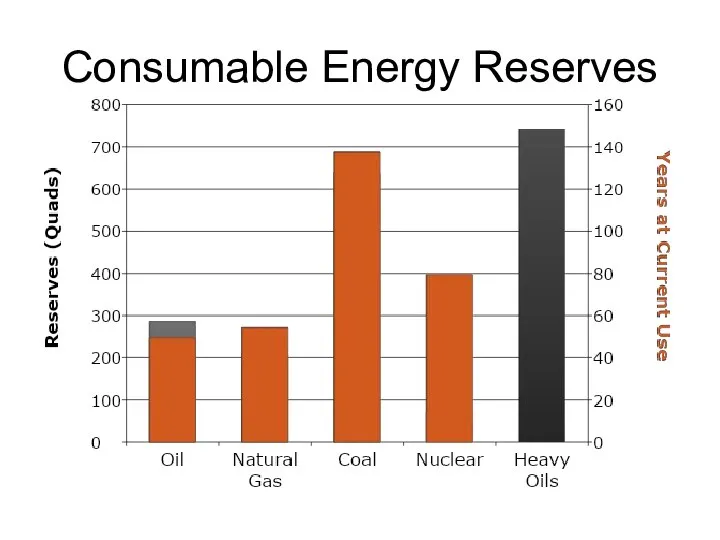
Consumable Energy Reserves
>36,000 Quads
Light
Oils
8,500
U238
2,200
Coal
19,100
Gas
6,200
Heavy
Oils
????
Consumable Energy Reserves
>36,000 Quads
Light
Oils
8,500
U238
2,200
Coal
19,100
Gas
6,200
Heavy
Oils
????
Consumable Energy Reserves
Consumable Energy Reserves
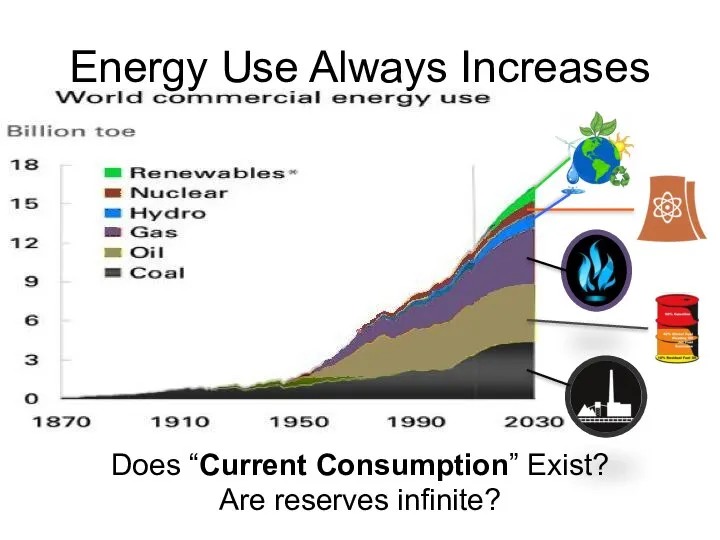
Energy Use Always Increases
Does “Current Consumption” Exist?
Are reserves infinite?
Energy Use Always Increases
Does “Current Consumption” Exist?
Are reserves infinite?
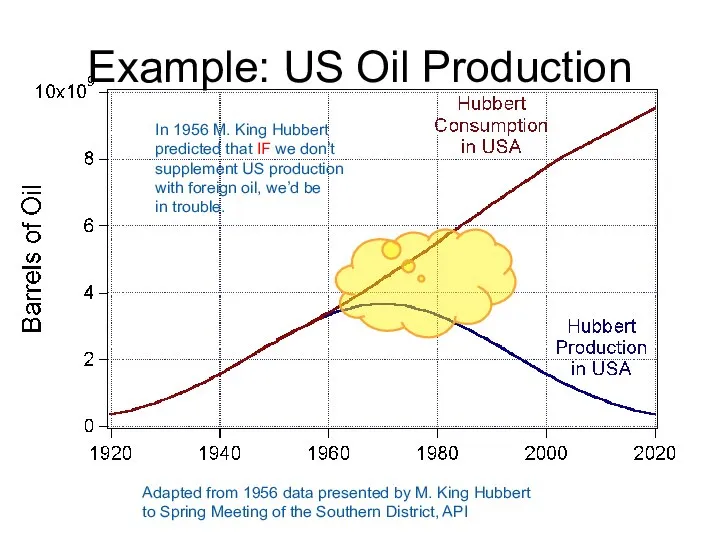
Example: US Oil Production
Adapted from 1956 data presented by M. King
Example: US Oil Production
Adapted from 1956 data presented by M. King
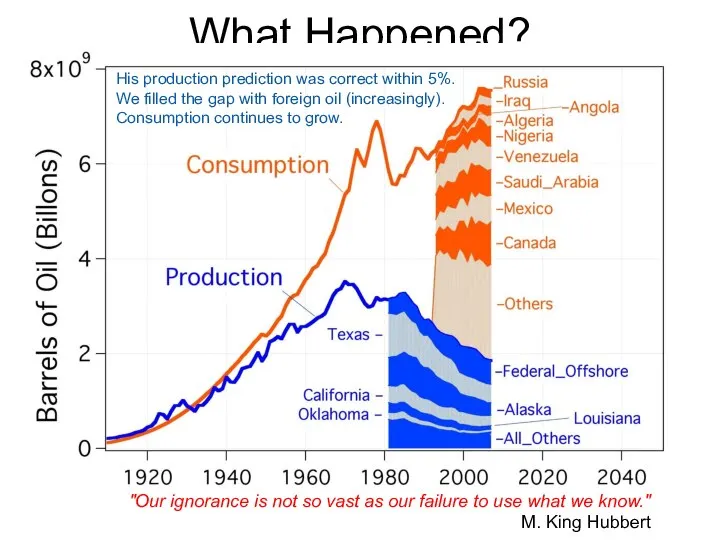
What Happened?
"Our ignorance is not so vast as our failure to
What Happened?
"Our ignorance is not so vast as our failure to
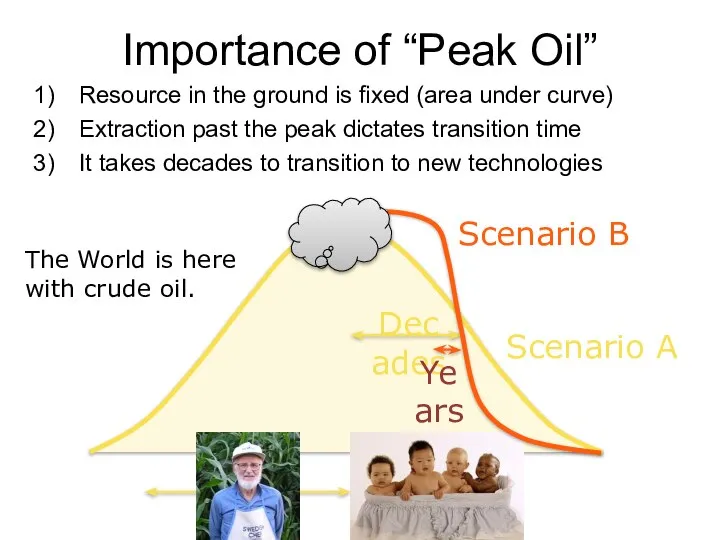
Importance of “Peak Oil”
Resource in the ground is fixed (area under
Importance of “Peak Oil”
Resource in the ground is fixed (area under
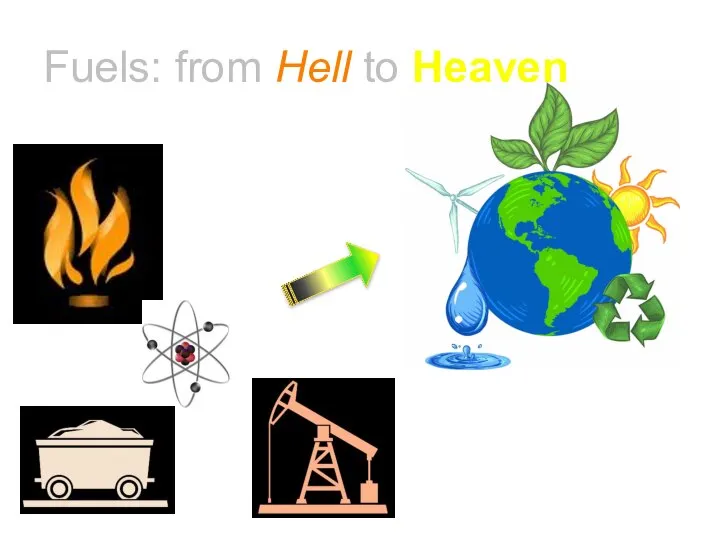
Fuels: from Hell to Heaven
Fuels: from Hell to Heaven
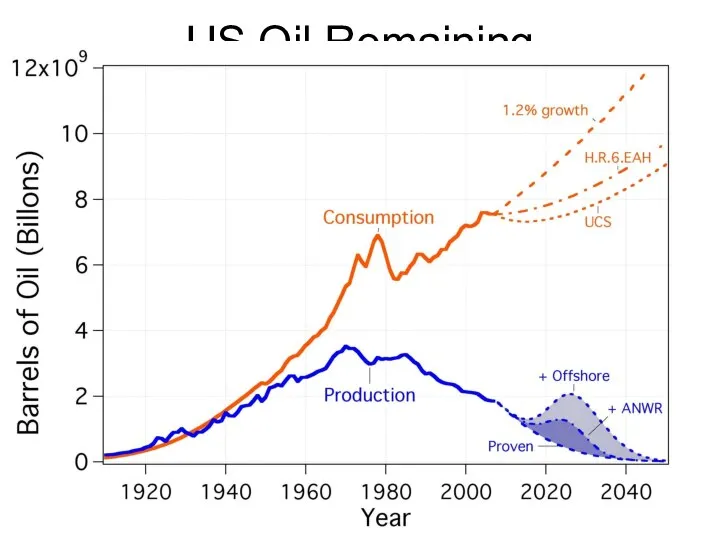
US Oil Remaining
US Oil Remaining
Lecture #3 - Energy Resources: Carbon Cycle
1.5 The future of energy
Lecture #3 - Energy Resources: Carbon Cycle
1.5 The future of energy
Lecture #3 - Energy Resources: Carbon Cycle
The World of Water, Kindzadza
Lecture #3 - Energy Resources: Carbon Cycle
The World of Water, Kindzadza
Lecture #3 - Energy Resources: Carbon Cycle
Lecture #3 - Energy Resources: Carbon Cycle
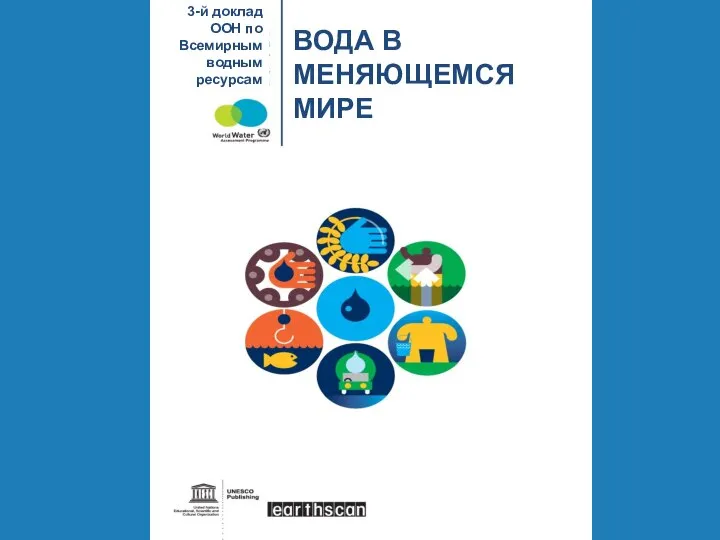 Вода в меняющемся мире
 Уникальные свойства воды
 Разработка проекта нормативов образования отходов и лимитов на их размещения для ОСП «УЗМК ВНЗМ»
 Ökologie und umweltverträglichkeit
 Экологически допустимый вклад предприятия в загрязнение атмосферы. Структура и рекомендации по оформлению
 Биогеоценоз. Биогеоценотический уровень организации жизни. Разнообразие видов
 Экологический проект «Мусор надо разделять, чтоб использовать опять»
 Кабинет экологии. МАДОУ «Детский сад №99 общеразвивающего вида»
 Структура и свойства экосистемы
 Смирновский заповедник
 Значение летнего оздоровительного лагеря для экологического образования детей в интересах устойчивого развития
 Презентация Кто что ест
  Структура экосистемы
 Пластиковая бутылка – проблемы и решения
 Методическая разработка по выполнению инновационного проекта «Цветы и время»
 Биологические ресурсы, их рациональное использование
 Радиационные аварии и их последствия
 Поток энергии и круговорот веществ в экосистемах
 Живая нить
 Мероприятия по охране редких и исчезающих растений и животных
 Презентация на тему Где живут белые медведи и пингвины? Урок окружающего мира 1 класс
 Мониторинг радиационного загрязнения
 Экология пәні. Ортаның экологиялық факторлары
 Промышленная биотехнология
 Глобальные экологические проблемы
 Работа международных экологических организаций России
 Сохранение и восстановление лесов
 Заказник Пижемский