- The getKanban Board Game!

Содержание
- 2. Facilitator’s Guide Hello Facilitator Before facilitating the game with a group you should read through this
- 3. Teams Facilitator’s Guide The game is designed to be played by a team of people. It
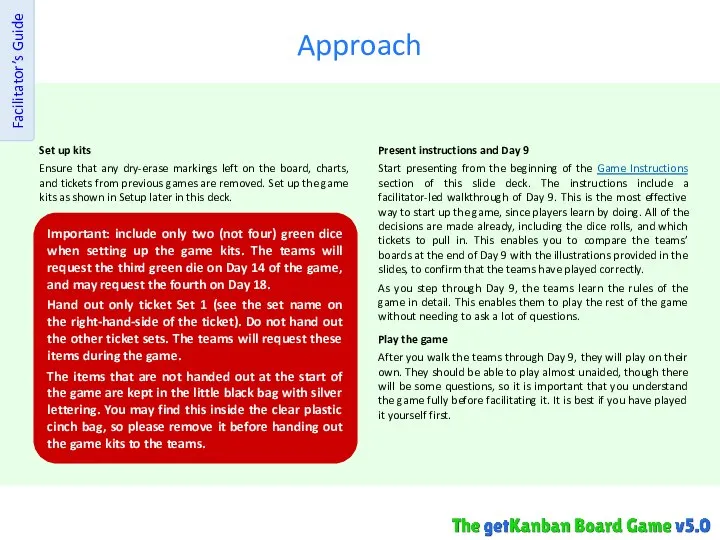
- 4. Approach Facilitator’s Guide Set up kits Ensure that any dry-erase markings left on the board, charts,
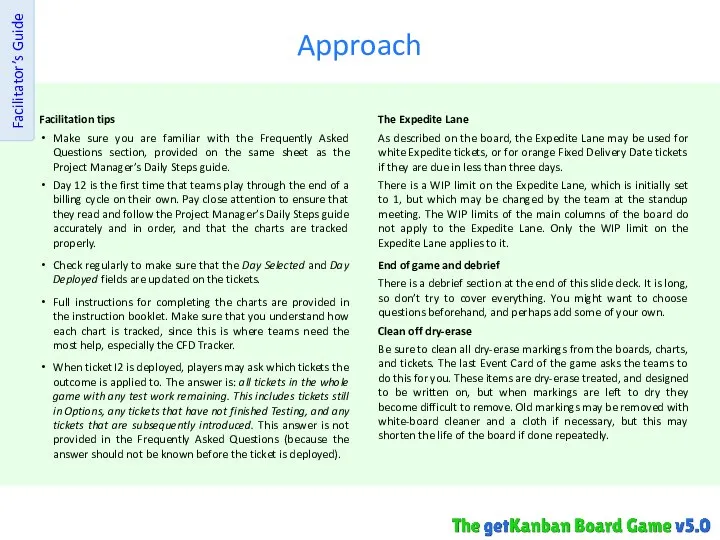
- 5. Approach Facilitator’s Guide Facilitation tips Make sure you are familiar with the Frequently Asked Questions section,
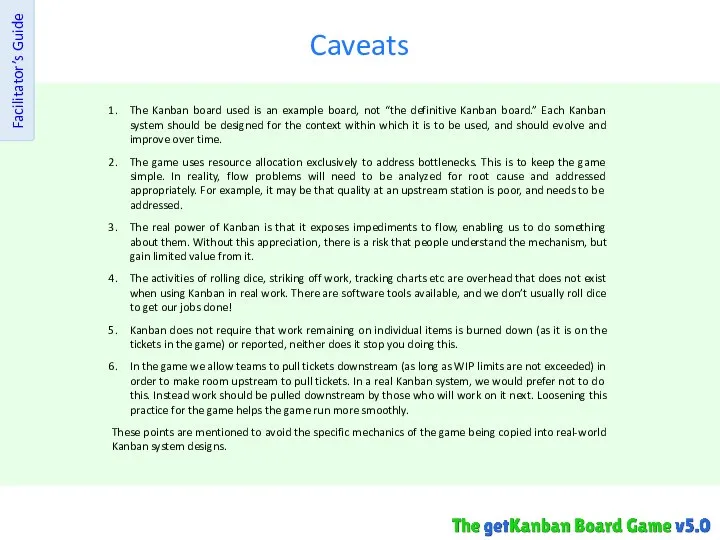
- 6. Caveats Facilitator’s Guide The Kanban board used is an example board, not “the definitive Kanban board.”
- 7. Game Kit Contents: Bags Facilitator’s Guide One game kit includes one document sleeve, one clear cinch
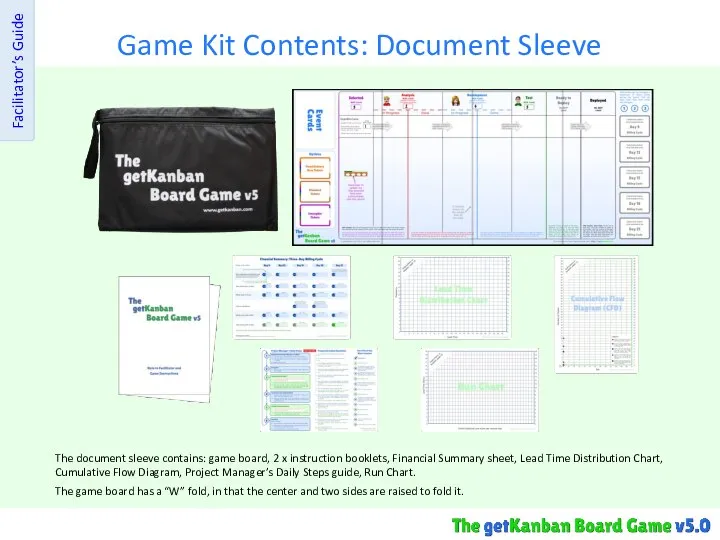
- 8. Game Kit Contents: Document Sleeve Facilitator’s Guide The document sleeve contains: game board, 2 x instruction
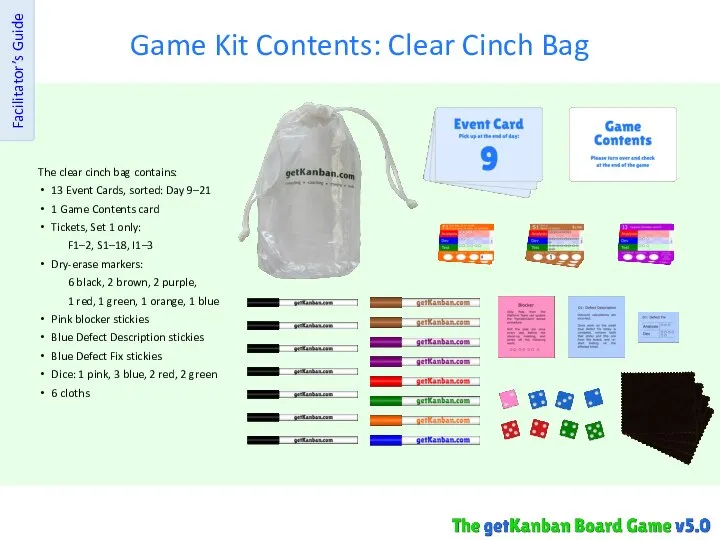
- 9. Game Kit Contents: Clear Cinch Bag Facilitator’s Guide The clear cinch bag contains: 13 Event Cards,
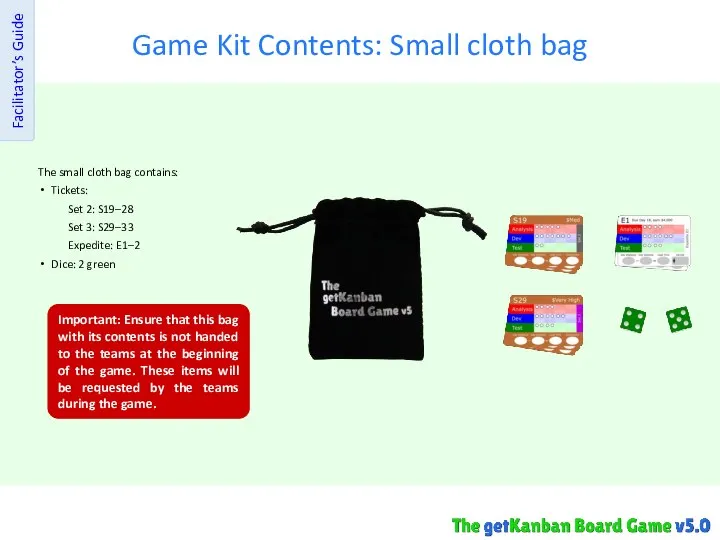
- 10. Game Kit Contents: Small cloth bag Facilitator’s Guide The small cloth bag contains: Tickets: Set 2:
- 11. Setup
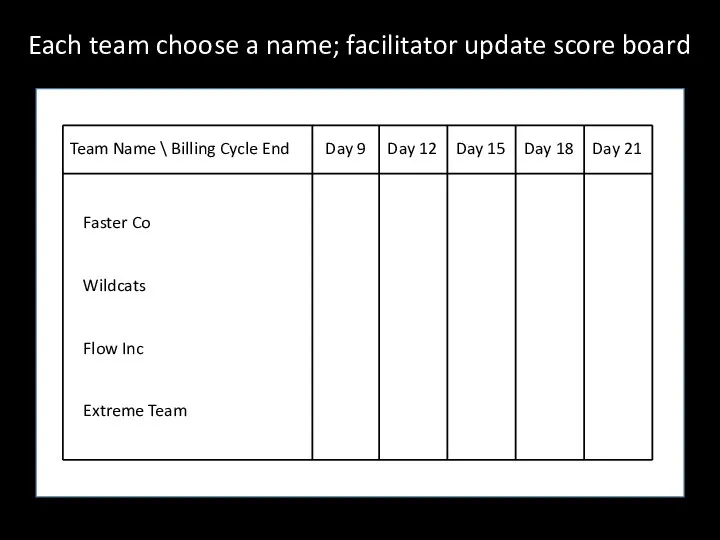
- 12. Prepare a visible scoreboard Team Name \ Billing Cycle End Day 9 Day 12 Day 15
- 13. Set up the Board Set up each board as shown. Place tickets S1 – S10 in
- 14. Lay out the remaining components Lay out the components of the game as shown. Ensure that
- 15. Game Instructions
- 16. Each team is a software company Your company makes a web application with a subscription-based revenue
- 17. You increase your application’s capabilities by deploying new features New features attract new subscribers Your company
- 18. There are five specific roles which we will now describe. Then you will nominate people to
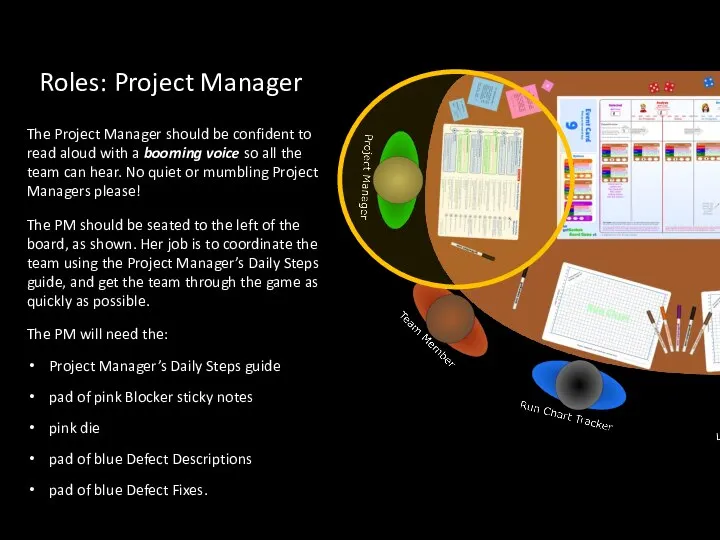
- 19. Roles: Project Manager The Project Manager should be confident to read aloud with a booming voice
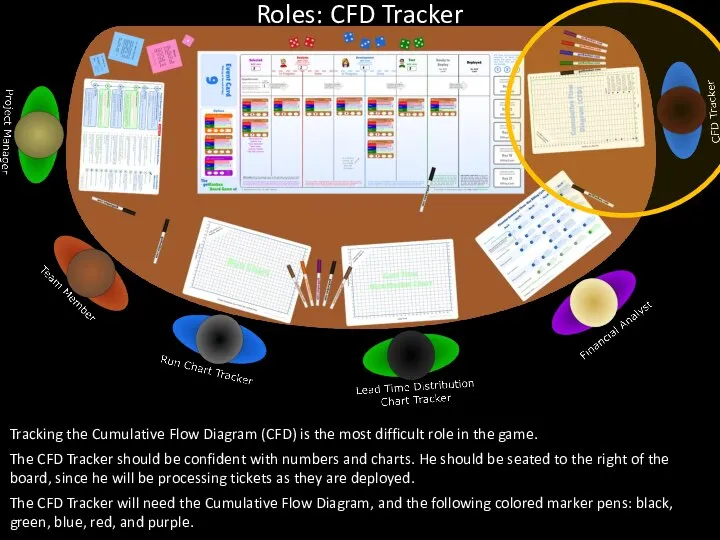
- 20. Tracking the Cumulative Flow Diagram (CFD) is the most difficult role in the game. The CFD
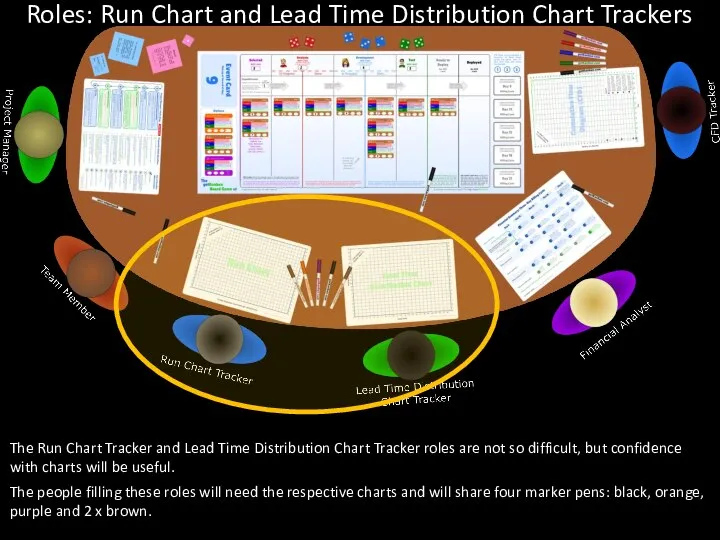
- 21. The Run Chart Tracker and Lead Time Distribution Chart Tracker roles are not so difficult, but
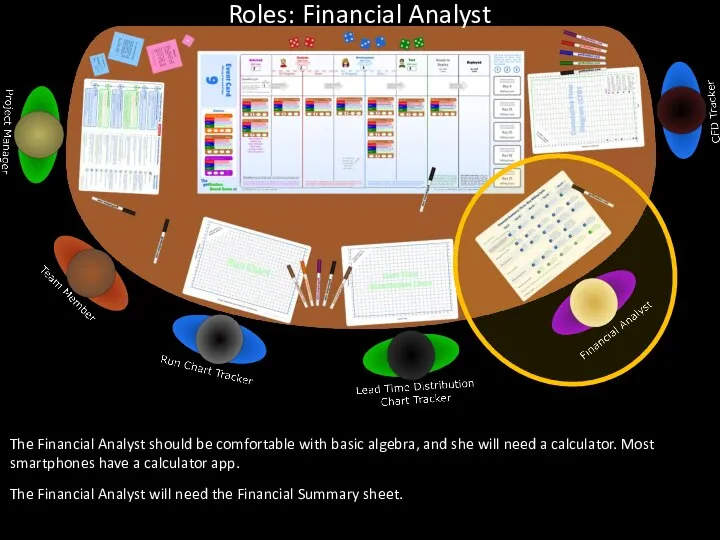
- 22. The Financial Analyst should be comfortable with basic algebra, and she will need a calculator. Most
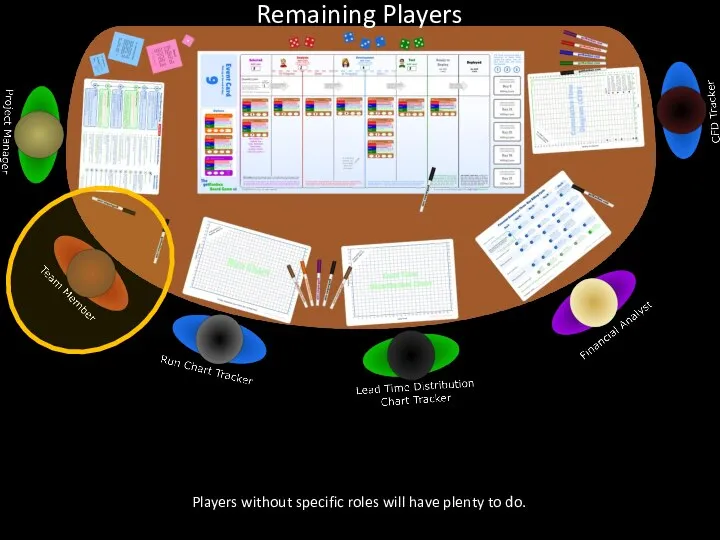
- 23. Players without specific roles will have plenty to do. Remaining Players
- 24. Players should be arranged around the board as indicated. It is best if all players are
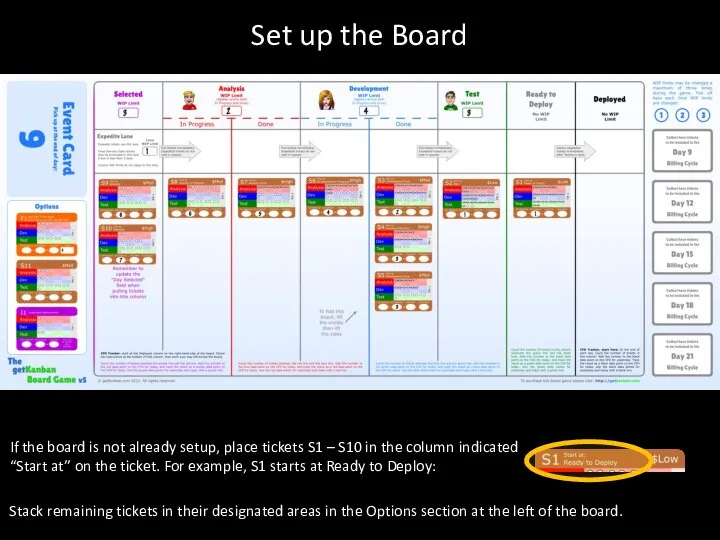
- 25. Set up the Board If the board is not already setup, place tickets S1 – S10
- 26. Each team choose a name; facilitator update score board Team Name \ Billing Cycle End Day
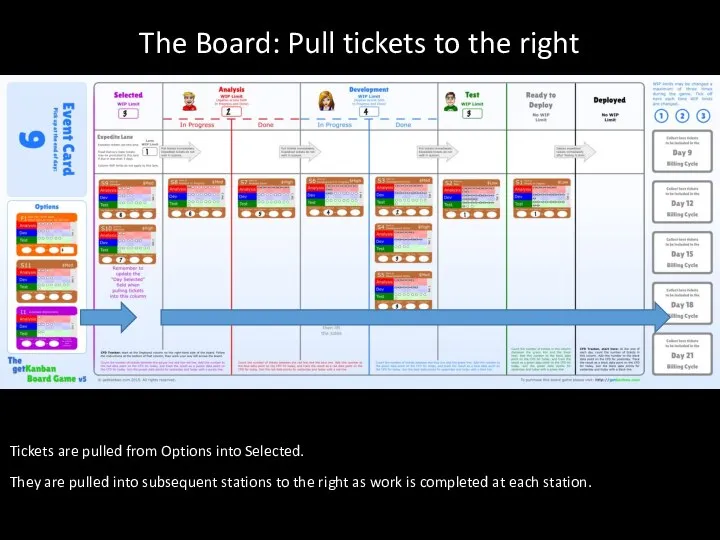
- 27. The Board: Pull tickets to the right Tickets are pulled from Options into Selected. They are
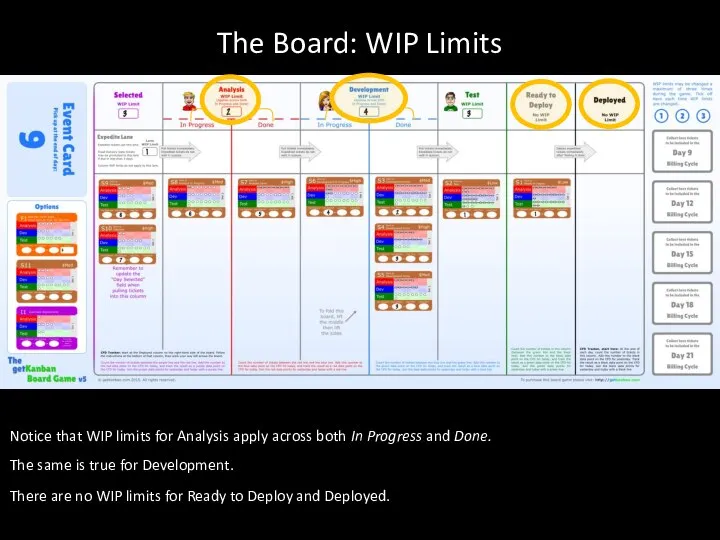
- 28. The Board: WIP Limits Notice that WIP limits for Analysis apply across both In Progress and
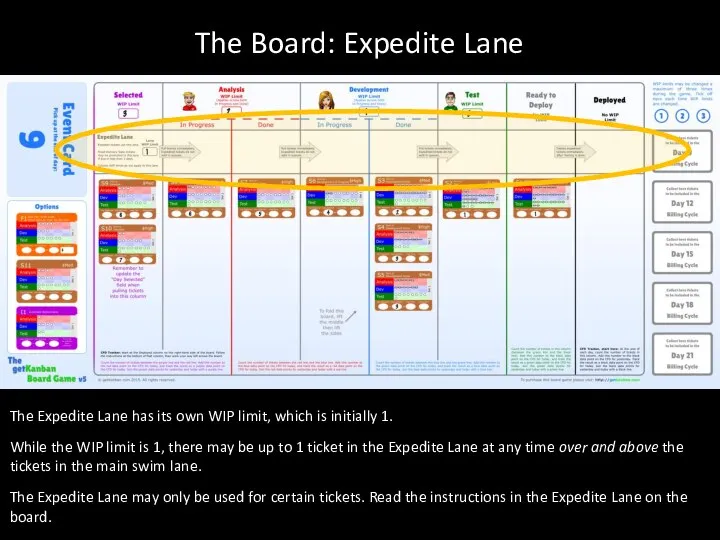
- 29. The Board: Expedite Lane The Expedite Lane has its own WIP limit, which is initially 1.
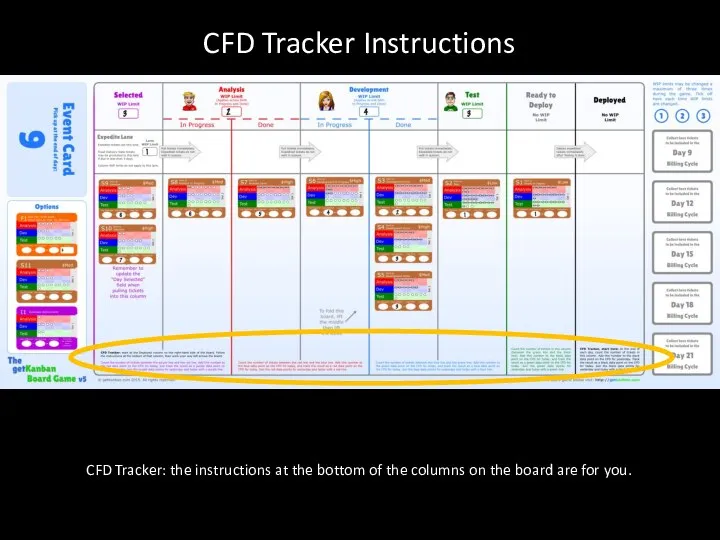
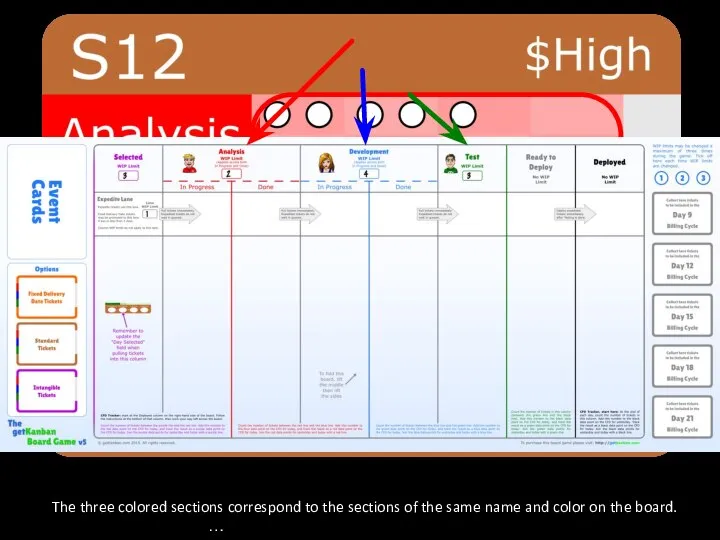
- 30. CFD Tracker Instructions CFD Tracker: the instructions at the bottom of the columns on the board
- 31. Each ticket has a number of white dots which represent work required to complete the ticket.
- 32. The three colored sections … correspond to the sections of the same name and color on
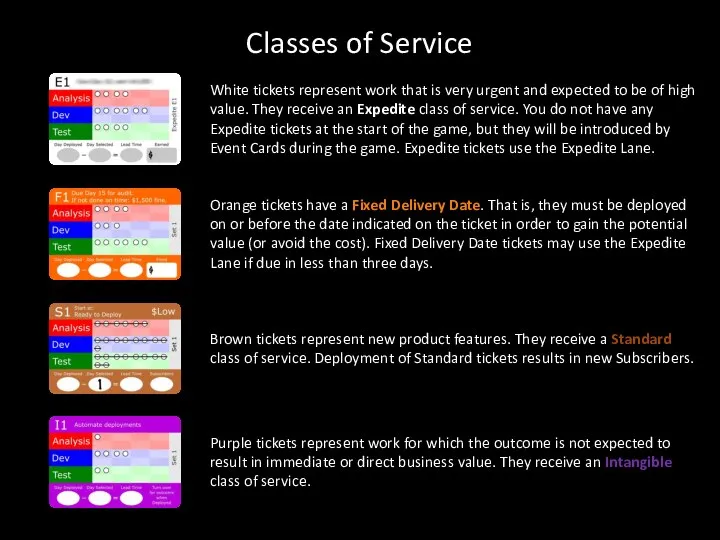
- 33. Classes of Service Brown tickets represent new product features. They receive a Standard class of service.
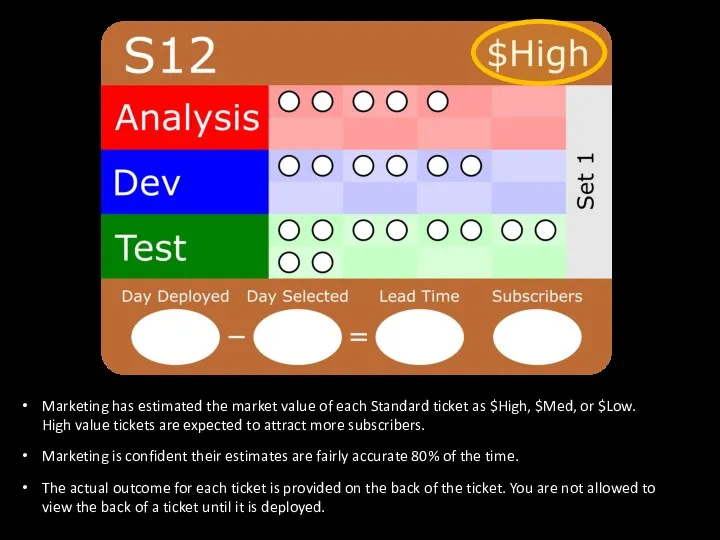
- 34. Marketing has estimated the market value of each Standard ticket as $High, $Med, or $Low. High
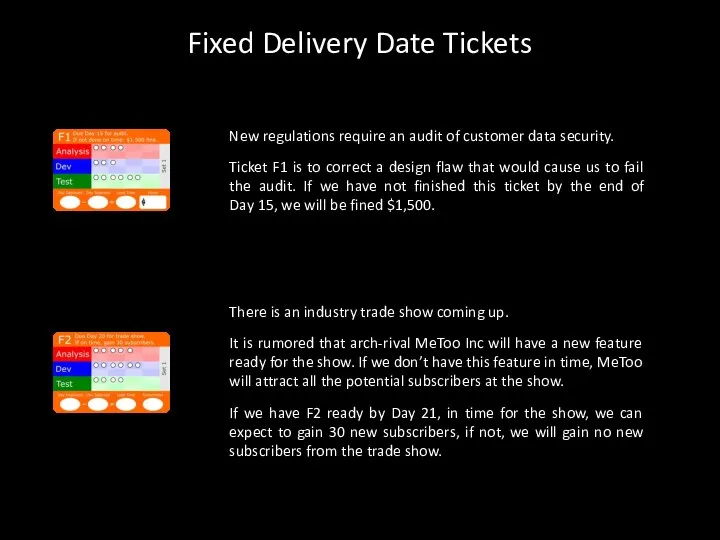
- 35. Fixed Delivery Date Tickets New regulations require an audit of customer data security. Ticket F1 is
- 36. We will use the three leftmost fields at the bottom of each ticket to calculate Lead
- 37. We play the game in simulated days from Day 9 to Day 21. Whenever a ticket
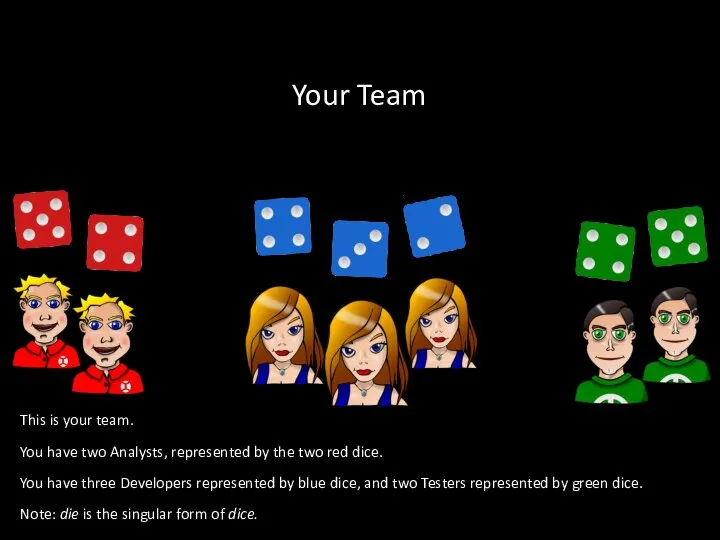
- 38. Your Team This is your team. You have two Analysts, represented by the two red dice.
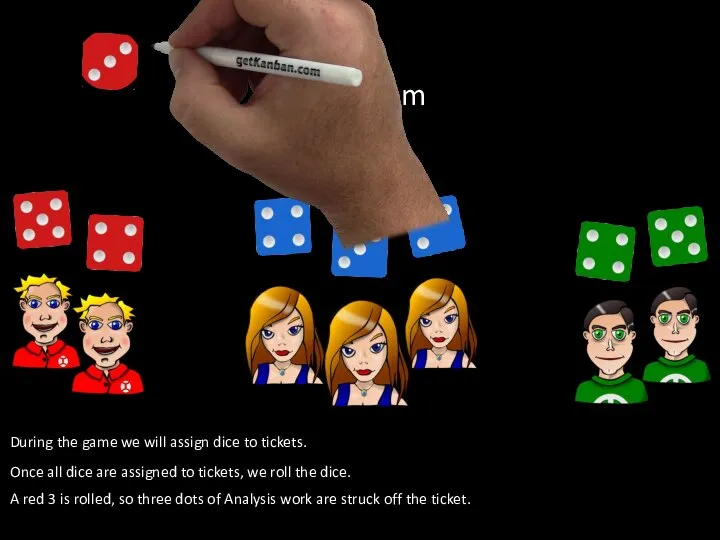
- 39. Your Team During the game we will assign dice to tickets. Once all dice are assigned
- 40. Dice may be assigned to work outside their specialization. In this case, an Analyst has been
- 41. CFD: Cumulative Flow Diagram Before we begin playing, we need to understand the data points on
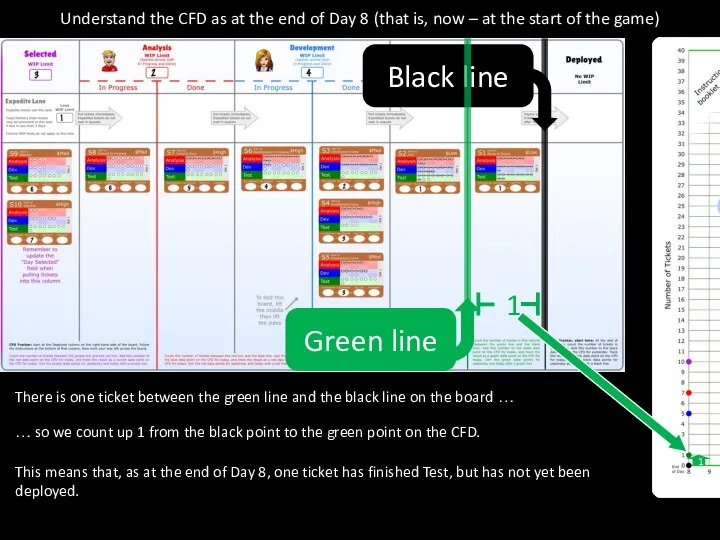
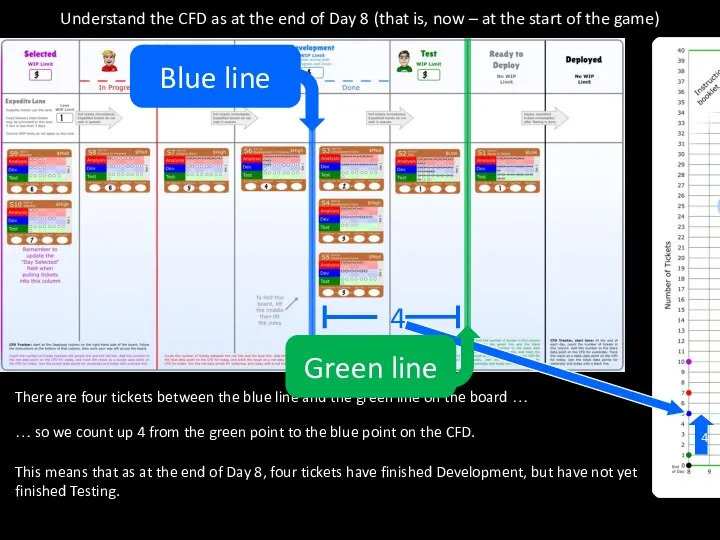
- 42. Understand the CFD as at the end of Day 8 (that is, now – at the
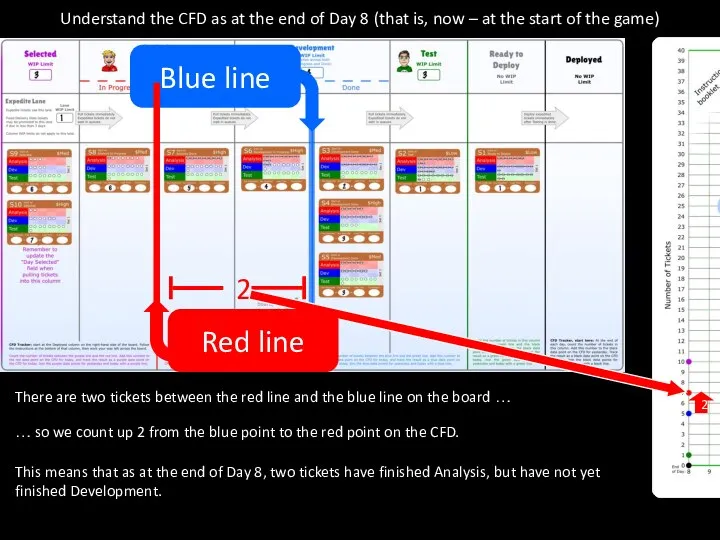
- 43. Understand the CFD as at the end of Day 8 (that is, now – at the
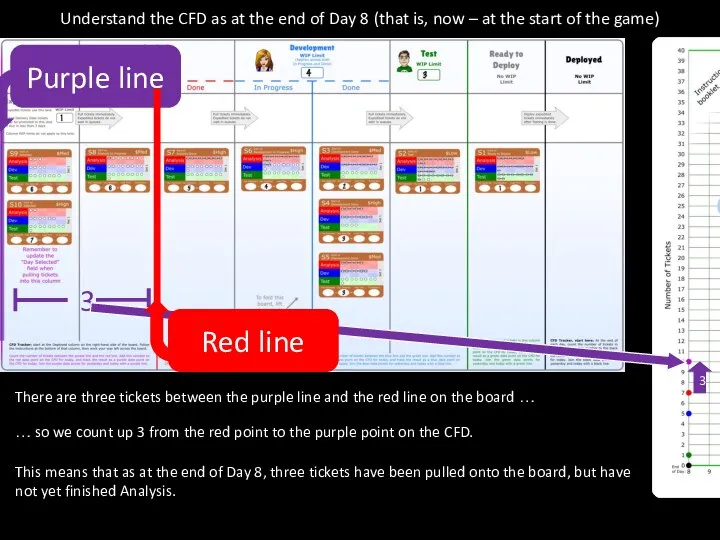
- 44. Understand the CFD as at the end of Day 8 (that is, now – at the
- 45. Understand the CFD as at the end of Day 8 (that is, now – at the
- 46. Understand the CFD as at the end of Day 8 (that is, now – at the
- 47. Day 9 We are now going to step through Day 9. All of the decisions have
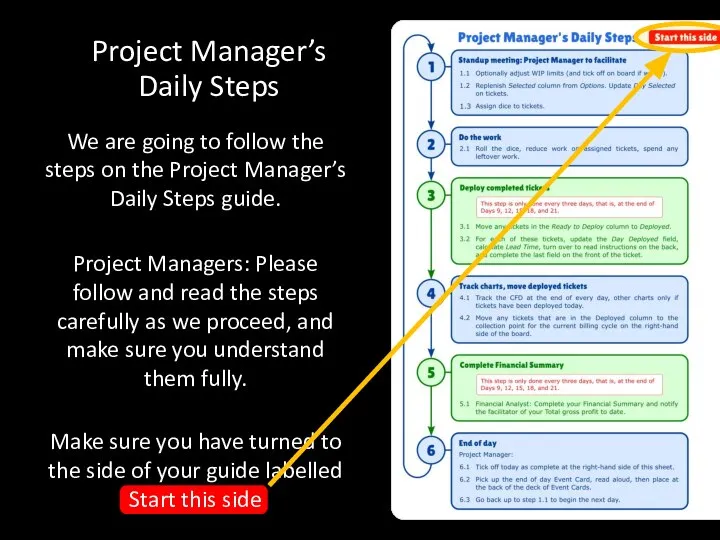
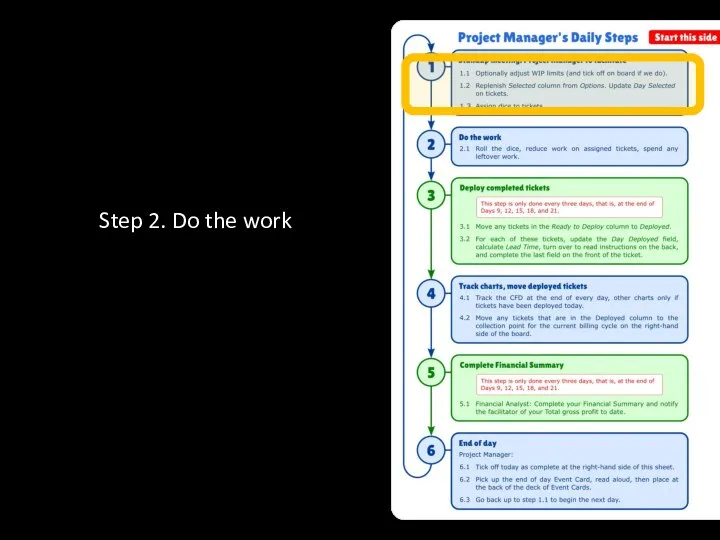
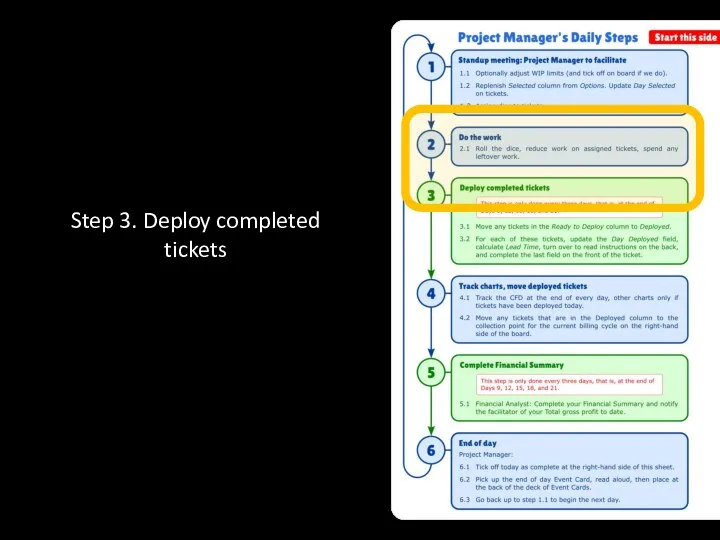
- 48. Project Manager’s Daily Steps We are going to follow the steps on the Project Manager’s Daily
- 49. Step 1. Standup meeting: Project Manager to facilitate
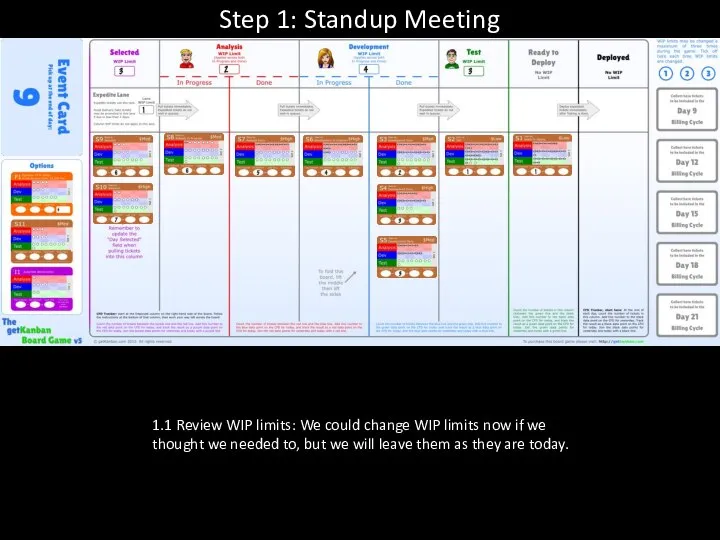
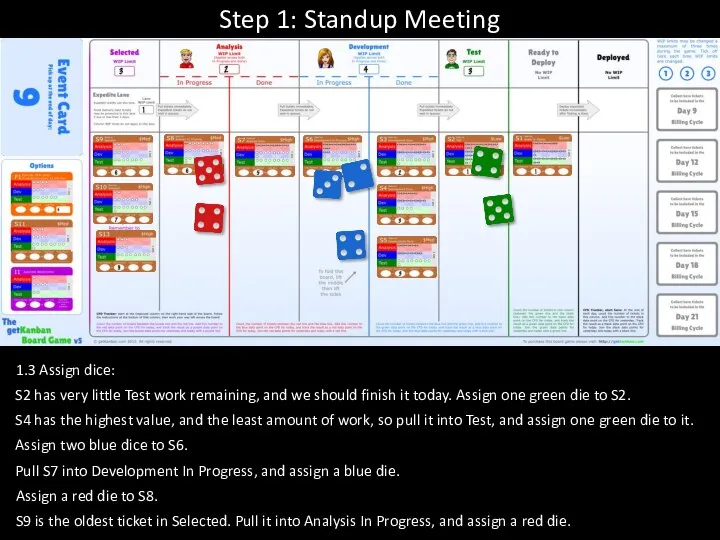
- 50. Step 1: Standup Meeting 1.1 Review WIP limits: We could change WIP limits now if we
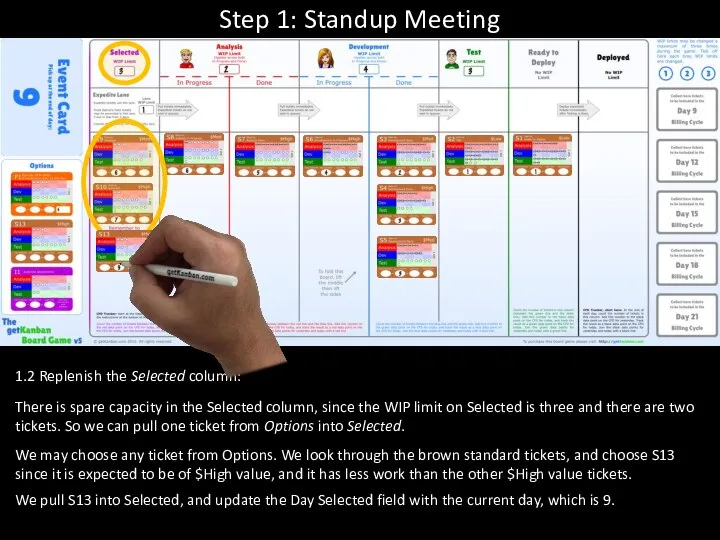
- 51. Step 1: Standup Meeting 1.2 Replenish the Selected column: There is spare capacity in the Selected
- 52. Step 1: Standup Meeting S2 has very little Test work remaining, and we should finish it
- 53. Step 2. Do the work
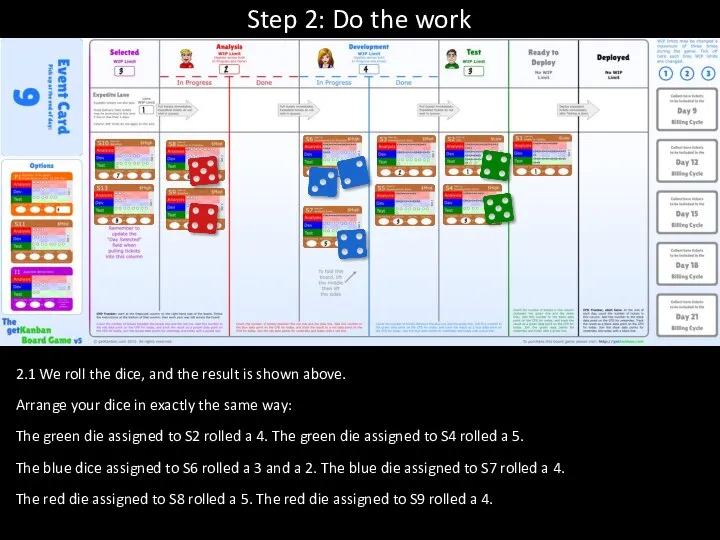
- 54. Step 2: Do the work 2.1 We roll the dice, and the result is shown above.
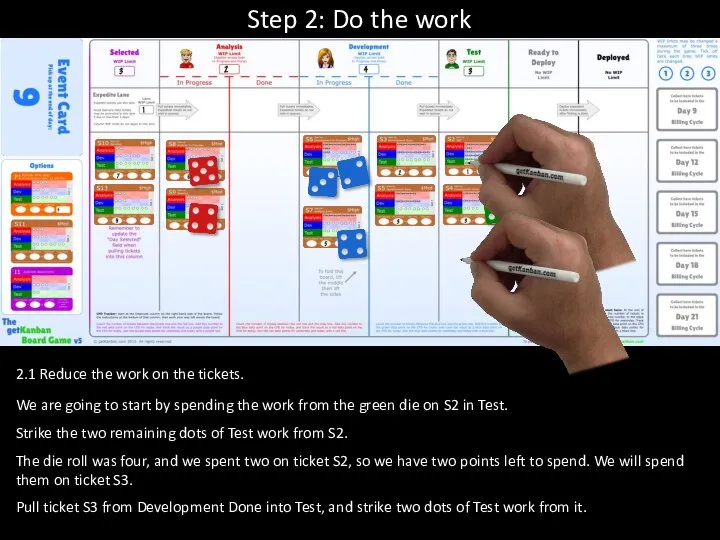
- 55. Step 2: Do the work 2.1 Reduce the work on the tickets. We are going to
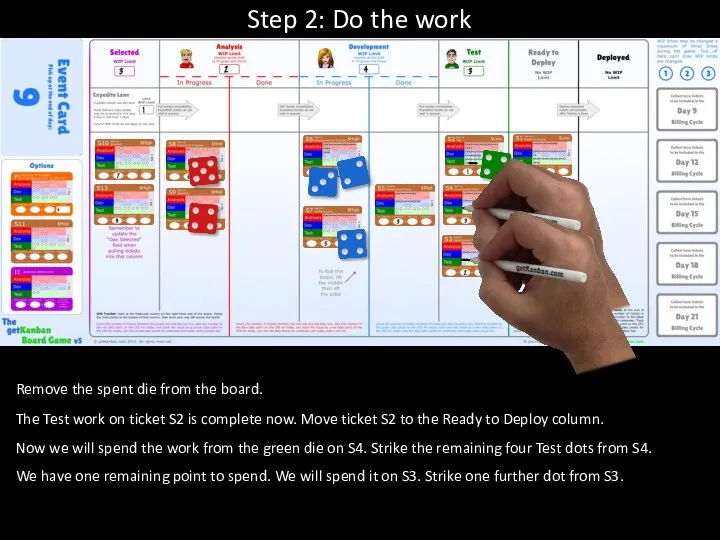
- 56. Step 2: Do the work Remove the spent die from the board. The Test work on
- 57. Step 2: Do the work Remove the spent die from the board. The Test work on
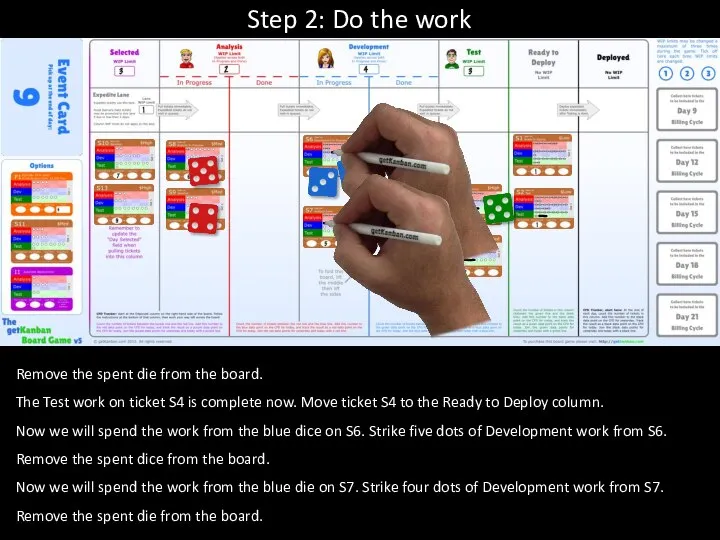
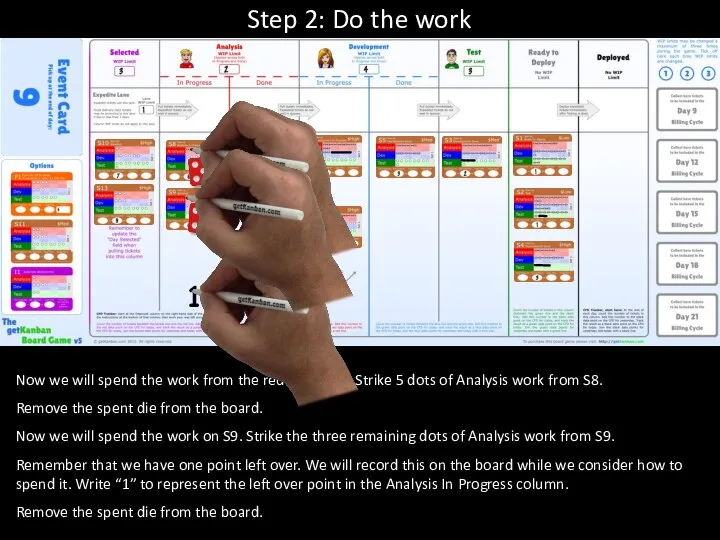
- 58. Step 2: Do the work Now we will spend the work from the red die on
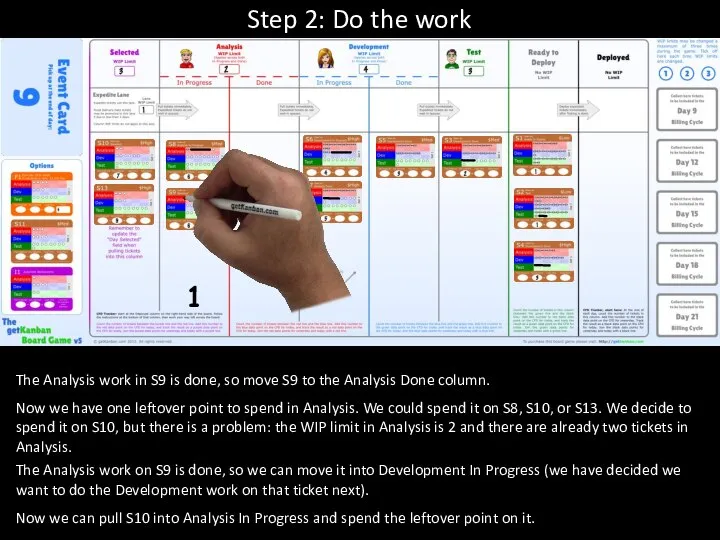
- 59. Step 2: Do the work 1 The Analysis work in S9 is done, so move S9
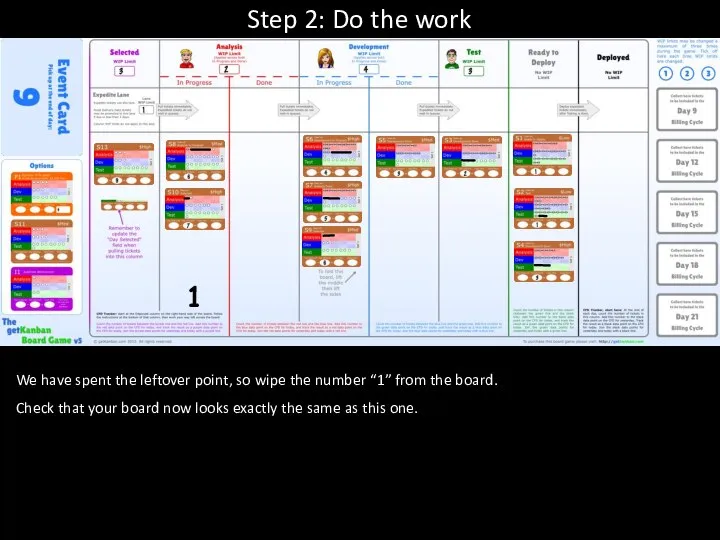
- 60. Step 2: Do the work 1 We have spent the leftover point, so wipe the number
- 61. All dice must be assigned before any dice are rolled. Once assigned, dice may be rolled
- 62. Tickets may be selected from Options in any order you wish. Tickets may be pulled across
- 63. We are about to go to Step 3 in the Project Manager’s Daily Steps guide. Step
- 64. Step 3. Deploy completed tickets
- 65. Step 3: Deploy completed tickets It is now the end of Day 9, and therefore the
- 66. Step 3: Deploy completed tickets For each deployed ticket, update the Day Deployed field with the
- 67. Step 3: Deploy completed tickets For each deployed ticket, calculate Lead Time using the formula on
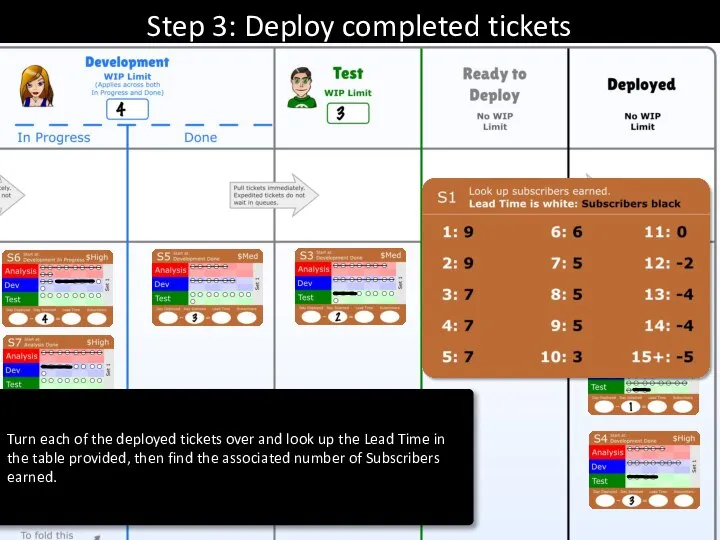
- 68. Step 3: Deploy completed tickets Turn each of the deployed tickets over and look up the
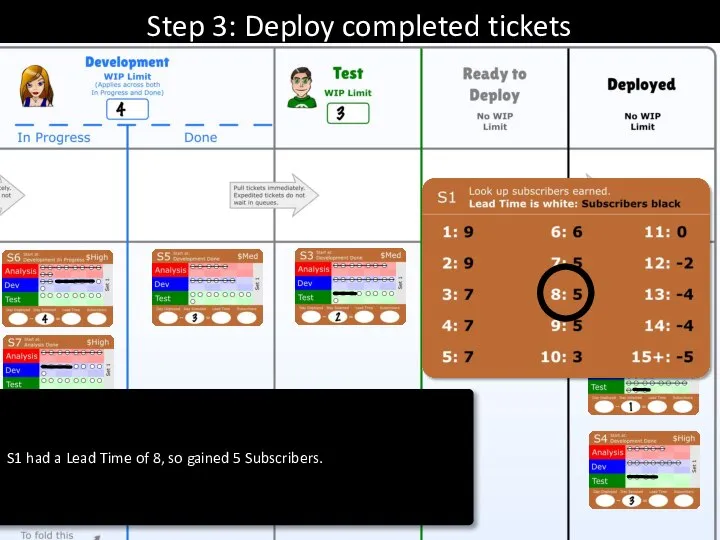
- 69. Step 3: Deploy completed tickets S1 had a Lead Time of 8, so gained 5 Subscribers.
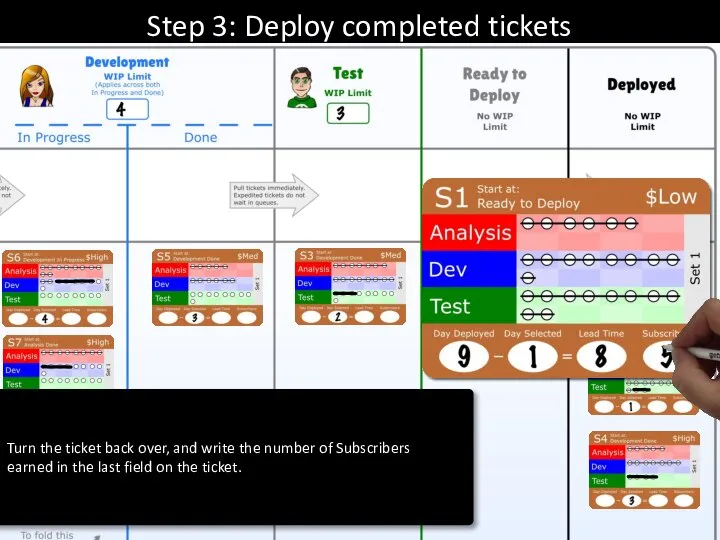
- 70. Step 3: Deploy completed tickets Turn the ticket back over, and write the number of Subscribers
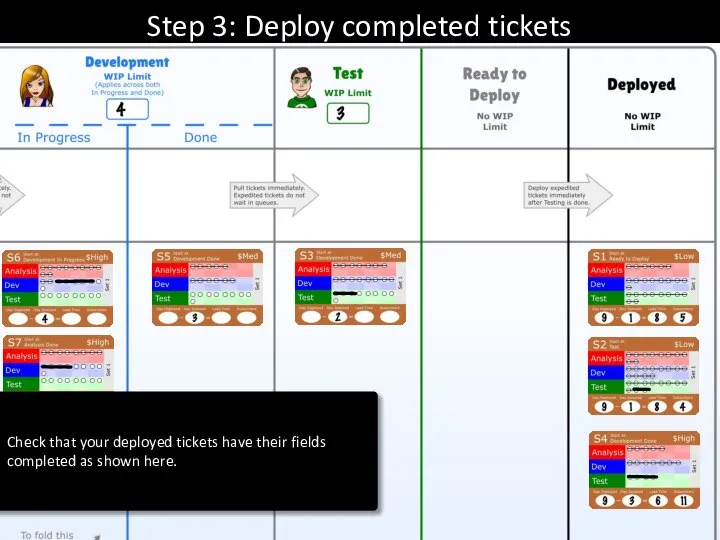
- 71. Step 3: Deploy completed tickets Check that your deployed tickets have their fields completed as shown
- 72. Quickly examine the backs of the tickets we just deployed to see the relationship between Lead
- 73. Step 4. Track charts, move deployed tickets
- 74. First we will track the CFD
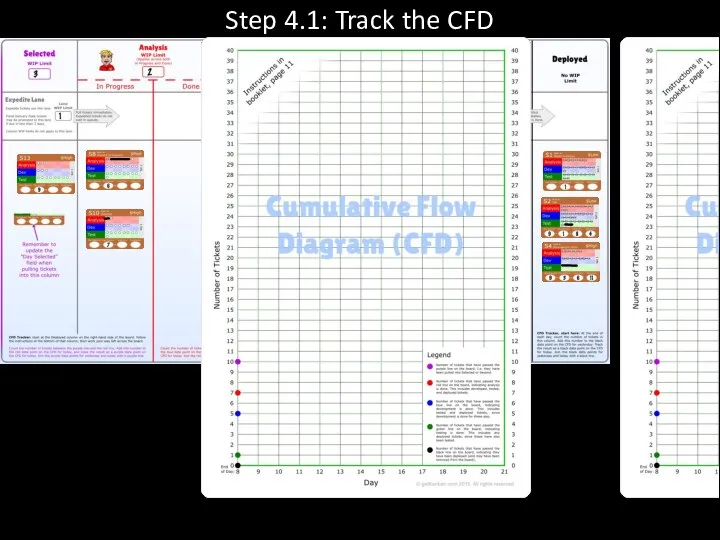
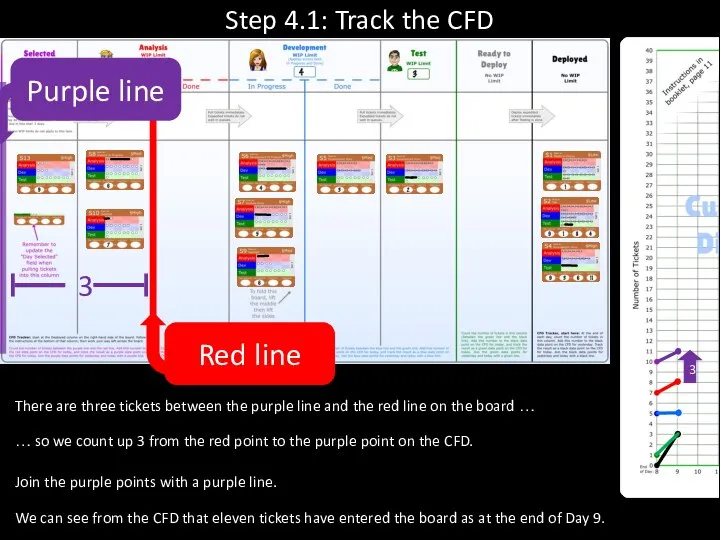
- 75. Step 4.1: Track the CFD
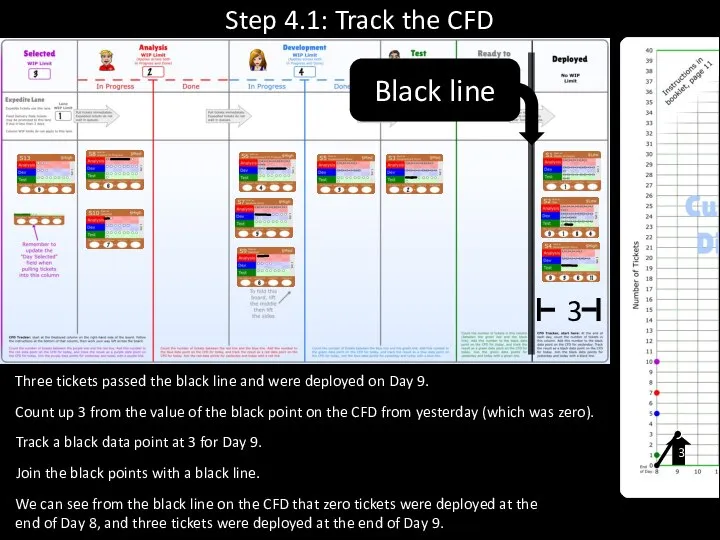
- 76. Step 4.1: Track the CFD Three tickets passed the black line and were deployed on Day
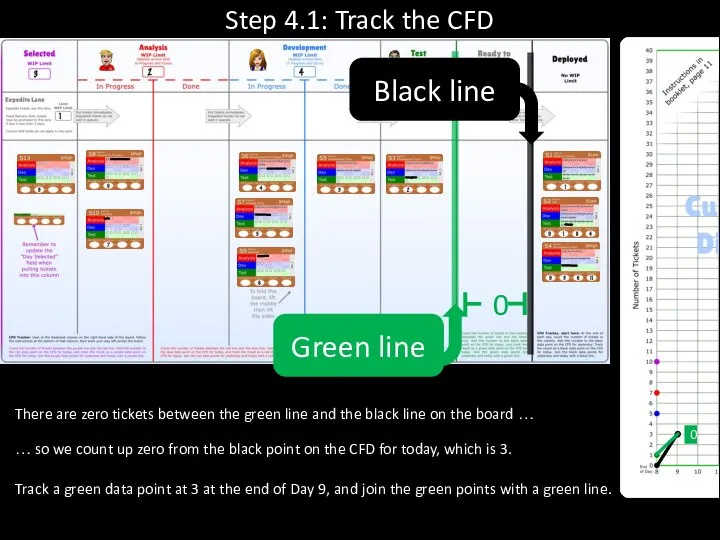
- 77. Step 4.1: Track the CFD There are zero tickets between the green line and the black
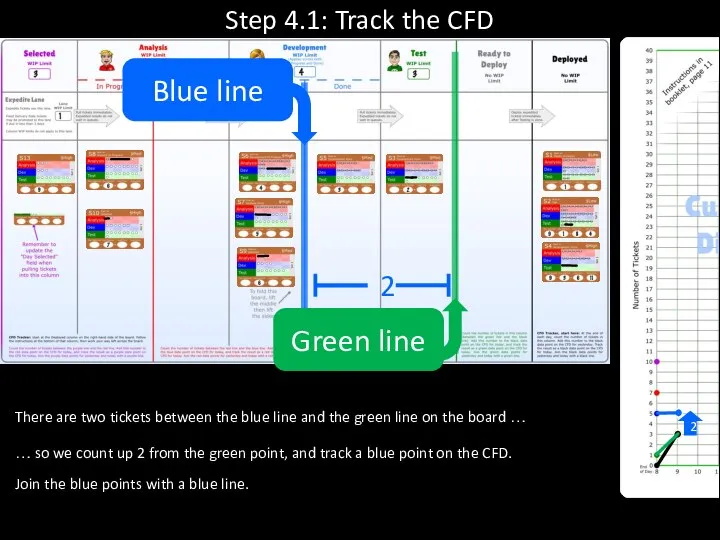
- 78. Step 4.1: Track the CFD There are two tickets between the blue line and the green
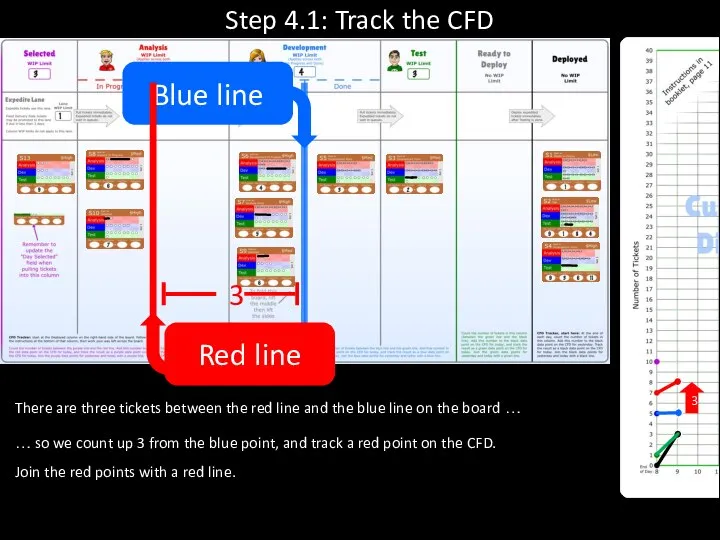
- 79. Step 4.1: Track the CFD There are three tickets between the red line and the blue
- 80. Step 4.1: Track the CFD There are three tickets between the purple line and the red
- 81. Notice that when we track the black line we add the number of tickets deployed today
- 82. We track the CFD every day
- 83. Now we will track the Run Chart
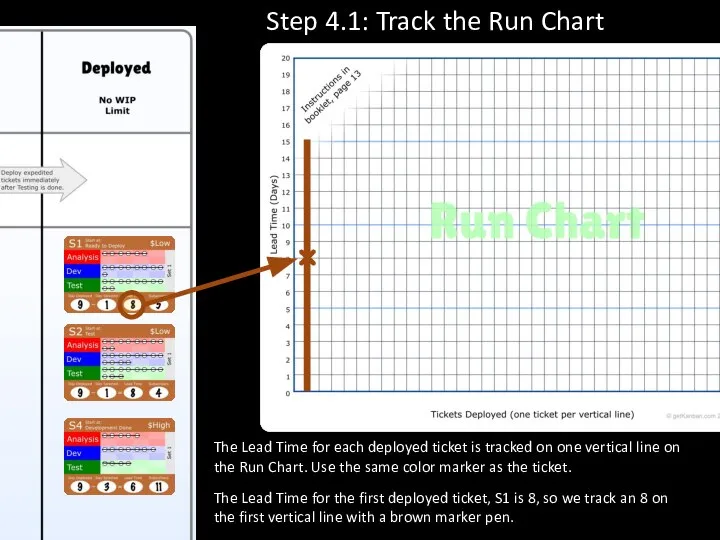
- 84. The Lead Time for each deployed ticket is tracked on one vertical line on the Run
- 85. The Lead Time for the second deployed ticket, S2 is 8, so we track an 8
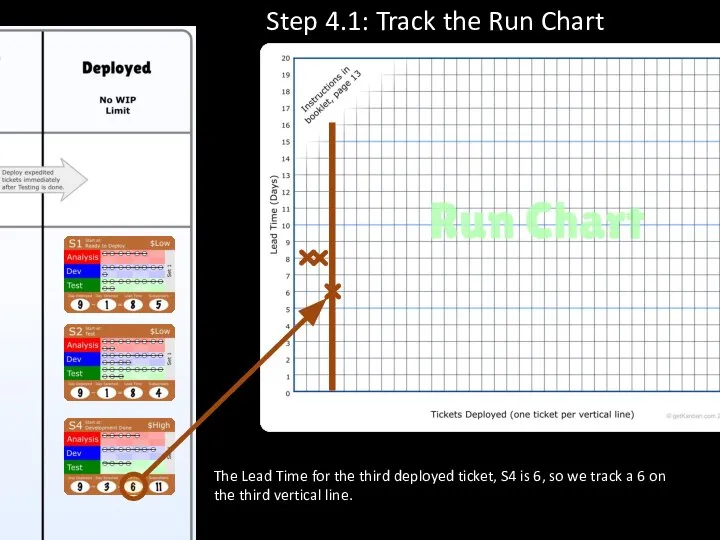
- 86. The Lead Time for the third deployed ticket, S4 is 6, so we track a 6
- 87. We only track the Run Chart when tickets have been deployed (eg: at the end of
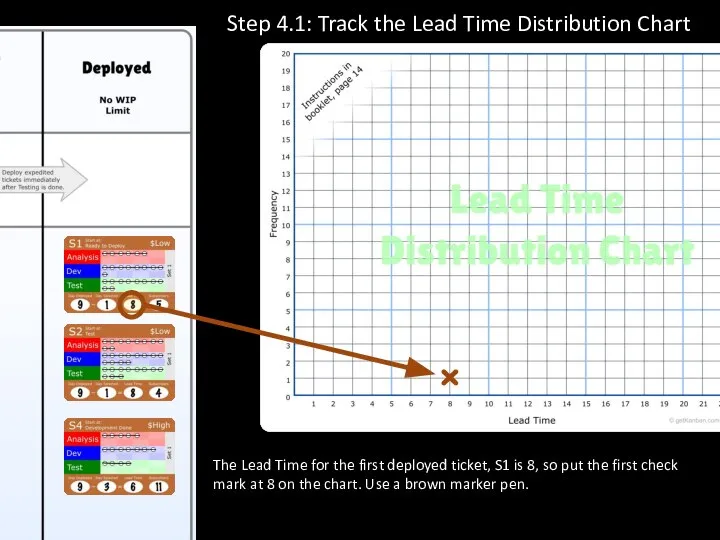
- 88. Now we will track the Lead Time Distribution Chart
- 89. On this chart the vertical lines are different, they represent Lead Times, not tickets. For each
- 90. The Lead Time for the first deployed ticket, S1 is 8, so put the first check
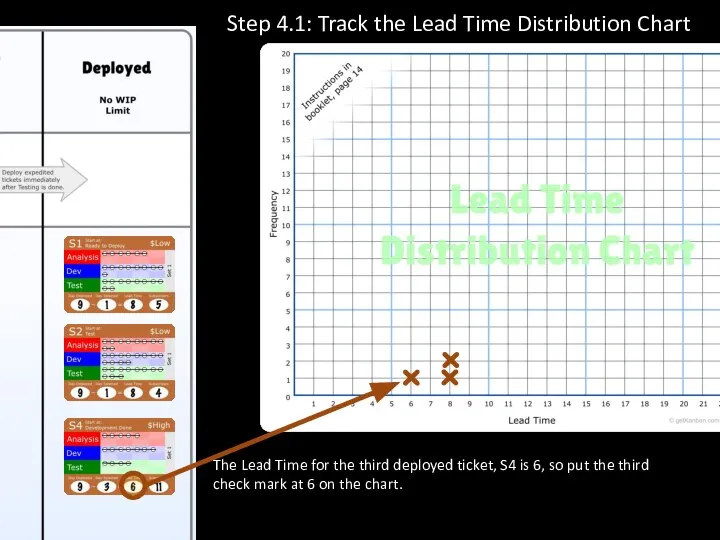
- 91. The Lead Time for the second deployed ticket, S2 is 8, so put the second check
- 92. The Lead Time for the third deployed ticket, S4 is 6, so put the third check
- 93. We only track the Lead Time Distribution Chart when tickets have been deployed (eg: at the
- 94. Now we will move the deployed tickets to the collection point for the current billing cycle
- 95. The current billing cycle ends today, Day 9, so move the deployed tickets to the collection
- 96. Step 5. Complete Financial Summary
- 97. Add up the number of subscribers gained from tickets deployed in the current billing cycle Step
- 98. Step 6. End of day
- 99. Step 6.1: Tick off day as complete
- 100. Step 6.2: Read Event Card 1 “Advanced” discussion points are optional. Your facilitator will tell you
- 101. Consult the FAQ on the same sheet as the Project Manager’s Daily Steps guide if you
- 102. Step 6.1: Next day It is now the beginning of Day 10, and it’s your turn
- 103. Optional: Bonus The first team to complete Day 15 will receive an in-game bonus cash prize
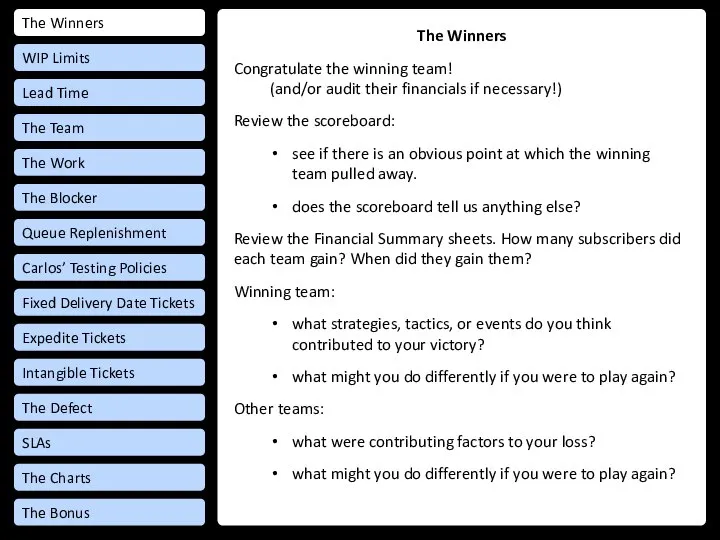
- 104. End of Game Continue to debrief
- 105. The Winners Lead Time The Team The Work The Blocker Queue Replenishment Carlos’ Testing Policies Fixed
- 106. WIP Limits Did you ever roll more points on the dice than you were able to
- 107. Lead Time Is the relationship between Lead Time and the number of subscribers gained realistic (as
- 108. The Team What sorts of things were you discussing in your stand-up meetings? How did you
- 109. The Work Did you analyze the Options to select which tickets to pull, and did you
- 110. The Blocker How long did it take teams to resolve the blocker? Was there high variability
- 111. Queue Replenishment Is daily queue replenishment always the optimal choice? Why or why not? The Winners
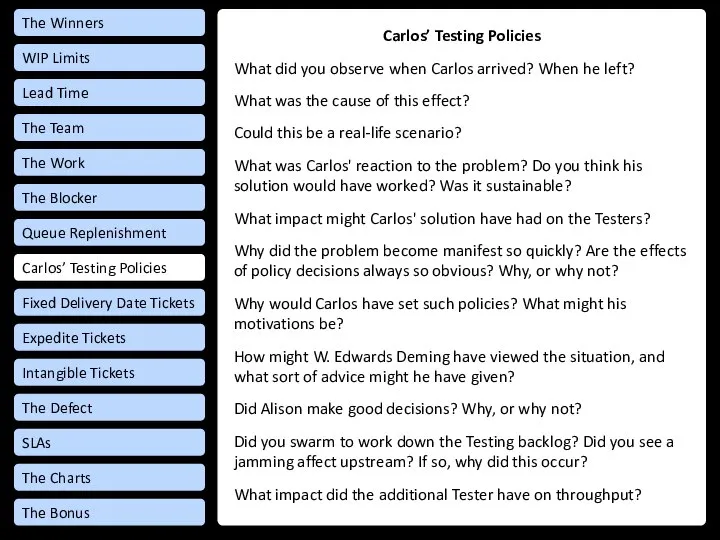
- 112. Carlos’ Testing Policies What did you observe when Carlos arrived? When he left? What was the
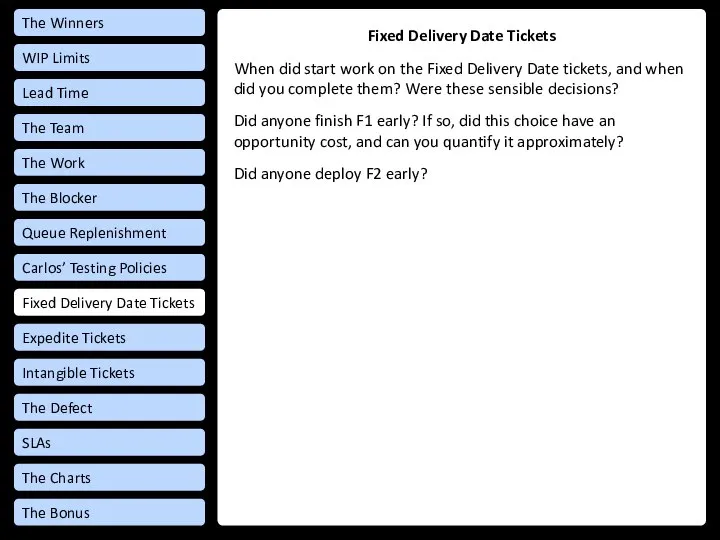
- 113. Fixed Delivery Date Tickets When did start work on the Fixed Delivery Date tickets, and when
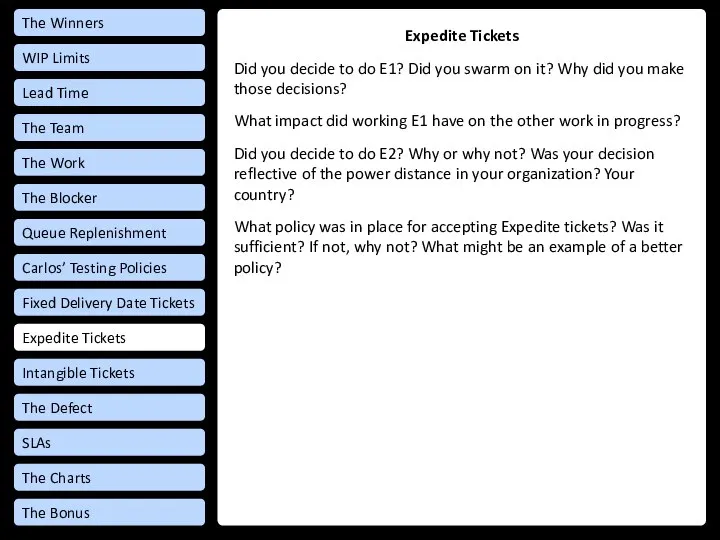
- 114. Expedite Tickets Did you decide to do E1? Did you swarm on it? Why did you
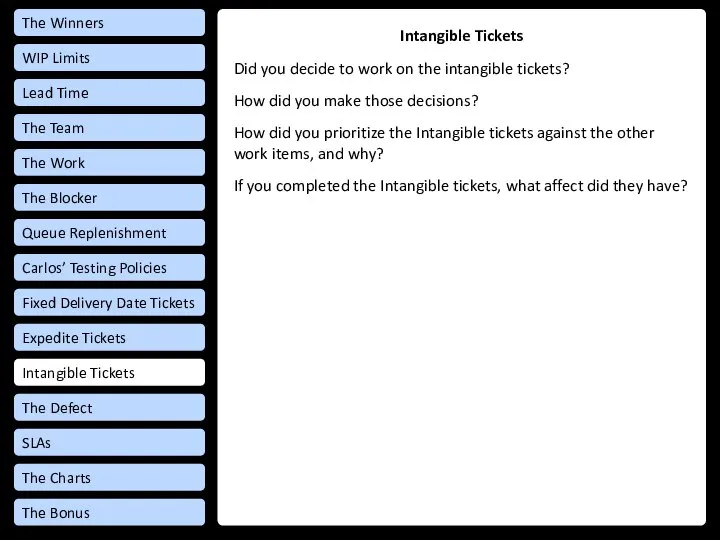
- 115. Intangible Tickets Did you decide to work on the intangible tickets? How did you make those
- 116. The Defect What impact did the defect have? What priority did you give the defect fix,
- 117. Service Level Agreements What SLAs would you choose for Standard class of service tickets? What would
- 118. The Charts What stories do your charts tell, can you see the impact of the events
- 120. Скачать презентацию
Facilitator’s Guide
Hello Facilitator
Before facilitating the game with a group you should
Facilitator’s Guide
Hello Facilitator
Before facilitating the game with a group you should
Teams
Facilitator’s Guide
The game is designed to be played by a team
Teams
Facilitator’s Guide
The game is designed to be played by a team
Approach
Facilitator’s Guide
Set up kits
Ensure that any dry-erase markings left on the
Approach
Facilitator’s Guide
Set up kits
Ensure that any dry-erase markings left on the
Approach
Facilitator’s Guide
Facilitation tips
Make sure you are familiar with the Frequently Asked
Approach
Facilitator’s Guide
Facilitation tips
Make sure you are familiar with the Frequently Asked
Caveats
Facilitator’s Guide
The Kanban board used is an example board, not “the
Caveats
Facilitator’s Guide
The Kanban board used is an example board, not “the

Game Kit Contents: Bags
Facilitator’s Guide
One game kit includes one document sleeve,
Game Kit Contents: Bags
Facilitator’s Guide
One game kit includes one document sleeve,
Game Kit Contents: Document Sleeve
Facilitator’s Guide
The document sleeve contains: game board,
Game Kit Contents: Document Sleeve
Facilitator’s Guide
The document sleeve contains: game board,
Game Kit Contents: Clear Cinch Bag
Facilitator’s Guide
The clear cinch bag contains:
13
Game Kit Contents: Clear Cinch Bag
Facilitator’s Guide
The clear cinch bag contains:
13
Game Kit Contents: Small cloth bag
Facilitator’s Guide
The small cloth bag contains:
Tickets:
Game Kit Contents: Small cloth bag
Facilitator’s Guide
The small cloth bag contains:
Tickets:

Setup
Setup
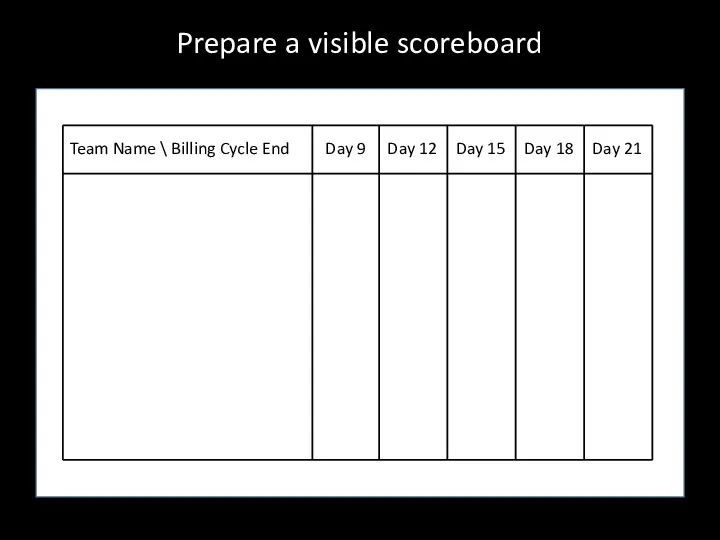
Prepare a visible scoreboard
Team Name \ Billing Cycle End
Day 9
Day 12
Day
Prepare a visible scoreboard
Team Name \ Billing Cycle End
Day 9
Day 12
Day
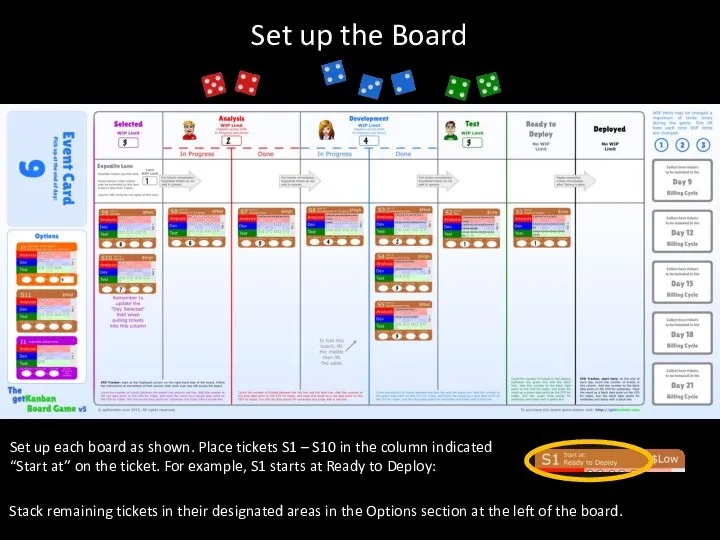
Set up the Board
Set up each board as shown. Place tickets
Set up the Board
Set up each board as shown. Place tickets
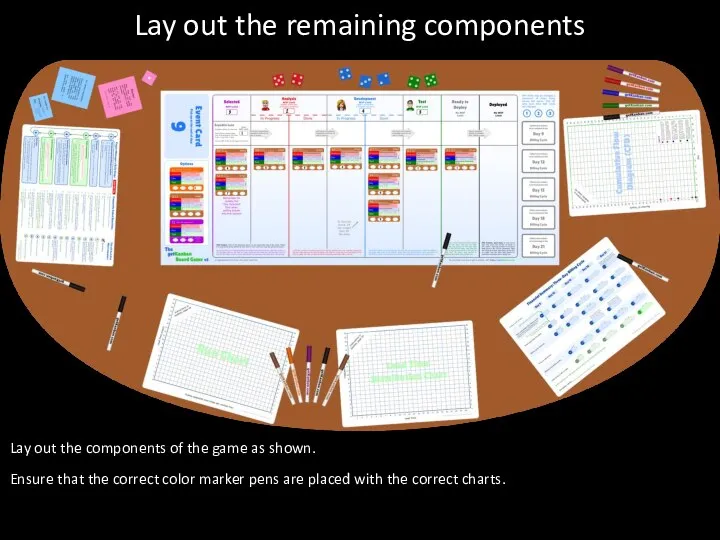
Lay out the remaining components
Lay out the components of the game
Lay out the remaining components
Lay out the components of the game
Game Instructions
Game Instructions
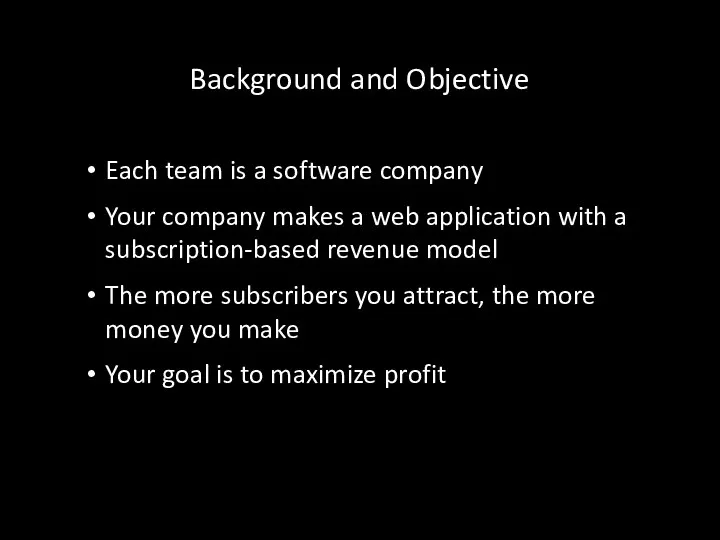
Each team is a software company
Your company makes a web application
Each team is a software company
Your company makes a web application
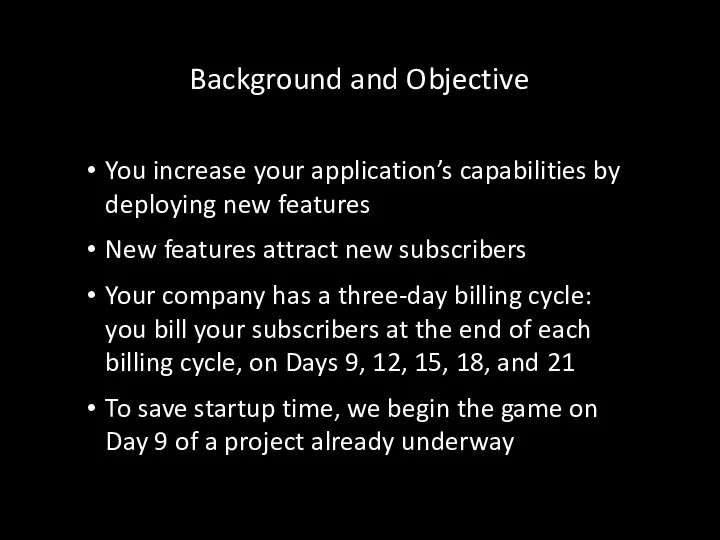
You increase your application’s capabilities by deploying new features
New features attract
You increase your application’s capabilities by deploying new features
New features attract
There are five specific roles which we will now describe.
Then you
There are five specific roles which we will now describe.
Then you
Roles: Project Manager
The Project Manager should be confident to read aloud
Roles: Project Manager
The Project Manager should be confident to read aloud
Tracking the Cumulative Flow Diagram (CFD) is the most difficult role
Tracking the Cumulative Flow Diagram (CFD) is the most difficult role
The Run Chart Tracker and Lead Time Distribution Chart Tracker roles
The Run Chart Tracker and Lead Time Distribution Chart Tracker roles
The Financial Analyst should be comfortable with basic algebra, and she
The Financial Analyst should be comfortable with basic algebra, and she
Players without specific roles will have plenty to do.
Remaining Players
Players without specific roles will have plenty to do.
Remaining Players
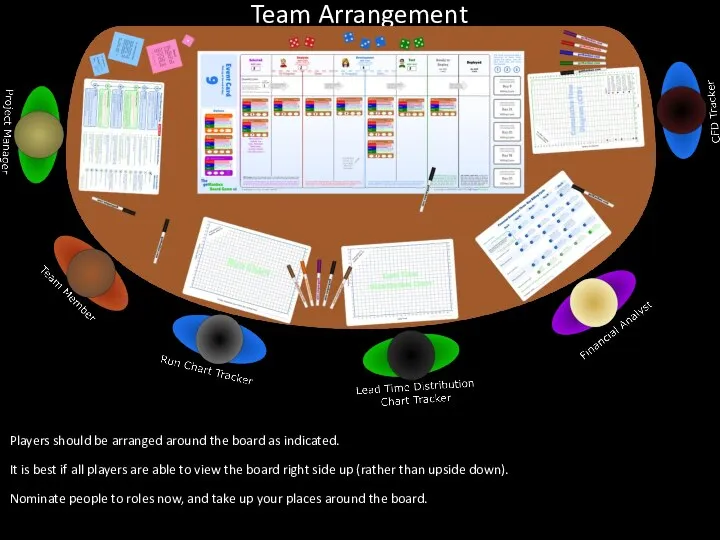
Players should be arranged around the board as indicated.
It is best
Players should be arranged around the board as indicated.
It is best
Set up the Board
If the board is not already setup, place
Set up the Board
If the board is not already setup, place
Each team choose a name; facilitator update score board
Team Name \
Each team choose a name; facilitator update score board
Team Name \
The Board: Pull tickets to the right
Tickets are pulled from Options
The Board: Pull tickets to the right
Tickets are pulled from Options
The Board: WIP Limits
Notice that WIP limits for Analysis apply across
The Board: WIP Limits
Notice that WIP limits for Analysis apply across
The Board: Expedite Lane
The Expedite Lane has its own WIP limit,
The Board: Expedite Lane
The Expedite Lane has its own WIP limit,
CFD Tracker Instructions
CFD Tracker: the instructions at the bottom of the
CFD Tracker Instructions
CFD Tracker: the instructions at the bottom of the
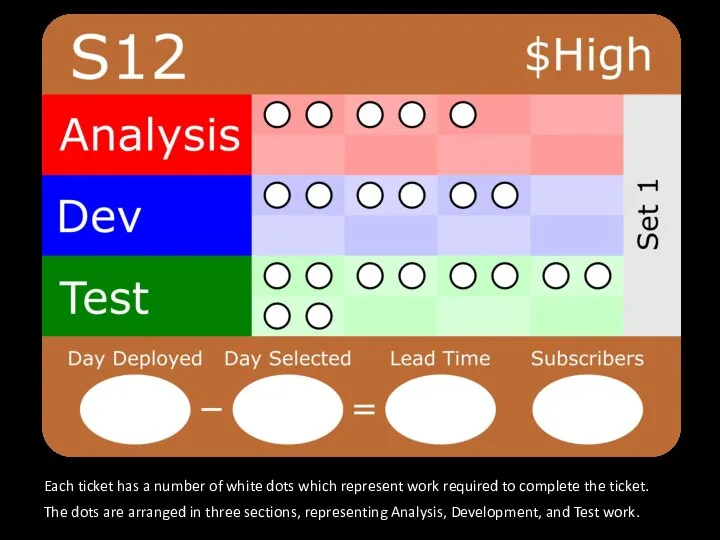
Each ticket has a number of white dots which represent work
Each ticket has a number of white dots which represent work
The three colored sections …
correspond to the sections of the
The three colored sections …
correspond to the sections of the
Classes of Service
Brown tickets represent new product features. They receive a
Classes of Service
Brown tickets represent new product features. They receive a
Marketing has estimated the market value of each Standard ticket as
Marketing has estimated the market value of each Standard ticket as
Fixed Delivery Date Tickets
New regulations require an audit of customer data
Fixed Delivery Date Tickets
New regulations require an audit of customer data
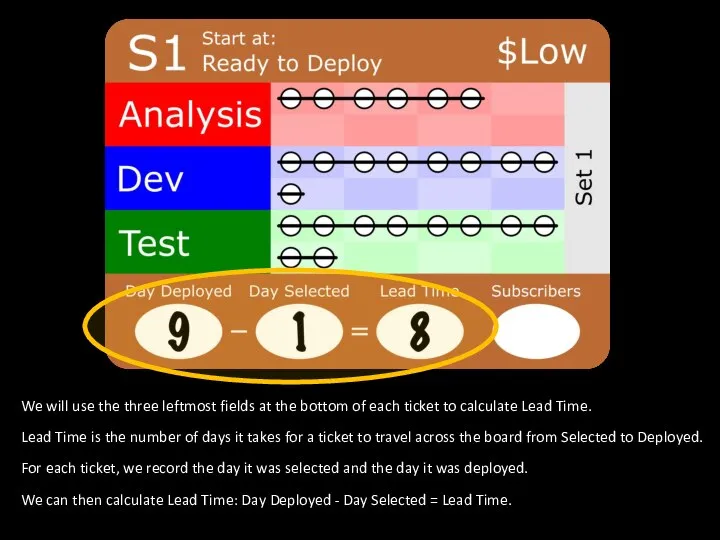
We will use the three leftmost fields at the bottom of
We will use the three leftmost fields at the bottom of
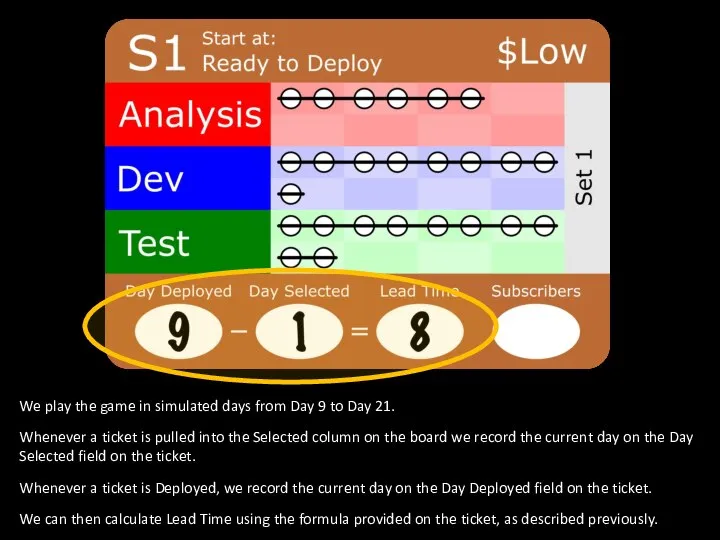
We play the game in simulated days from Day 9 to
We play the game in simulated days from Day 9 to
Your Team
This is your team.
You have two Analysts, represented by the
Your Team
This is your team.
You have two Analysts, represented by the
Your Team
During the game we will assign dice to tickets.
Once all
Your Team
During the game we will assign dice to tickets.
Once all
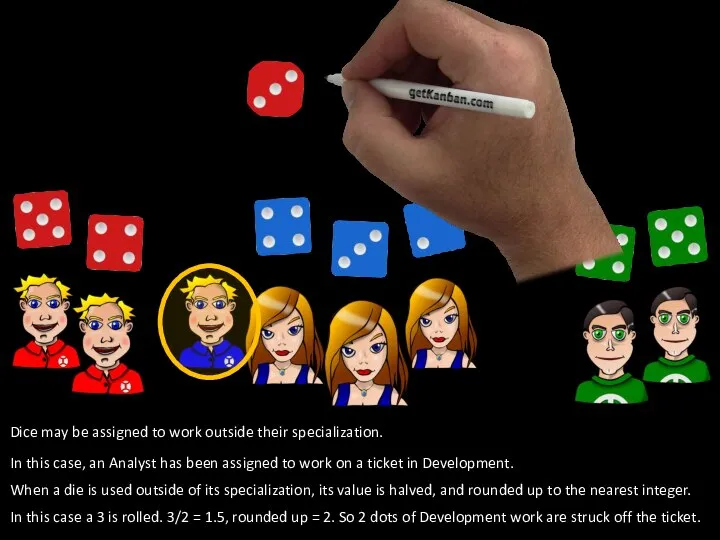
Dice may be assigned to work outside their specialization.
In this case,
Dice may be assigned to work outside their specialization.
In this case,
CFD: Cumulative Flow Diagram
Before we begin playing, we need to understand
CFD: Cumulative Flow Diagram
Before we begin playing, we need to understand
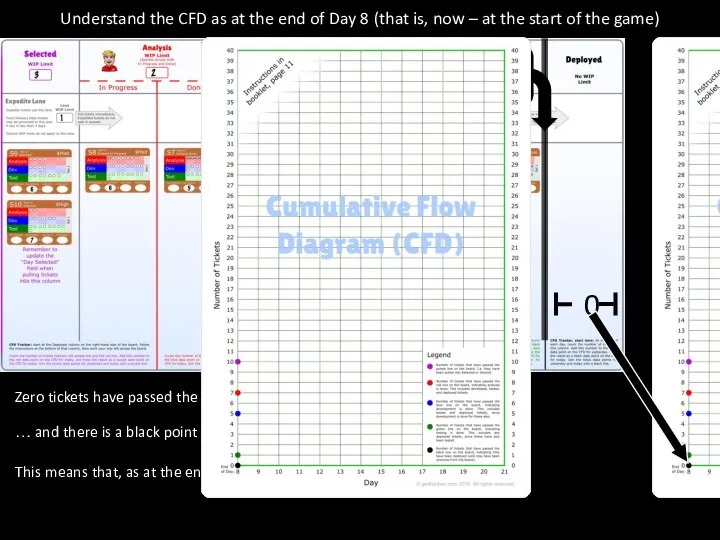
Understand the CFD as at the end of Day 8 (that
Understand the CFD as at the end of Day 8 (that
Understand the CFD as at the end of Day 8 (that
Understand the CFD as at the end of Day 8 (that
Understand the CFD as at the end of Day 8 (that
Understand the CFD as at the end of Day 8 (that
Understand the CFD as at the end of Day 8 (that
Understand the CFD as at the end of Day 8 (that
Understand the CFD as at the end of Day 8 (that
Understand the CFD as at the end of Day 8 (that
Day 9
We are now going to step through Day 9.
All of
Day 9
We are now going to step through Day 9.
All of
Project Manager’s Daily Steps
We are going to follow the steps on
Project Manager’s Daily Steps
We are going to follow the steps on
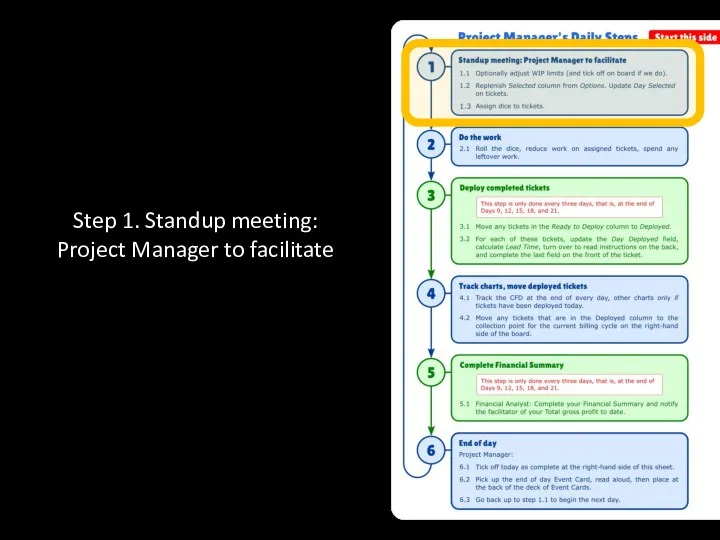
Step 1. Standup meeting: Project Manager to facilitate
Step 1. Standup meeting: Project Manager to facilitate
Step 1: Standup Meeting
1.1 Review WIP limits: We could change WIP
Step 1: Standup Meeting
1.1 Review WIP limits: We could change WIP
Step 1: Standup Meeting
1.2 Replenish the Selected column:
There is spare capacity
Step 1: Standup Meeting
1.2 Replenish the Selected column:
There is spare capacity
Step 1: Standup Meeting
S2 has very little Test work remaining, and
Step 1: Standup Meeting
S2 has very little Test work remaining, and
Step 2. Do the work
Step 2. Do the work
Step 2: Do the work
2.1 We roll the dice, and the
Step 2: Do the work
2.1 We roll the dice, and the
Step 2: Do the work
2.1 Reduce the work on the tickets.
We
Step 2: Do the work
2.1 Reduce the work on the tickets.
We
Step 2: Do the work
Remove the spent die from the board.
The
Step 2: Do the work
Remove the spent die from the board.
The
Step 2: Do the work
Remove the spent die from the board.
The
Step 2: Do the work
Remove the spent die from the board.
The
Step 2: Do the work
Now we will spend the work from
Step 2: Do the work
Now we will spend the work from
Step 2: Do the work
1
The Analysis work in S9 is done,
Step 2: Do the work
1
The Analysis work in S9 is done,
Step 2: Do the work
1
We have spent the leftover point, so
Step 2: Do the work
1
We have spent the leftover point, so
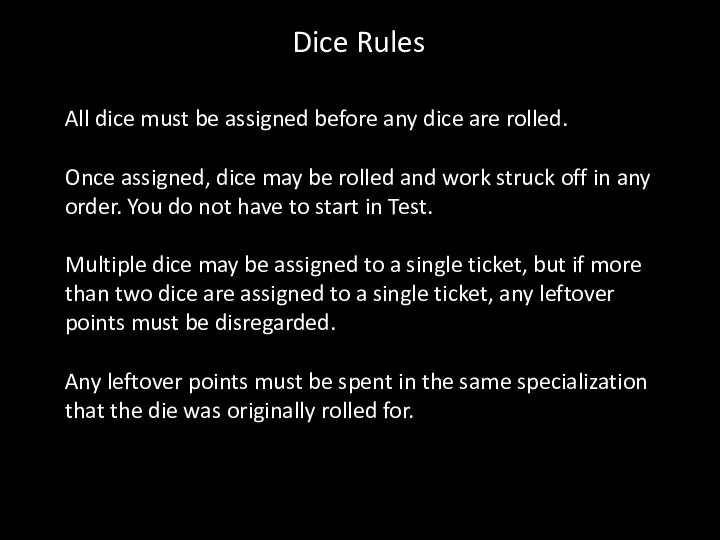
All dice must be assigned before any dice are rolled.
Once assigned,
All dice must be assigned before any dice are rolled.
Once assigned,
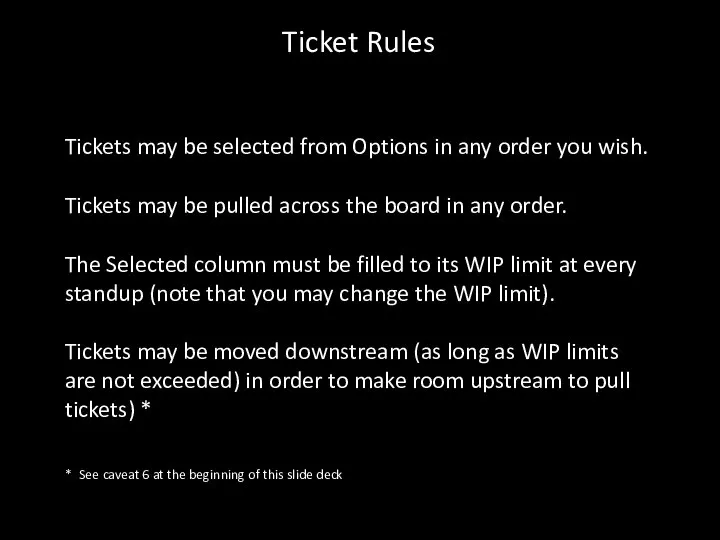
Tickets may be selected from Options in any order you wish.
Tickets
Tickets may be selected from Options in any order you wish.
Tickets
We are about to go to Step 3 in the Project
We are about to go to Step 3 in the Project
Step 3. Deploy completed tickets
Step 3. Deploy completed tickets
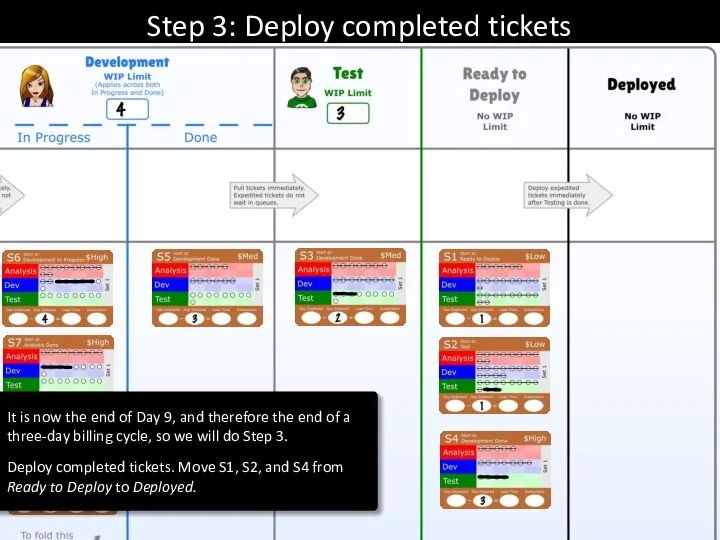
Step 3: Deploy completed tickets
It is now the end of Day
Step 3: Deploy completed tickets
It is now the end of Day
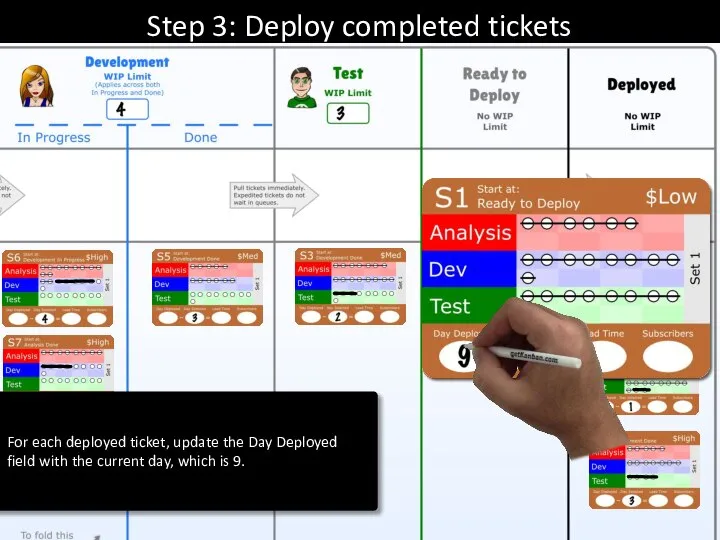
Step 3: Deploy completed tickets
For each deployed ticket, update the Day
Step 3: Deploy completed tickets
For each deployed ticket, update the Day
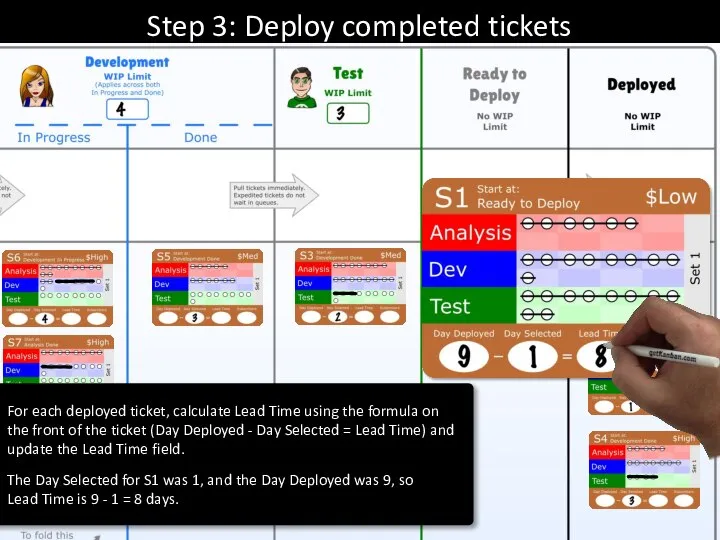
Step 3: Deploy completed tickets
For each deployed ticket, calculate Lead Time
Step 3: Deploy completed tickets
For each deployed ticket, calculate Lead Time
Step 3: Deploy completed tickets
Turn each of the deployed tickets over
Step 3: Deploy completed tickets
Turn each of the deployed tickets over
Step 3: Deploy completed tickets
S1 had a Lead Time of 8,
Step 3: Deploy completed tickets
S1 had a Lead Time of 8,
Step 3: Deploy completed tickets
Turn the ticket back over, and write
Step 3: Deploy completed tickets
Turn the ticket back over, and write
Step 3: Deploy completed tickets
Check that your deployed tickets have their
Step 3: Deploy completed tickets
Check that your deployed tickets have their
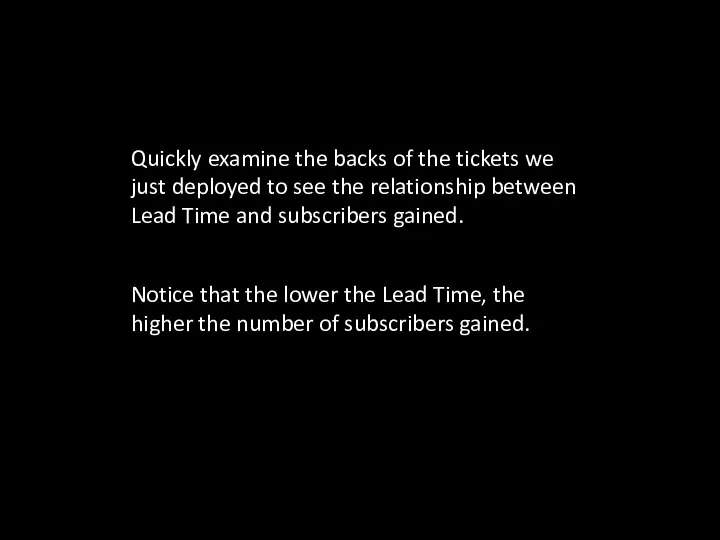
Quickly examine the backs of the tickets we just deployed to
Quickly examine the backs of the tickets we just deployed to
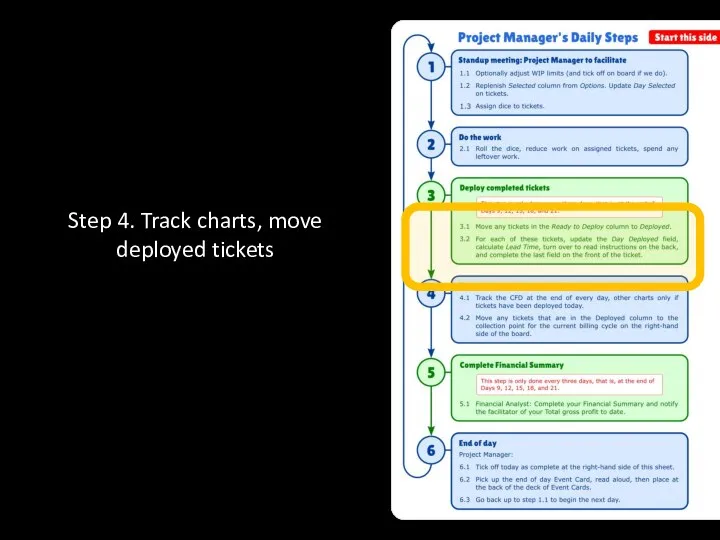
Step 4. Track charts, move deployed tickets
Step 4. Track charts, move deployed tickets
First we will track the CFD
First we will track the CFD
Step 4.1: Track the CFD
Step 4.1: Track the CFD
Step 4.1: Track the CFD
Three tickets passed the black line and
Step 4.1: Track the CFD
Three tickets passed the black line and
Step 4.1: Track the CFD
There are zero tickets between the green
Step 4.1: Track the CFD
There are zero tickets between the green
Step 4.1: Track the CFD
There are two tickets between the blue
Step 4.1: Track the CFD
There are two tickets between the blue
Step 4.1: Track the CFD
There are three tickets between the red
Step 4.1: Track the CFD
There are three tickets between the red
Step 4.1: Track the CFD
There are three tickets between the purple
Step 4.1: Track the CFD
There are three tickets between the purple
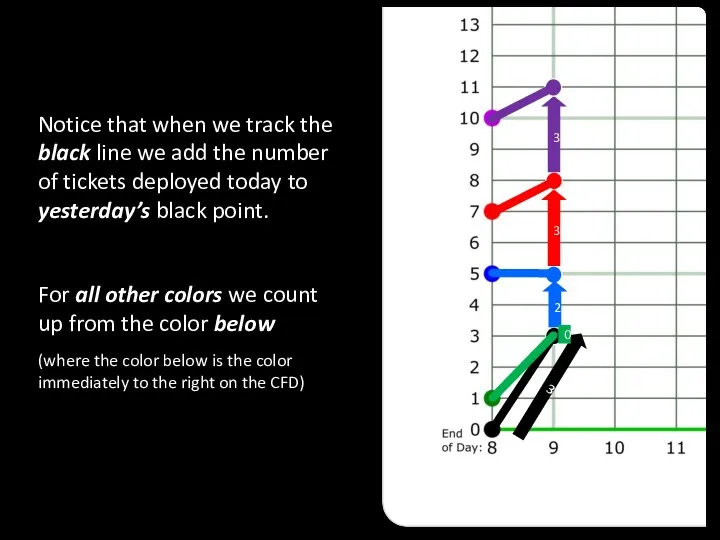
Notice that when we track the black line we add the
Notice that when we track the black line we add the
We track the CFD every day
We track the CFD every day
Now we will track the Run Chart
Now we will track the Run Chart
The Lead Time for each deployed ticket is tracked on one
The Lead Time for each deployed ticket is tracked on one

The Lead Time for the second deployed ticket, S2 is 8,
The Lead Time for the second deployed ticket, S2 is 8,
The Lead Time for the third deployed ticket, S4 is 6,
The Lead Time for the third deployed ticket, S4 is 6,
We only track the Run Chart when tickets have been deployed
(eg:
We only track the Run Chart when tickets have been deployed (eg:
Now we will track the
Lead Time Distribution Chart
Now we will track the
Lead Time Distribution Chart

On this chart the vertical lines are different, they represent Lead
On this chart the vertical lines are different, they represent Lead
The Lead Time for the first deployed ticket, S1 is 8,
The Lead Time for the first deployed ticket, S1 is 8,

The Lead Time for the second deployed ticket, S2 is 8,
The Lead Time for the second deployed ticket, S2 is 8,
The Lead Time for the third deployed ticket, S4 is 6,
The Lead Time for the third deployed ticket, S4 is 6,
We only track the Lead Time Distribution Chart when tickets have
We only track the Lead Time Distribution Chart when tickets have
Now we will move the deployed tickets to the collection point
Now we will move the deployed tickets to the collection point
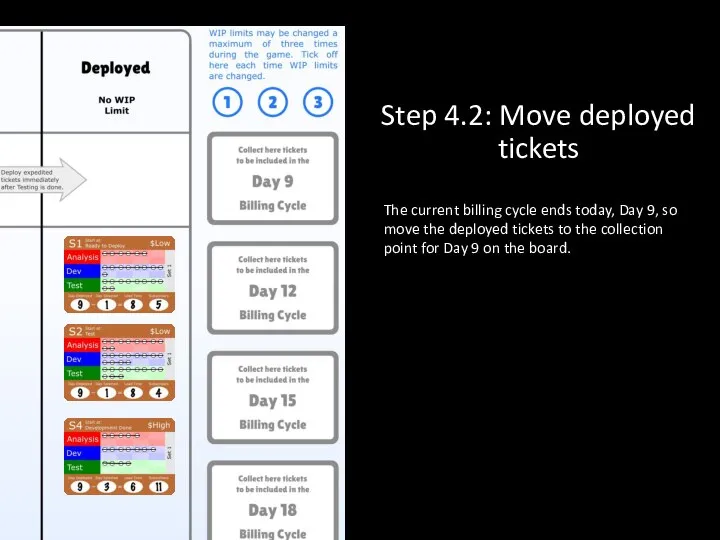
The current billing cycle ends today, Day 9, so move the
The current billing cycle ends today, Day 9, so move the
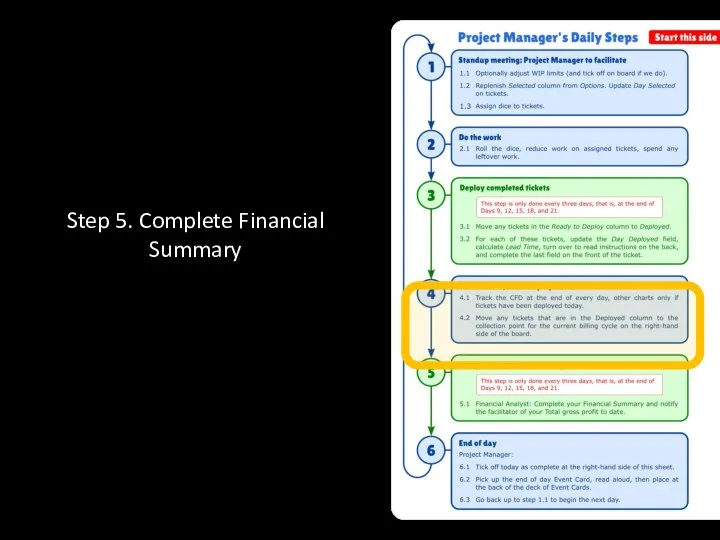
Step 5. Complete Financial Summary
Step 5. Complete Financial Summary
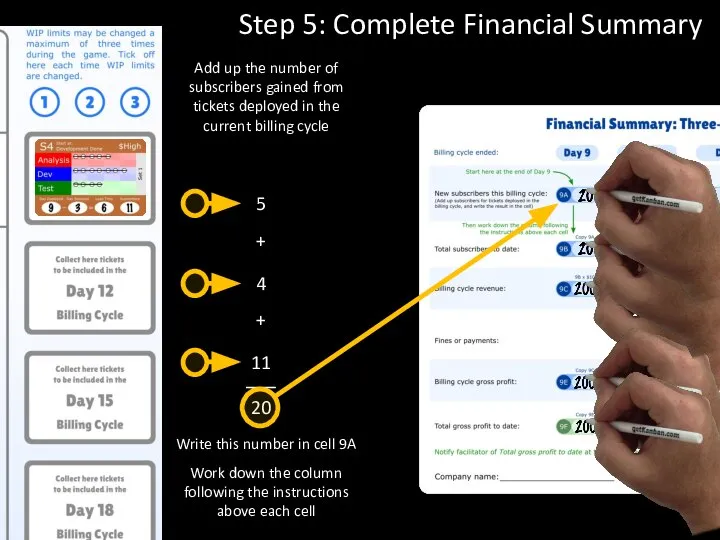
Add up the number of subscribers gained from tickets deployed in
Add up the number of subscribers gained from tickets deployed in
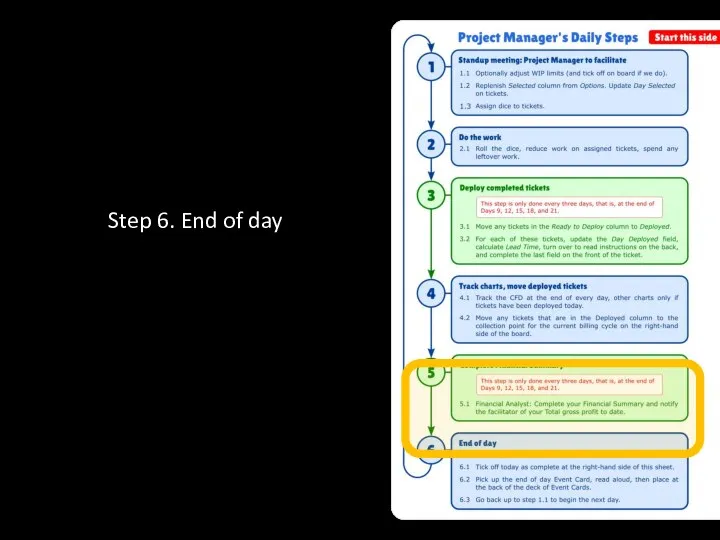
Step 6. End of day
Step 6. End of day
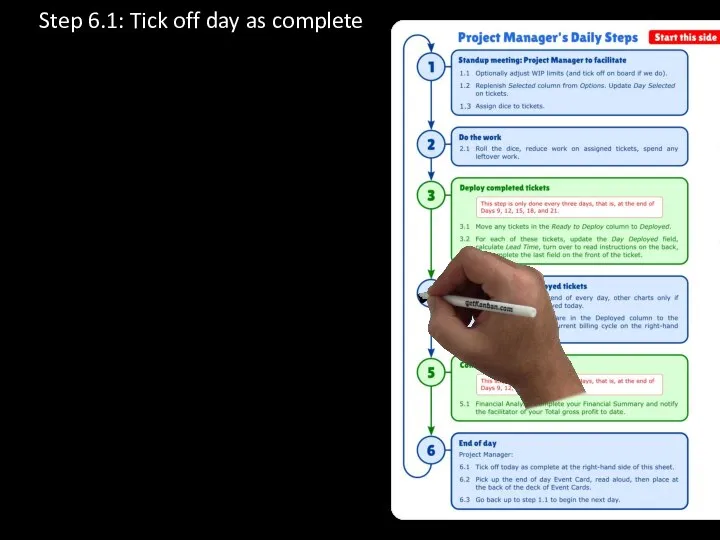
Step 6.1: Tick off day as complete
Step 6.1: Tick off day as complete
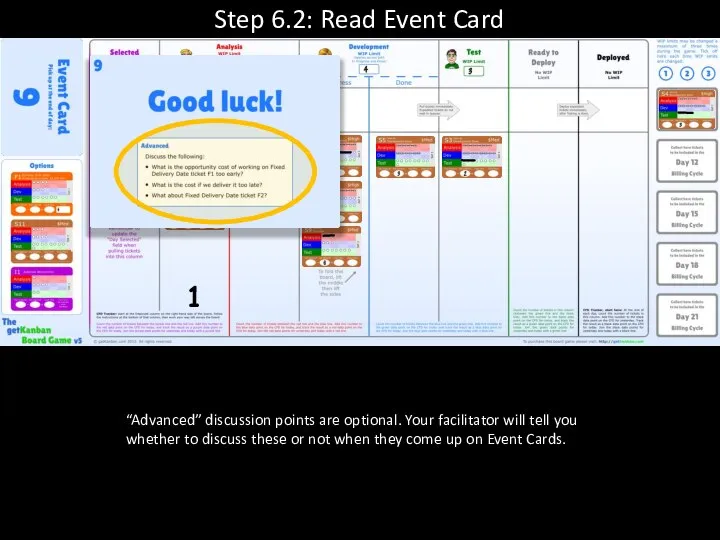
Step 6.2: Read Event Card
1
“Advanced” discussion points are optional. Your facilitator
Step 6.2: Read Event Card
1
“Advanced” discussion points are optional. Your facilitator
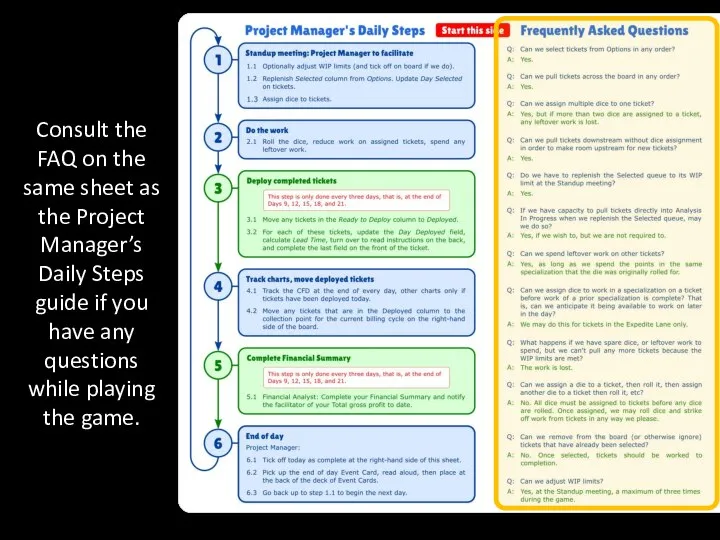
Consult the FAQ on the same sheet as the Project Manager’s
Consult the FAQ on the same sheet as the Project Manager’s
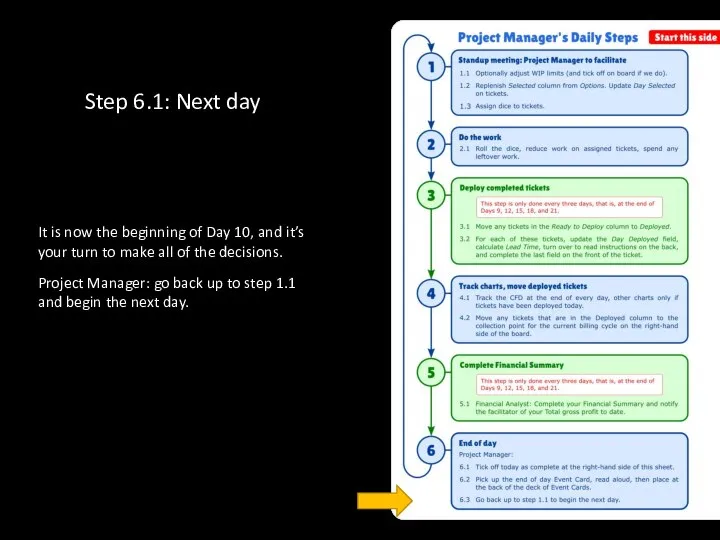
Step 6.1: Next day
It is now the beginning of Day 10,
Step 6.1: Next day
It is now the beginning of Day 10,
Optional: Bonus
The first team to complete Day 15 will receive an
Optional: Bonus
The first team to complete Day 15 will receive an

End of Game
Continue to debrief
End of Game
Continue to debrief
The Winners
Lead Time
The Team
The Work
The Blocker
Queue Replenishment
Carlos’ Testing Policies
Fixed Delivery Date
The Winners
Lead Time
The Team
The Work
The Blocker
Queue Replenishment
Carlos’ Testing Policies
Fixed Delivery Date
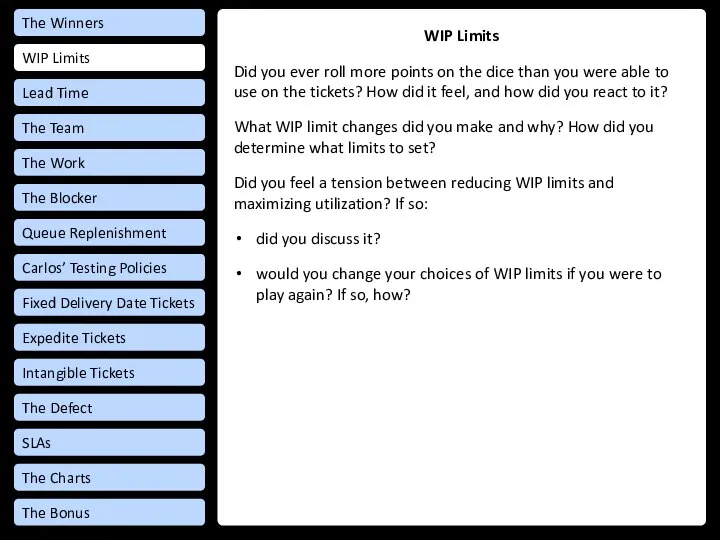
WIP Limits
Did you ever roll more points on the dice than
WIP Limits
Did you ever roll more points on the dice than
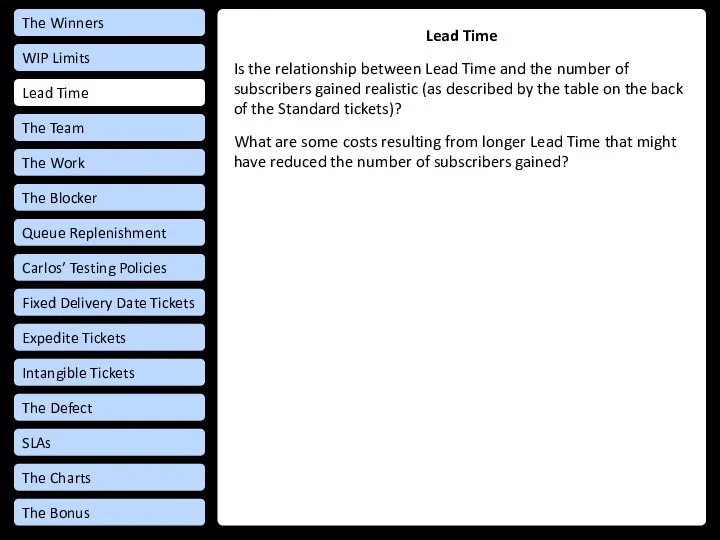
Lead Time
Is the relationship between Lead Time and the number of
Lead Time
Is the relationship between Lead Time and the number of
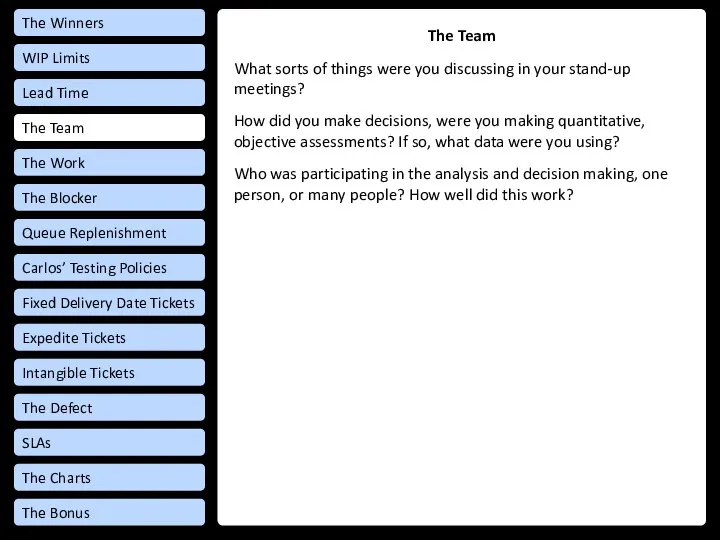
The Team
What sorts of things were you discussing in your stand-up
The Team
What sorts of things were you discussing in your stand-up
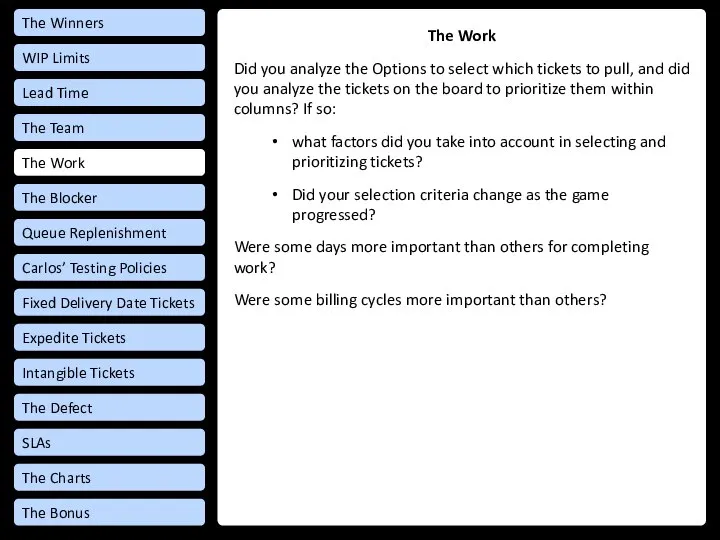
The Work
Did you analyze the Options to select which tickets to
The Work
Did you analyze the Options to select which tickets to
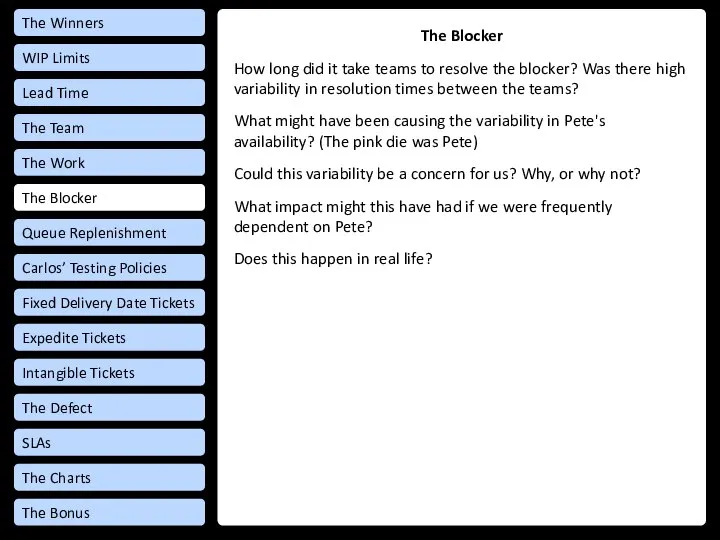
The Blocker
How long did it take teams to resolve the blocker?
The Blocker
How long did it take teams to resolve the blocker?
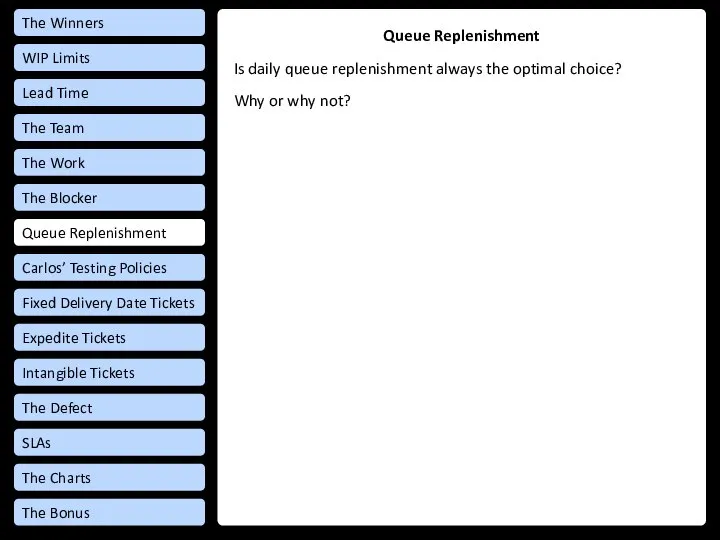
Queue Replenishment
Is daily queue replenishment always the optimal choice?
Why or why
Queue Replenishment
Is daily queue replenishment always the optimal choice?
Why or why
Carlos’ Testing Policies
What did you observe when Carlos arrived? When he
Carlos’ Testing Policies
What did you observe when Carlos arrived? When he
Fixed Delivery Date Tickets
When did start work on the Fixed Delivery
Fixed Delivery Date Tickets
When did start work on the Fixed Delivery
Expedite Tickets
Did you decide to do E1? Did you swarm on
Expedite Tickets
Did you decide to do E1? Did you swarm on
Intangible Tickets
Did you decide to work on the intangible tickets?
How did
Intangible Tickets
Did you decide to work on the intangible tickets?
How did
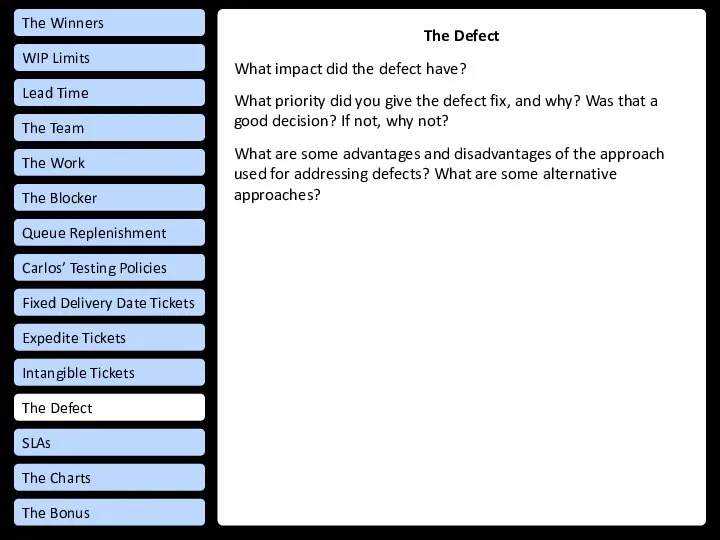
The Defect
What impact did the defect have?
What priority did you give
The Defect
What impact did the defect have?
What priority did you give
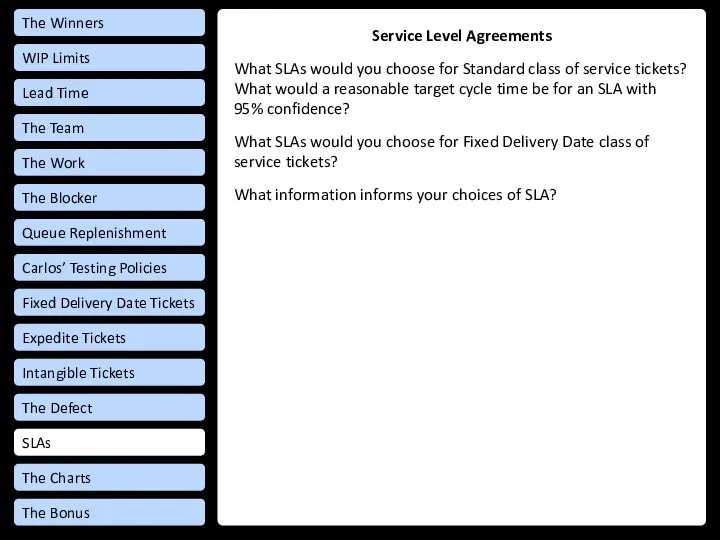
Service Level Agreements
What SLAs would you choose for Standard class of
Service Level Agreements
What SLAs would you choose for Standard class of
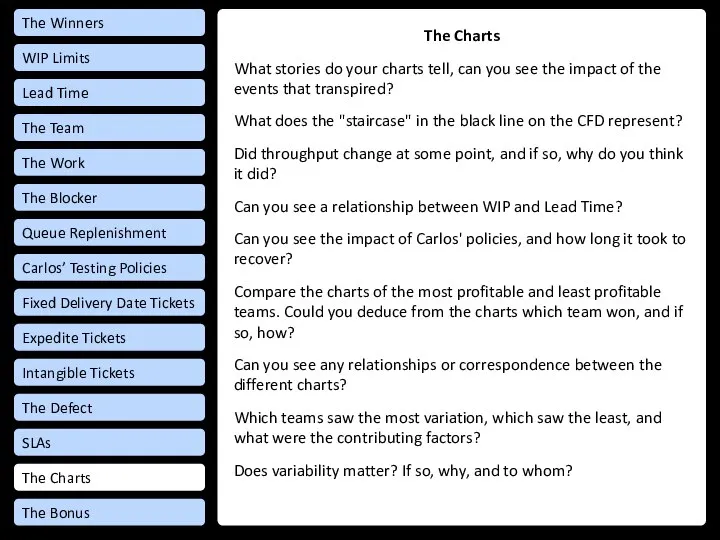
The Charts
What stories do your charts tell, can you see the
The Charts
What stories do your charts tell, can you see the
Похожие презентации
 Методика моделирования генераторов псевдослучайных последовательностей
 Магазин шопперов и носков Интеллектуальная тусовка
 предварит. напряж. конструкции
 Спецтехника лесного хозяйства: лесовоз
 Книжки-игрушки
 Обследование зданий и сооружений
 Машиноведение. История создания швейных машин. Виды приводов
 Фотоальбом
 Логические поразрядные операции
 8 Наурыз Халықаралық әйелдер күнімен шын жүректен құттықтаймын!
 2022 УРОК ЗНАНИЙ 1 класс
 Prezentatsia_obrazets (3)
 Расчет эффективности цикла Ренкина
 Развитие методов расчета железобетонных конструкций
 Помоги приюту Хати
 01-02UYX 00UKX
 Морис Метерлинк
 Плавание-моя жизнь
 Праздники в Англии
 Оборудование и технология сварочного производства
 Производство, передача и потребление электрической энергии
 Расчет монолитных железобетонных конструкций с учетом температурных деформаций
 Дарындылар додасы
 Классификация профессий. Формула профессии
 Источники исламского права
 Итоги года
 Искусство в религиозной культуре