- Managing Risk

Содержание
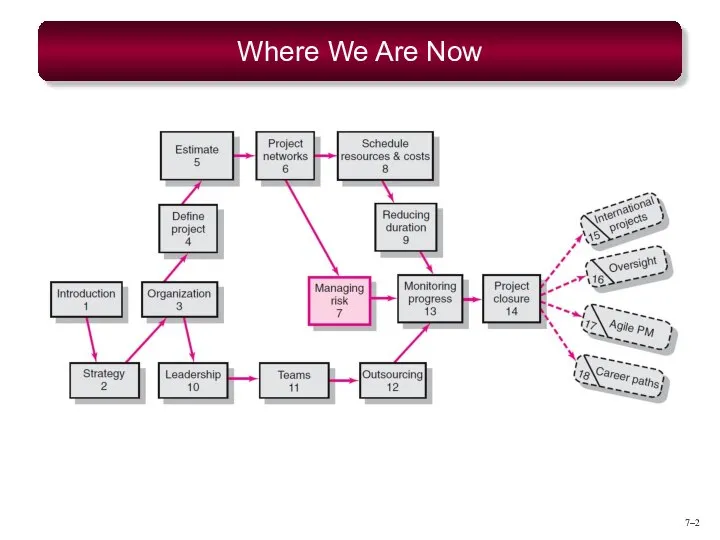
- 2. 7– Where We Are Now
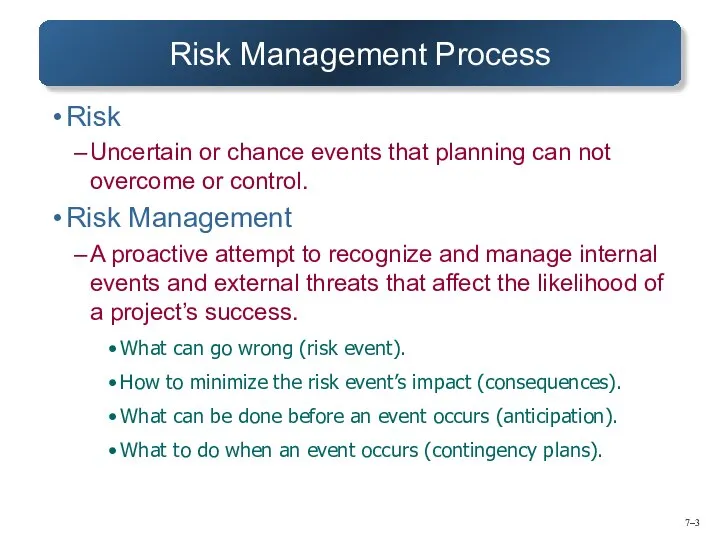
- 3. 7– Risk Management Process Risk Uncertain or chance events that planning can not overcome or control.
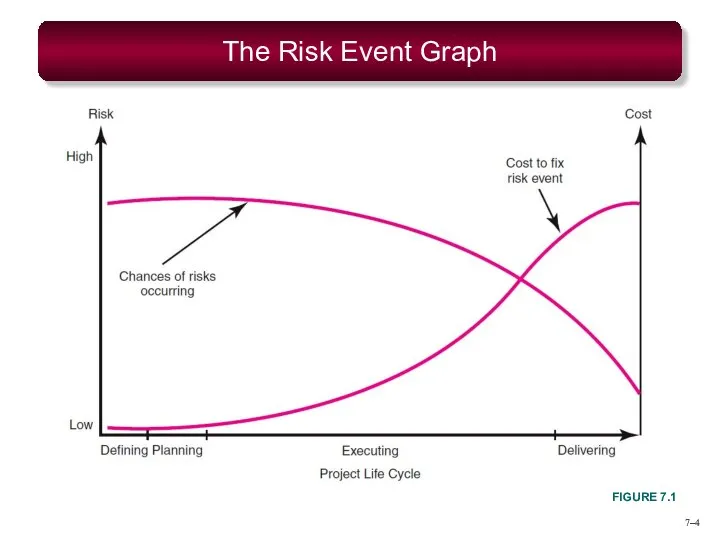
- 4. 7– The Risk Event Graph FIGURE 7.1
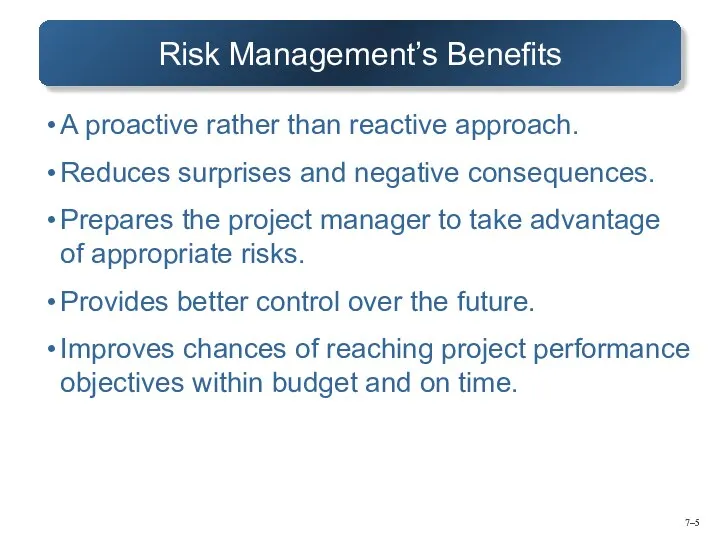
- 5. 7– Risk Management’s Benefits A proactive rather than reactive approach. Reduces surprises and negative consequences. Prepares
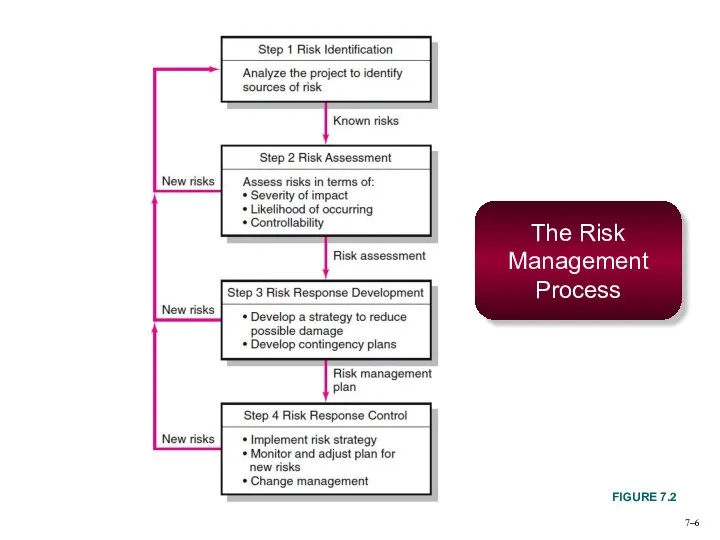
- 6. 7– The Risk Management Process FIGURE 7.2
- 7. 7– Managing Risk Step 1: Risk Identification Generate a list of possible risks through brainstorming, problem
- 8. 7– The Risk Breakdown Structure (RBS) FIGURE 7.3
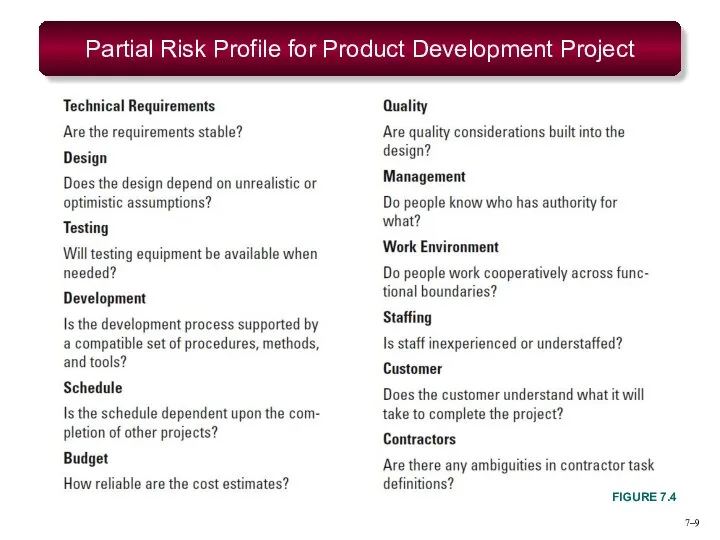
- 9. 7– Partial Risk Profile for Product Development Project FIGURE 7.4
- 10. 7– Defined Conditions for Impact Scales of a Risk on Major Project Objectives (Examples for negative
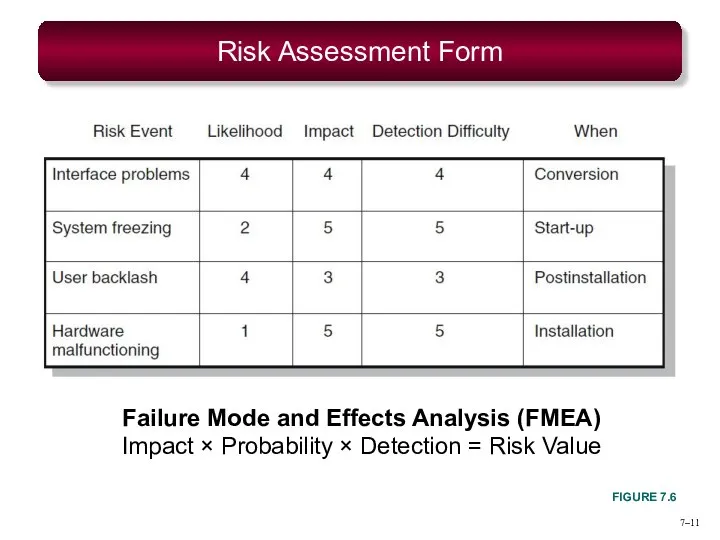
- 11. 7– Risk Assessment Form FIGURE 7.6 Failure Mode and Effects Analysis (FMEA) Impact × Probability ×
- 12. 7– Risk Severity Matrix FIGURE 7.7 Failure Mode and Effects Analysis (FMEA) Impact × Probability ×
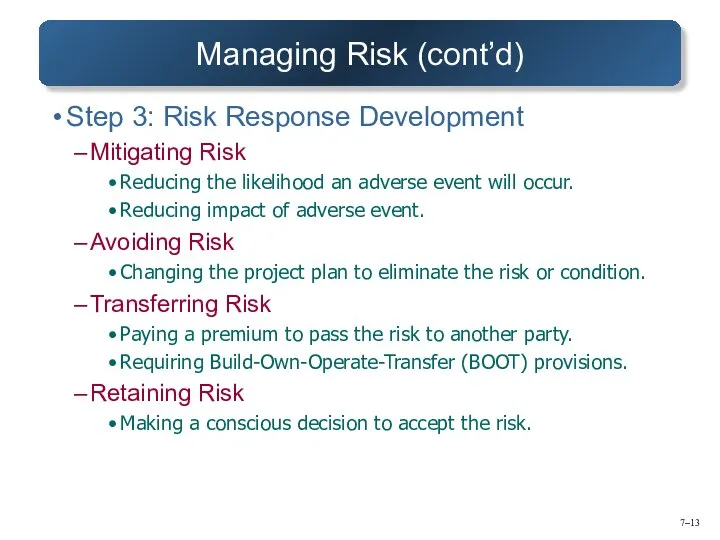
- 13. 7– Managing Risk (cont’d) Step 3: Risk Response Development Mitigating Risk Reducing the likelihood an adverse
- 14. 7– Contingency Planning Contingency Plan An alternative plan that will be used if a possible foreseen
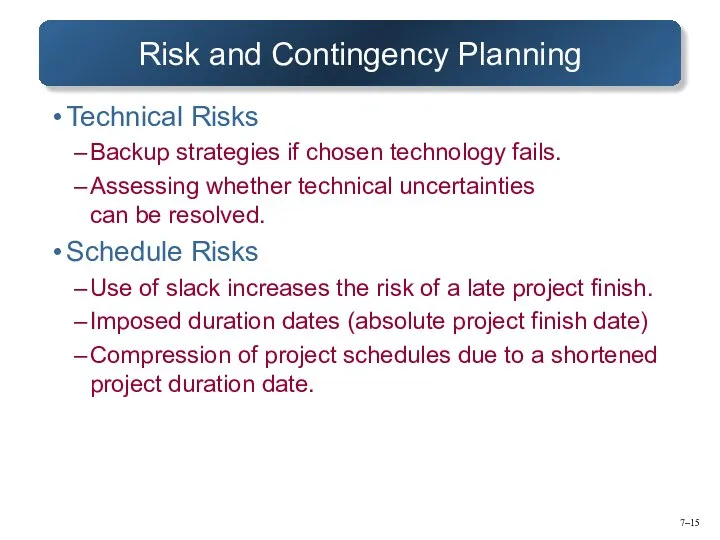
- 15. 7– Risk and Contingency Planning Technical Risks Backup strategies if chosen technology fails. Assessing whether technical
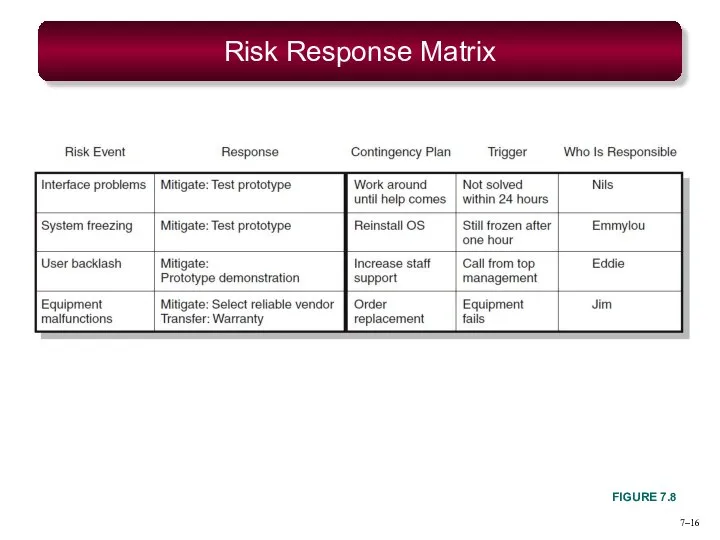
- 16. 7– Risk Response Matrix FIGURE 7.8
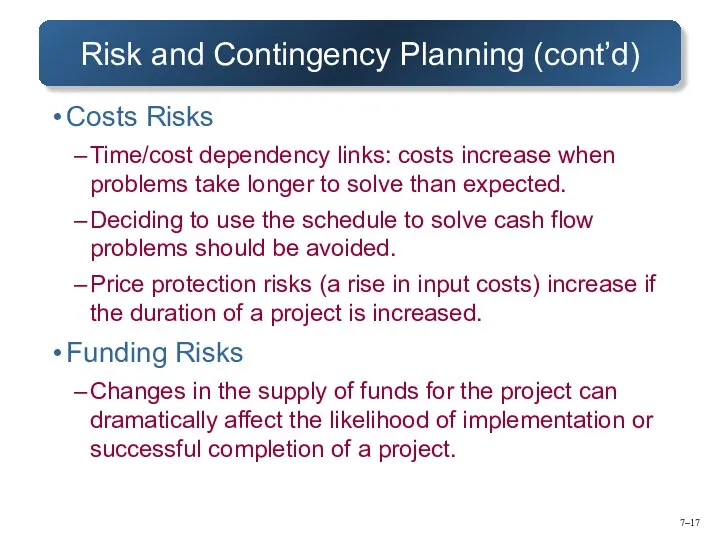
- 17. 7– Risk and Contingency Planning (cont’d) Costs Risks Time/cost dependency links: costs increase when problems take
- 18. 7– Opportunity Management Tactics Exploit Seeking to eliminate the uncertainty associated with an opportunity to ensure
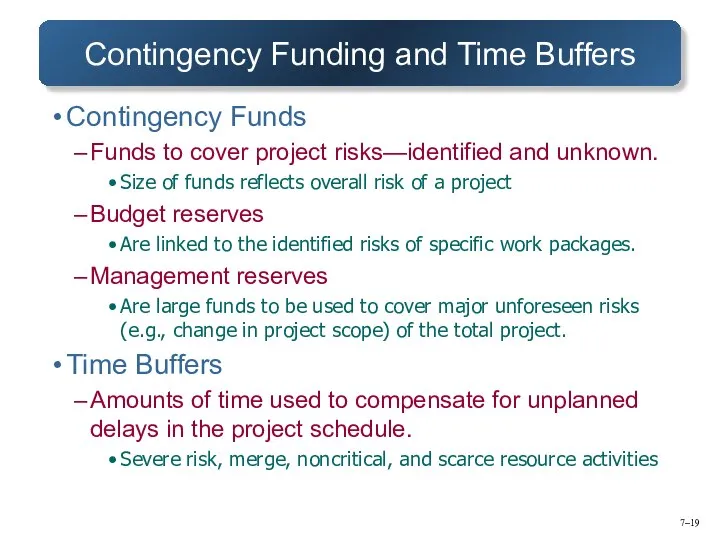
- 19. 7– Contingency Funding and Time Buffers Contingency Funds Funds to cover project risks—identified and unknown. Size
- 20. 7– Contingency Fund Estimate ($000s) TABLE 7.1
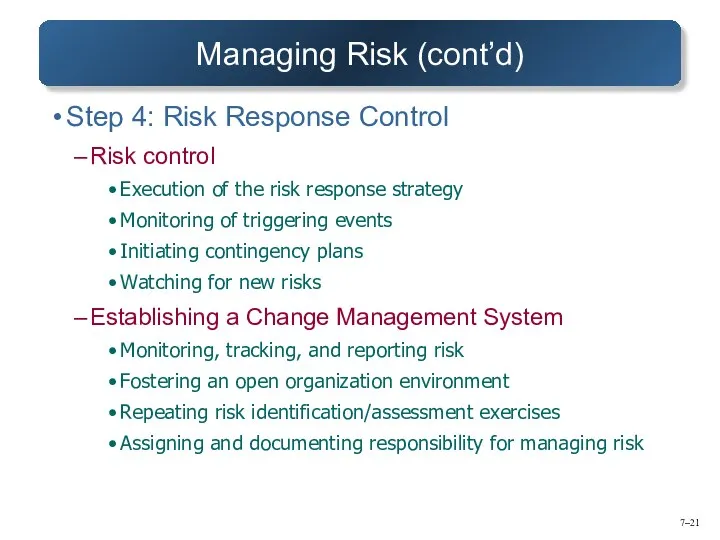
- 21. 7– Managing Risk (cont’d) Step 4: Risk Response Control Risk control Execution of the risk response
- 22. 7– Change Management Control Sources of Change Project scope changes Implementation of contingency plans Improvement changes
- 23. 7– Change Control System Process Identify proposed changes. List expected effects of proposed changes on schedule
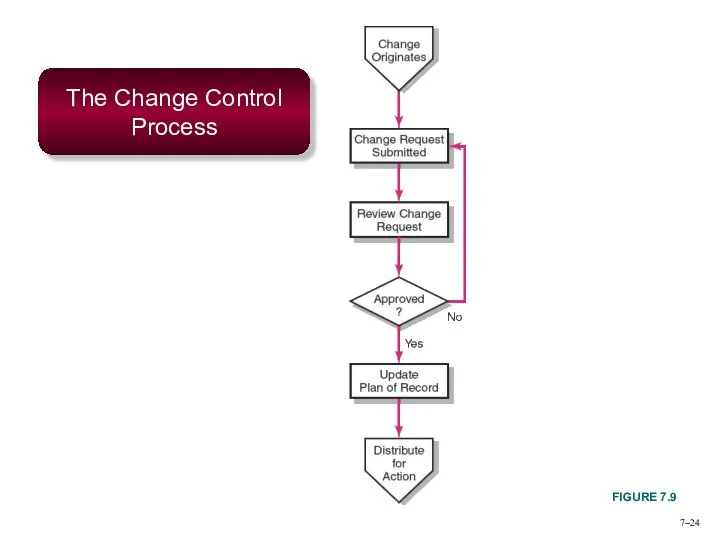
- 24. 7– The Change Control Process FIGURE 7.9
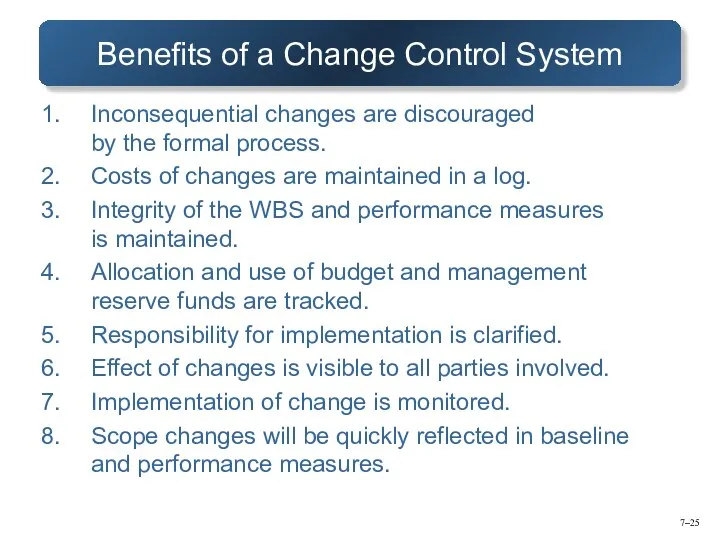
- 25. 7– Benefits of a Change Control System Inconsequential changes are discouraged by the formal process. Costs
- 26. 7– Sample Change Request Form FIGURE 7.10
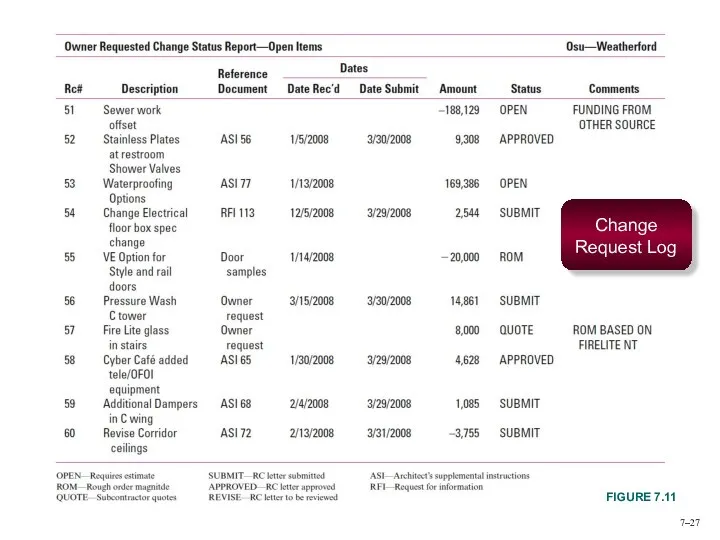
- 27. 7– Change Request Log FIGURE 7.11
- 28. 7– Key Terms Avoiding risk Budget reserve Change management system Contingency plan Management reserve Mitigating risk
- 29. Appendix 7.1 PERT and PERT Simulation
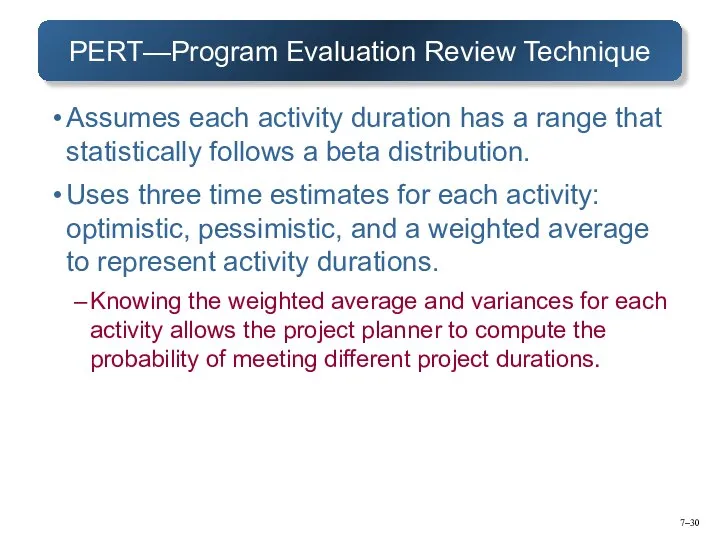
- 30. 7– PERT—Program Evaluation Review Technique Assumes each activity duration has a range that statistically follows a
- 31. 7– Activity and Project Frequency Distributions FIGURE A7.1
- 32. 7– Activity Time Calculations
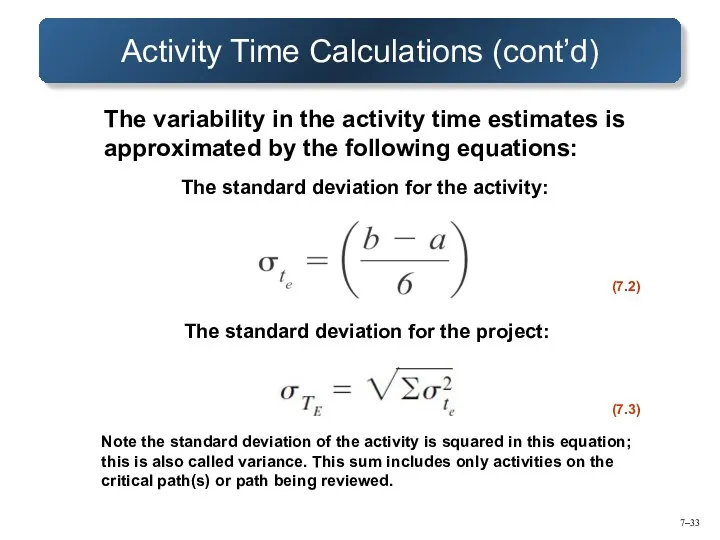
- 33. 7– Activity Time Calculations (cont’d)
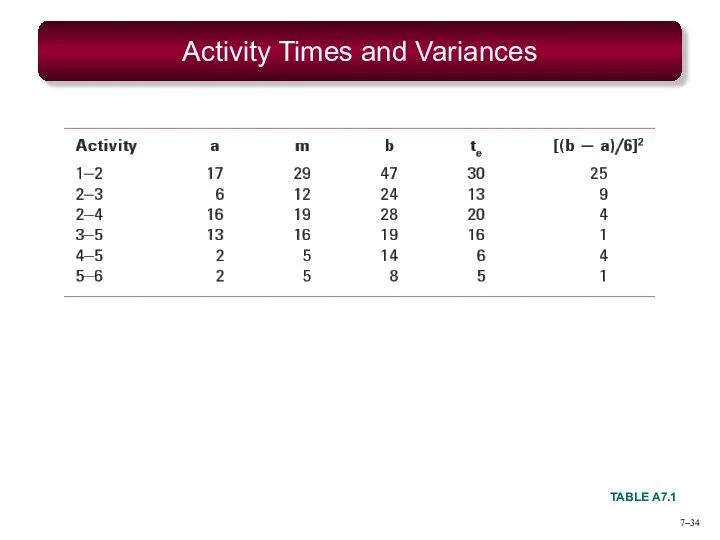
- 34. 7– Activity Times and Variances TABLE A7.1
- 35. 7– Probability of Completing the Project
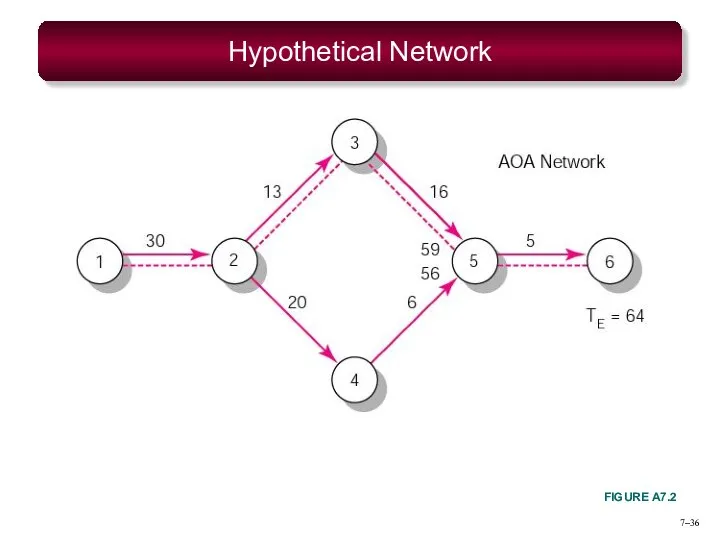
- 36. 7– Hypothetical Network FIGURE A7.2
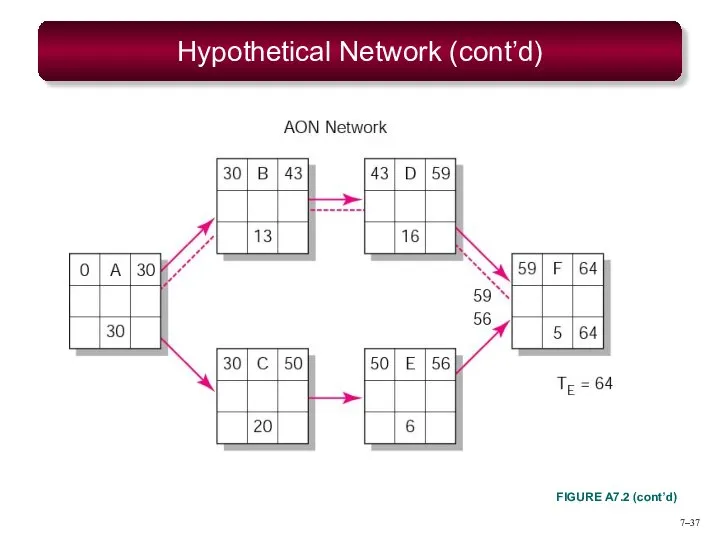
- 37. 7– Hypothetical Network (cont’d) FIGURE A7.2 (cont’d)
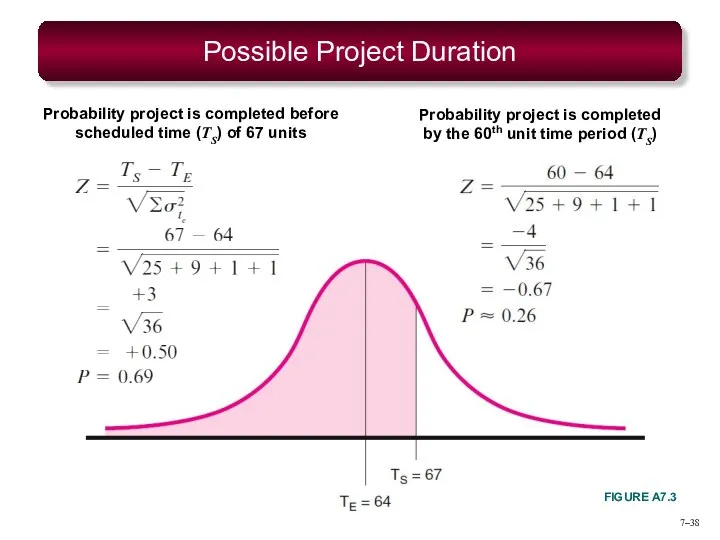
- 38. 7– Possible Project Duration FIGURE A7.3
- 40. Скачать презентацию
7–
Where We Are Now
7–
Where We Are Now
7–
Risk Management Process
Risk
Uncertain or chance events that planning can not overcome
7–
Risk Management Process
Risk
Uncertain or chance events that planning can not overcome
7–
The Risk Event Graph
FIGURE 7.1
7–
The Risk Event Graph
FIGURE 7.1
7–
Risk Management’s Benefits
A proactive rather than reactive approach.
Reduces surprises and negative
7–
Risk Management’s Benefits
A proactive rather than reactive approach.
Reduces surprises and negative
7–
The Risk Management Process
FIGURE 7.2
7–
The Risk Management Process
FIGURE 7.2

7–
Managing Risk
Step 1: Risk Identification
Generate a list of possible risks through
7–
Managing Risk
Step 1: Risk Identification
Generate a list of possible risks through

7–
The Risk Breakdown Structure (RBS)
FIGURE 7.3
7–
The Risk Breakdown Structure (RBS)
FIGURE 7.3
7–
Partial Risk Profile for Product Development Project
FIGURE 7.4
7–
Partial Risk Profile for Product Development Project
FIGURE 7.4

7–
Defined Conditions for Impact Scales of a Risk on Major Project
7–
Defined Conditions for Impact Scales of a Risk on Major Project
7–
Risk Assessment Form
FIGURE 7.6
Failure Mode and Effects Analysis (FMEA)
Impact × Probability
7–
Risk Assessment Form
FIGURE 7.6
Failure Mode and Effects Analysis (FMEA) Impact × Probability

7–
Risk Severity Matrix
FIGURE 7.7
Failure Mode and Effects Analysis (FMEA)
Impact × Probability
7–
Risk Severity Matrix
FIGURE 7.7
Failure Mode and Effects Analysis (FMEA) Impact × Probability
7–
Managing Risk (cont’d)
Step 3: Risk Response Development
Mitigating Risk
Reducing the likelihood an
7–
Managing Risk (cont’d)
Step 3: Risk Response Development
Mitigating Risk
Reducing the likelihood an

7–
Contingency Planning
Contingency Plan
An alternative plan that will be used if a
7–
Contingency Planning
Contingency Plan
An alternative plan that will be used if a
7–
Risk and Contingency Planning
Technical Risks
Backup strategies if chosen technology fails.
Assessing whether
7–
Risk and Contingency Planning
Technical Risks
Backup strategies if chosen technology fails.
Assessing whether
7–
Risk Response Matrix
FIGURE 7.8
7–
Risk Response Matrix
FIGURE 7.8
7–
Risk and Contingency Planning (cont’d)
Costs Risks
Time/cost dependency links: costs increase when
7–
Risk and Contingency Planning (cont’d)
Costs Risks
Time/cost dependency links: costs increase when

7–
Opportunity Management Tactics
Exploit
Seeking to eliminate the uncertainty associated with an opportunity
7–
Opportunity Management Tactics
Exploit
Seeking to eliminate the uncertainty associated with an opportunity
7–
Contingency Funding and Time Buffers
Contingency Funds
Funds to cover project risks—identified and
7–
Contingency Funding and Time Buffers
Contingency Funds
Funds to cover project risks—identified and

7–
Contingency Fund Estimate ($000s)
TABLE 7.1
7–
Contingency Fund Estimate ($000s)
TABLE 7.1
7–
Managing Risk (cont’d)
Step 4: Risk Response Control
Risk control
Execution of the risk
7–
Managing Risk (cont’d)
Step 4: Risk Response Control
Risk control
Execution of the risk

7–
Change Management Control
Sources of Change
Project scope changes
Implementation of contingency plans
Improvement changes
7–
Change Management Control
Sources of Change
Project scope changes
Implementation of contingency plans
Improvement changes

7–
Change Control System Process
Identify proposed changes.
List expected effects of proposed changes
7–
Change Control System Process
Identify proposed changes.
List expected effects of proposed changes
7–
The Change Control Process
FIGURE 7.9
7–
The Change Control Process
FIGURE 7.9
7–
Benefits of a Change Control System
Inconsequential changes are discouraged
by the
7–
Benefits of a Change Control System
Inconsequential changes are discouraged by the

7–
Sample Change Request Form
FIGURE 7.10
7–
Sample Change Request Form
FIGURE 7.10
7–
Change Request Log
FIGURE 7.11
7–
Change Request Log
FIGURE 7.11
7–
Key Terms
Avoiding risk
Budget reserve
Change management system
Contingency plan
Management reserve
Mitigating risk
Opportunity
Risk
Risk breakdown structure
7–
Key Terms
Avoiding risk
Budget reserve
Change management system
Contingency plan
Management reserve
Mitigating risk
Opportunity
Risk
Risk breakdown structure
Appendix 7.1
PERT and PERT Simulation
Appendix 7.1
PERT and PERT Simulation
7–
PERT—Program Evaluation Review Technique
Assumes each activity duration has a range that
7–
PERT—Program Evaluation Review Technique
Assumes each activity duration has a range that

7–
Activity and Project Frequency Distributions
FIGURE A7.1
7–
Activity and Project Frequency Distributions
FIGURE A7.1

7–
Activity Time Calculations
7–
Activity Time Calculations
7–
Activity Time Calculations (cont’d)
7–
Activity Time Calculations (cont’d)
7–
Activity Times and Variances
TABLE A7.1
7–
Activity Times and Variances
TABLE A7.1

7–
Probability of Completing the Project
7–
Probability of Completing the Project
7–
Hypothetical Network
FIGURE A7.2
7–
Hypothetical Network
FIGURE A7.2
7–
Hypothetical Network (cont’d)
FIGURE A7.2 (cont’d)
7–
Hypothetical Network (cont’d)
FIGURE A7.2 (cont’d)
7–
Possible Project Duration
FIGURE A7.3
7–
Possible Project Duration
FIGURE A7.3
 Путешествие в Древний Восток
 Первая медицинская помощь при травмах
 Дружба. Притчи
 ФИЗИОЛОГИЯ СИНАПСОВ. ФИЗИОЛОГИЯ НЕЙРОНА. ФИЗИОЛОГИЯ ЖЕЛЕЗ
 Ökologie und umweltverträglichkeit
 Общие сведения об электроснабжении потребителей
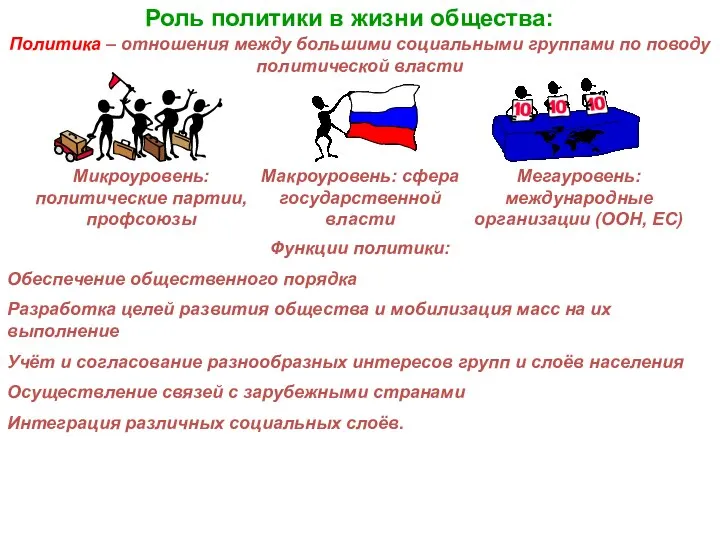 Роль политики в жизни общества
 Типы, переменные, управляющие инструкции. (Тема 2.1)
 Проект цеха по производству полукопченых колбас. «Армавирская», «Золотое кольцо»
 Задачи физического воспитания студентов их краткая характеристика
 Организация и содержание физминутки на уроке
 Организация и содержание физминутки на уроке
  Таможенные операции и лица их совершающие
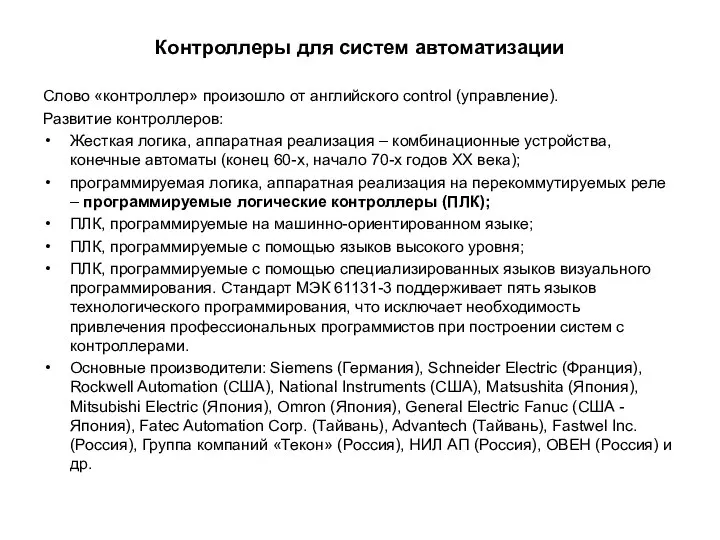 Контроллеры для систем автоматизации
 Религия в современном мире
 Бюджет. Доходы и расходы Автор Воронина М.М., учитель начальных классов МОУ лицей №7 Волгограда
  МЕТОДИКА эколого-гигиенической оценки интегрального качества воды
 Алгебра, 9 класс
  ХРАНЕНИЕ и юридический договор хранения
  B и Красно-Черные деревья
 Человеческий капитал и персональные компетенции современного коммуникатора
 Татьянин день Студенческий праздник
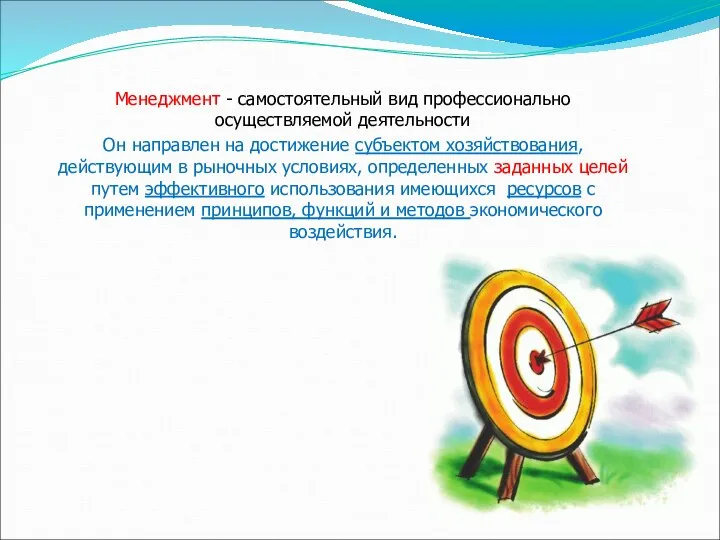 Функции менеджмента
 Статусне і сімейне право. Основи римського права. Лекція 3
 Сельское хозяйство Бразилии
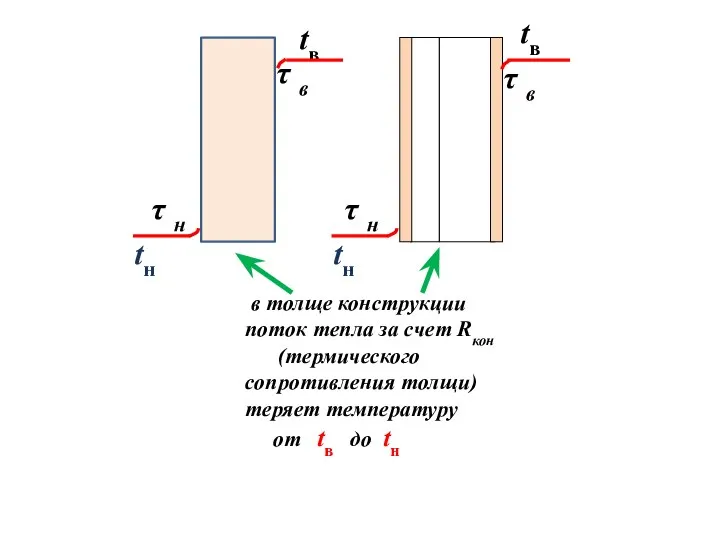 Механизм распределения (падения) температуры в толще ограждения термически однородного
 От чего зависит успех клиники. Бизнес - проектирование
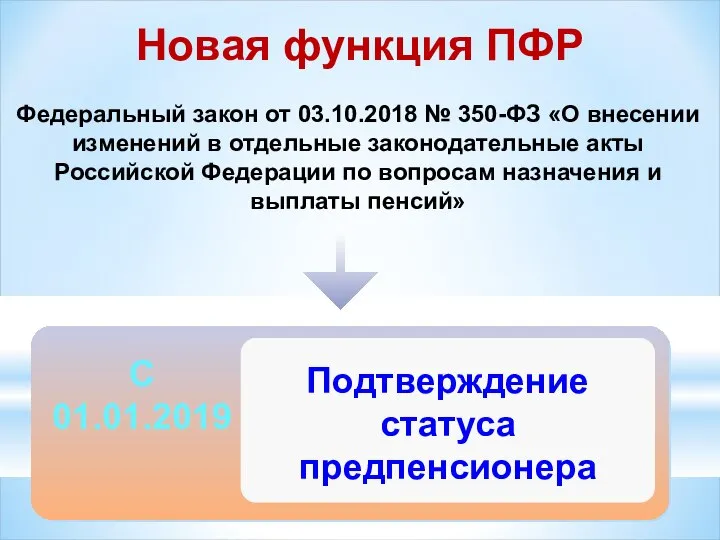 Закон «О внесении изменений в отдельные законодательные акты Российской Федерации по вопросам назначения и выплаты пенсий»