- Quality Engineering 1

Содержание
- 2. Definition of Quality Indicators of Quality Historical perspective / performance - VOC Deming’s quality principles Plotting
- 3. Of the many meanings of the word “quality,” two are of critical importance to managing for
- 4. 2. “Quality” means freedom from deficiencies—freedom from errors that require doing work over again (rework) or
- 5. Performance – primary operating characteristics Time – time waiting for service, time waiting on queue, time
- 6. Product: The output of any process. To many economists, products include both goods and services. However,
- 7. A fourth and widely used basis for setting quality goals has been historical performance; i.e., goals
- 8. William Edwards Deming (October 14, 1900 – December 20, 1993) was an American engineer, statistician, professor,
- 9. 3. Build Quality In – You Can’t Inspect it In He encouraged businesses to stop depending
- 10. 6. Use On-The-Job Training Expenses + time loss. You don’t need to know all the details
- 11. 9. Break Down the Barriers Between Departments When people work as a team, they can achieve
- 12. 12. Remove Barriers that Prevent Teams From Feeling Proud of Their Work Taking pride in one’s
- 13. Scatter plots are used when you want to show the relationship between two variables. Scatter plots
- 14. Microsoft Excel is a tool which has many uses, the most common of which are performing
- 15. Plotting graphs (scatter method)
- 16. It is very important to use the "=" sign. The "=" sign tells the spreadsheet program
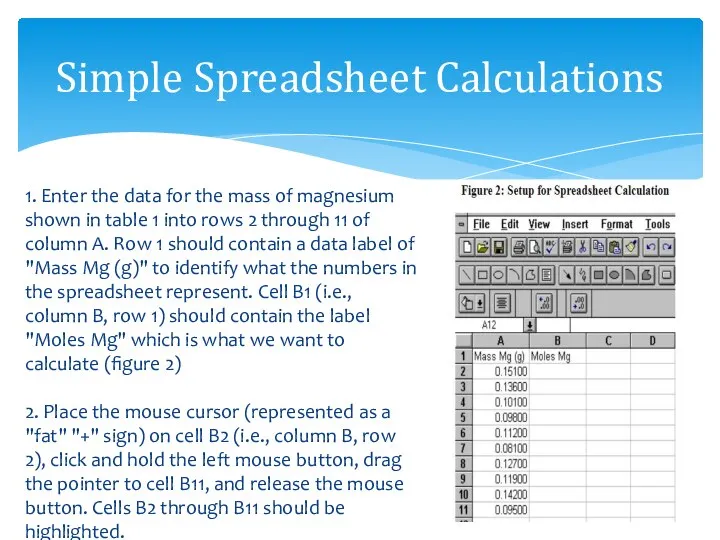
- 17. Simple Spreadsheet Calculations
- 18. Simple Spreadsheet Calculations
- 19. Simple Spreadsheet Calculations
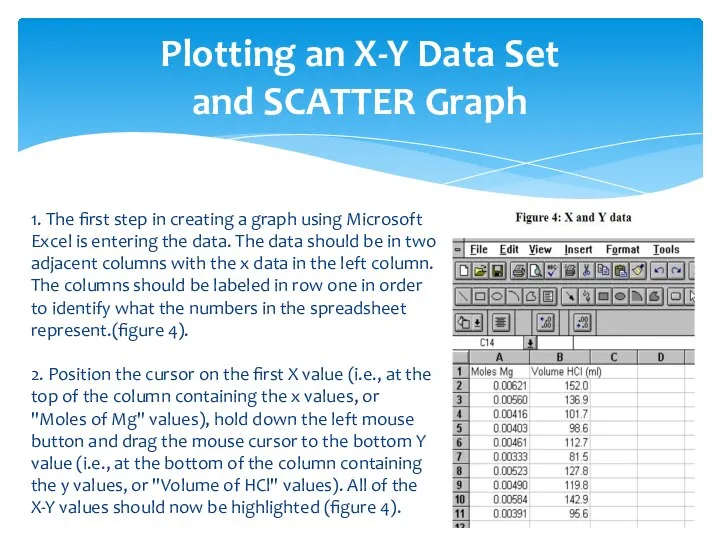
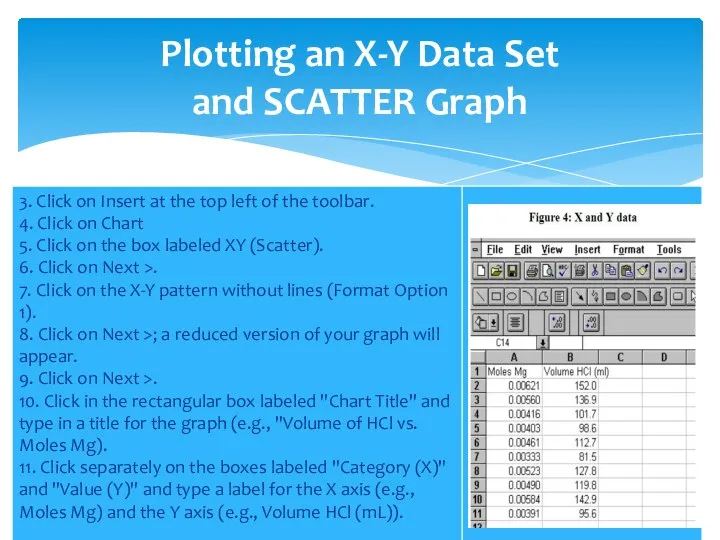
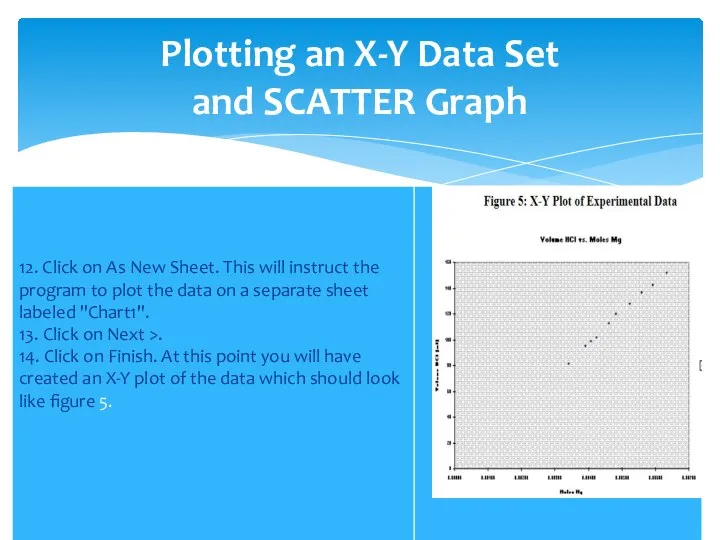
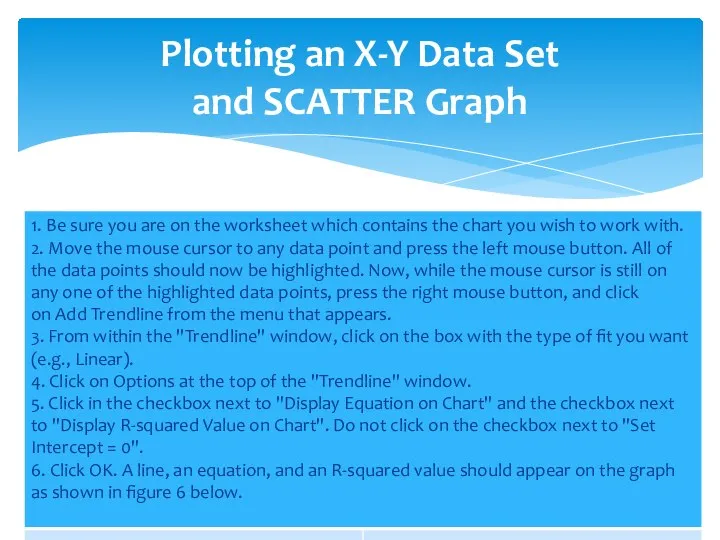
- 20. Plotting an X-Y Data Set and SCATTER Graph
- 21. Plotting an X-Y Data Set and SCATTER Graph
- 22. Plotting an X-Y Data Set and SCATTER Graph
- 23. Plotting an X-Y Data Set and SCATTER Graph
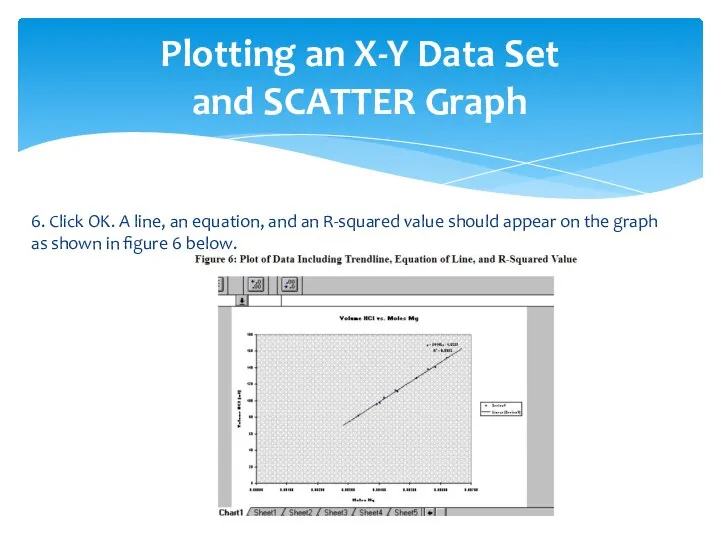
- 24. Plotting an X-Y Data Set and SCATTER Graph 6. Click OK. A line, an equation, and
- 26. Скачать презентацию
Definition of Quality
Indicators of Quality
Historical perspective / performance - VOC
Deming’s quality
Definition of Quality
Indicators of Quality
Historical perspective / performance - VOC
Deming’s quality
Of the many meanings of the word “quality,” two are of
Of the many meanings of the word “quality,” two are of
2. “Quality” means freedom from deficiencies—freedom from errors that require doing
2. “Quality” means freedom from deficiencies—freedom from errors that require doing
Performance – primary operating characteristics
Time – time waiting for service, time
Performance – primary operating characteristics
Time – time waiting for service, time
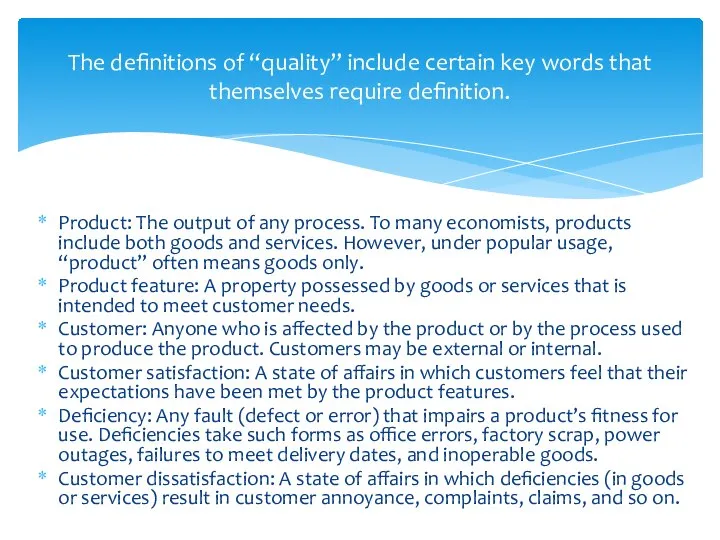
Product: The output of any process. To many economists, products include
Product: The output of any process. To many economists, products include
A fourth and widely used basis for setting quality goals has
A fourth and widely used basis for setting quality goals has
William Edwards Deming (October 14, 1900 – December 20, 1993) was an
William Edwards Deming (October 14, 1900 – December 20, 1993) was an
3. Build Quality In – You Can’t Inspect it In
He
3. Build Quality In – You Can’t Inspect it In
He
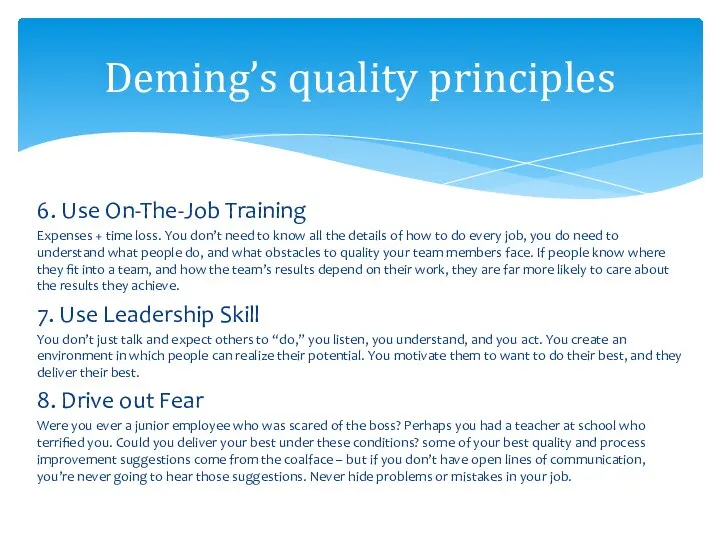
6. Use On-The-Job Training
Expenses + time loss. You don’t need to
6. Use On-The-Job Training
Expenses + time loss. You don’t need to
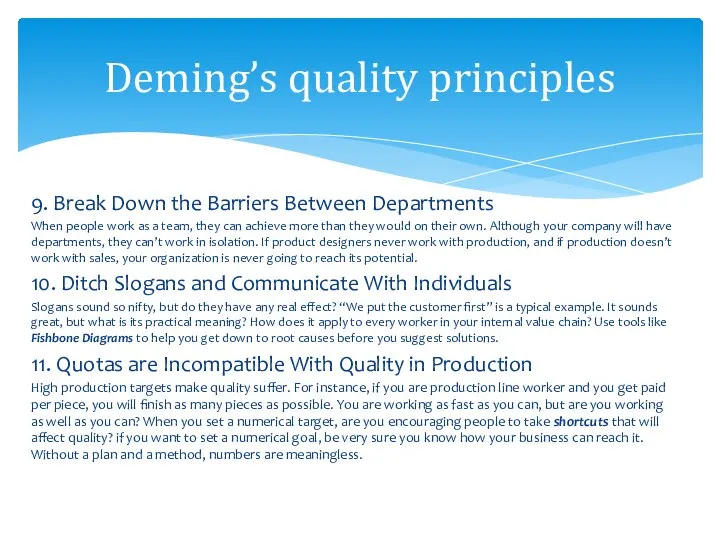
9. Break Down the Barriers Between Departments
When people work as a
9. Break Down the Barriers Between Departments
When people work as a
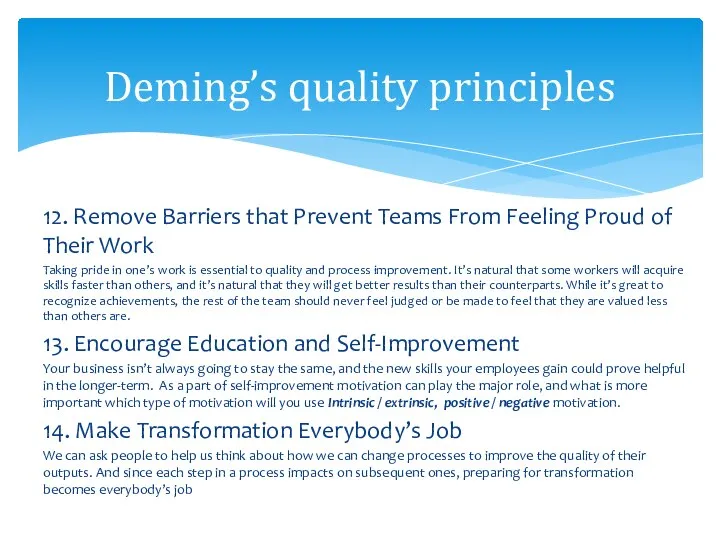
12. Remove Barriers that Prevent Teams From Feeling Proud of Their
12. Remove Barriers that Prevent Teams From Feeling Proud of Their
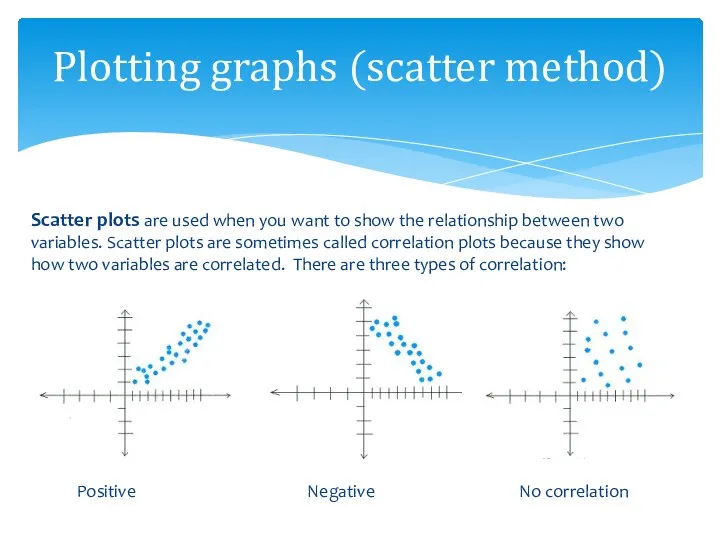
Scatter plots are used when you want to show the relationship
Scatter plots are used when you want to show the relationship
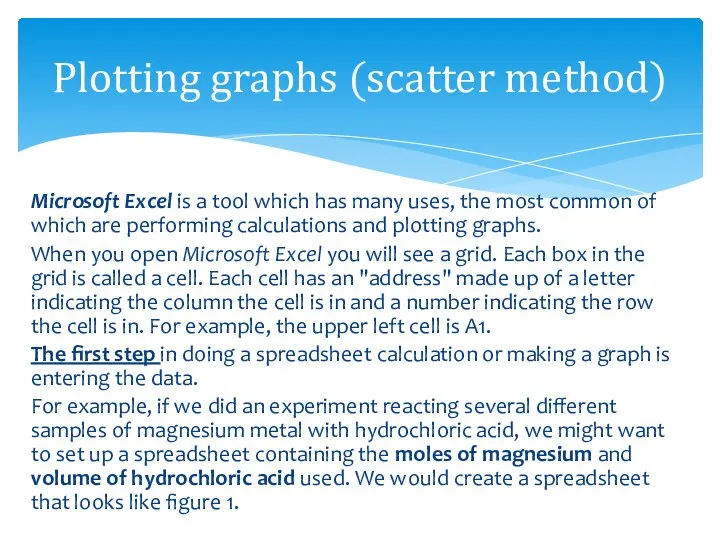
Microsoft Excel is a tool which has many uses, the most common
Microsoft Excel is a tool which has many uses, the most common
Plotting graphs (scatter method)
Plotting graphs (scatter method)
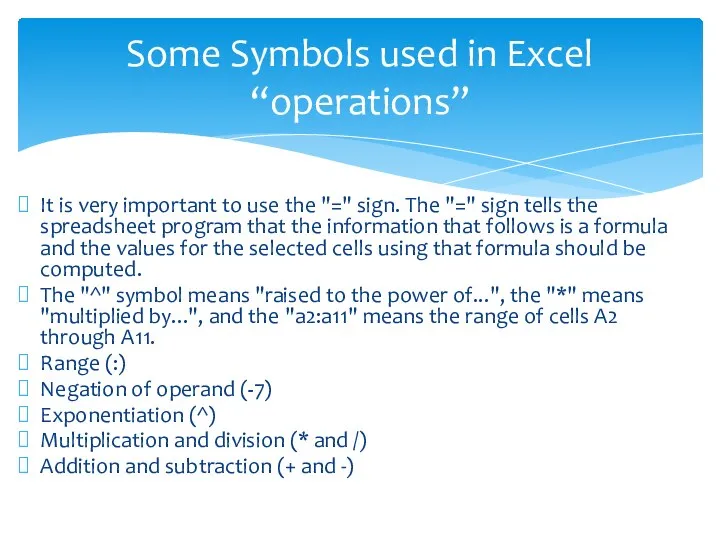
It is very important to use the "=" sign. The "="
It is very important to use the "=" sign. The "="
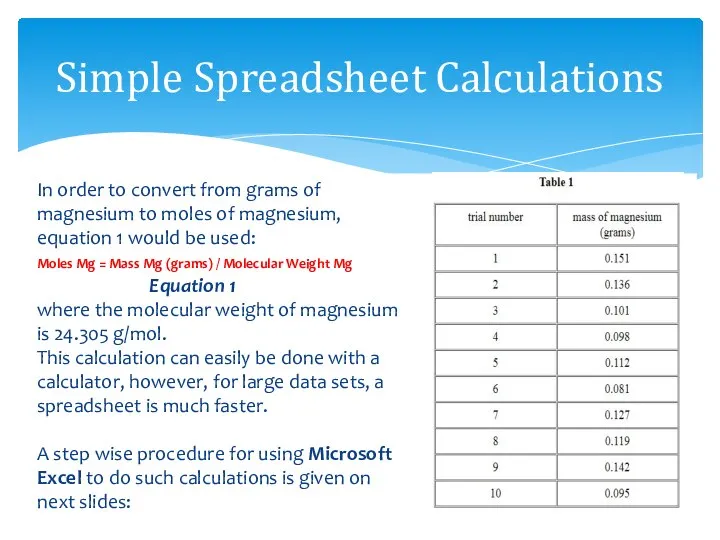
Simple Spreadsheet Calculations
Simple Spreadsheet Calculations
Simple Spreadsheet Calculations
Simple Spreadsheet Calculations

Simple Spreadsheet Calculations
Simple Spreadsheet Calculations
Plotting an X-Y Data Set
and SCATTER Graph
Plotting an X-Y Data Set
and SCATTER Graph
Plotting an X-Y Data Set
and SCATTER Graph
Plotting an X-Y Data Set
and SCATTER Graph
Plotting an X-Y Data Set
and SCATTER Graph
Plotting an X-Y Data Set
and SCATTER Graph
Plotting an X-Y Data Set
and SCATTER Graph
Plotting an X-Y Data Set
and SCATTER Graph
Plotting an X-Y Data Set
and SCATTER Graph
6. Click OK. A line, an equation,
Plotting an X-Y Data Set
and SCATTER Graph
6. Click OK. A line, an equation,
 Презентация на тему: «Покрова на Нерли» Работу выполнил ученик 8 «б» класса Плужников Владислав
 russian_federation
 Презентация "ИНДУСТРИАЛЬНЫЙ ПАРК «ОЗЁРЫ»" - скачать презентации по Экономике
 Электронное колье NeckTec: носимый компьютер будущего
 Предмет и объект психологии
 Муниципальное автономное дошкольное образовательное учреждение «Сказка»
  Судебное красноречие
 Выпускная квалификационная работа: Повышения эффективности организационно-экономического выбора поставщиков
 Mein Lieblingssänger heißt Mot
 Вебинары : новый инструмент коммуникаций 1. - презентация
 Основные принципы симметрии и законы сохранения физических величин Работу подготовила: Чернова Оксана Т-111
 Автоматическое устройство осуществило перекодировку информационного сообщения на русском языке
 Компьютерная часть. Разбор ИДЗ
 Управляемая эволюция SaaS Дмитрий Гончаренко, ПланФикс planfix.ru #planfix. - презентация
 Триггеры. (Лекция 6)
 Архитектура компьютера
 Презентация "Субъекты и объекты организационной деятельности" - скачать презентации по Экономике
 Формирование современной системы международных отношений
 ОТМП. Элементы и узлы ЭВМ. (Тема 2)
 Презентация Понятие и основные категории страхования
  Разработка веб-сайта компании Геотоп
 ВКР «Влияние занятий гимнастикой пилатес на развитие физических качеств, гибкости и силы у подростков 12-14 лет»
 Трассовый радиолокационный комплекс "Сопка-2". Режимы обзора и зоны обнаружения ПОРЛ ТРЛК "Сопка-2"
 Створення жіночого образу в стилі ДЕНДІ
 Готов к труду и обороне (ГТО)
 Конструкторско-технологическая подготовка производства модернизации привода главного движения станка модели 1к62
 Алгоритмическая структура ветвление на языке Visual Basic
 Теплопритоки к жидкому хладагенту. Лучистый теплообмен