- A Tour of the World

Содержание
- 2. 1-1 The Crisis Table 1-1 World Output Growth since 2000
- 3. 1-1 The Crisis Figure 1-1 Stock prices in the United States, the Euro area, and emerging
- 4. 1-1 The Crisis Figure 1-2 Unemployment rates in the United States and the Euro area, 2000–2012
- 5. 1-2 The United States Figure 1-3 The United States
- 6. 1-2 The United States Table 1-2 Growth, Unemployment, and Inflation in the United States, 1980–2012
- 7. 1-2 The United States Figure 1-4 U.S. Federal Budget surpluses as a percent of GDP since
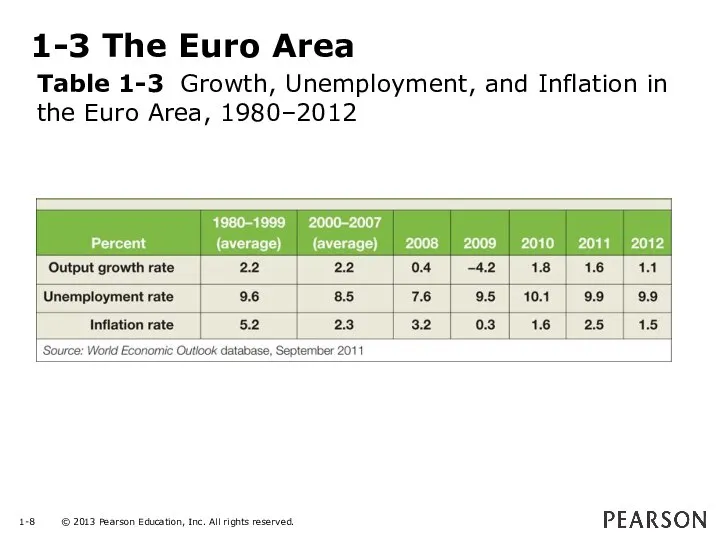
- 8. 1-3 The Euro Area Table 1-3 Growth, Unemployment, and Inflation in the Euro Area, 1980–2012
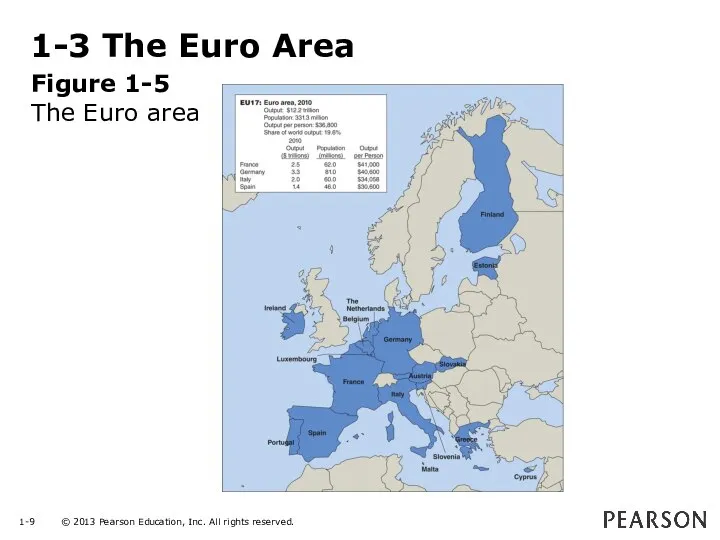
- 9. 1-3 The Euro Area Figure 1-5 The Euro area
- 10. 1-4 China Figure 1-6 China
- 12. Скачать презентацию
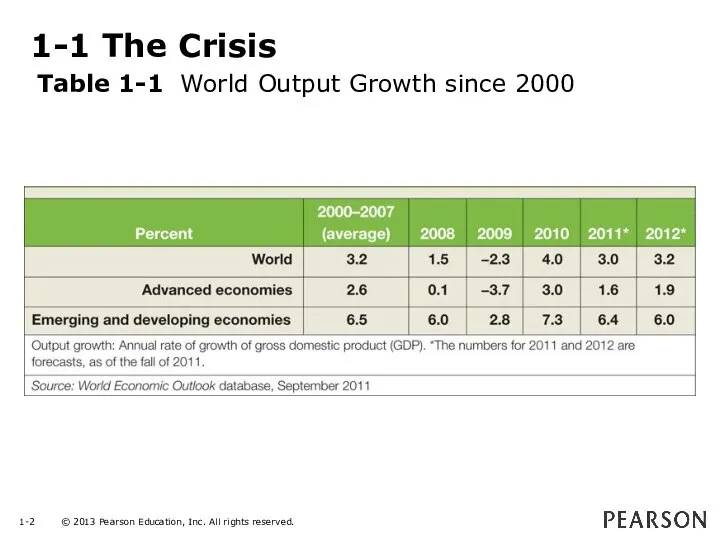
1-1 The Crisis
Table 1-1 World Output Growth since 2000
1-1 The Crisis
Table 1-1 World Output Growth since 2000
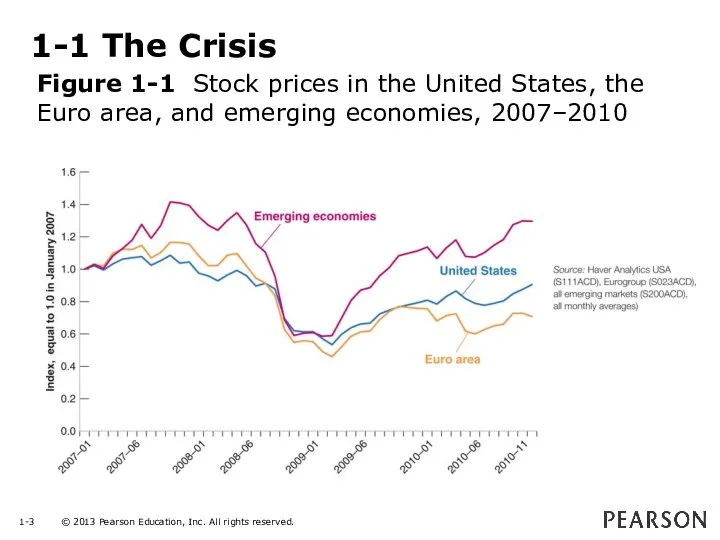
1-1 The Crisis
Figure 1-1 Stock prices in the United States, the
1-1 The Crisis
Figure 1-1 Stock prices in the United States, the
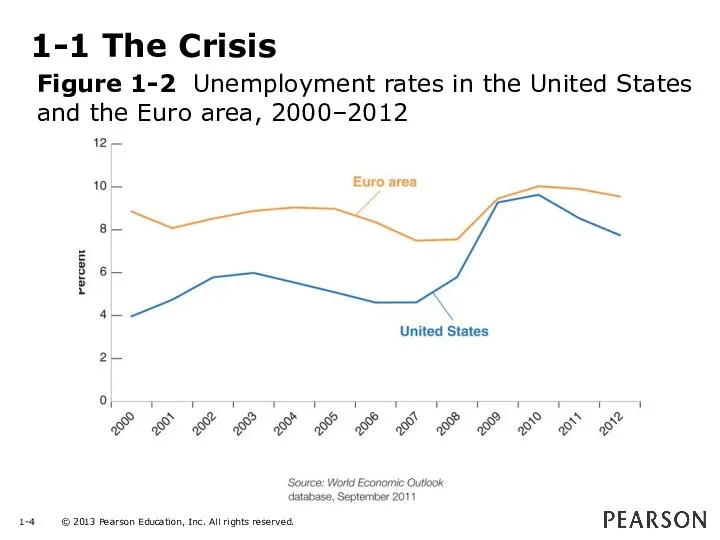
1-1 The Crisis
Figure 1-2 Unemployment rates in the United States and
1-1 The Crisis
Figure 1-2 Unemployment rates in the United States and
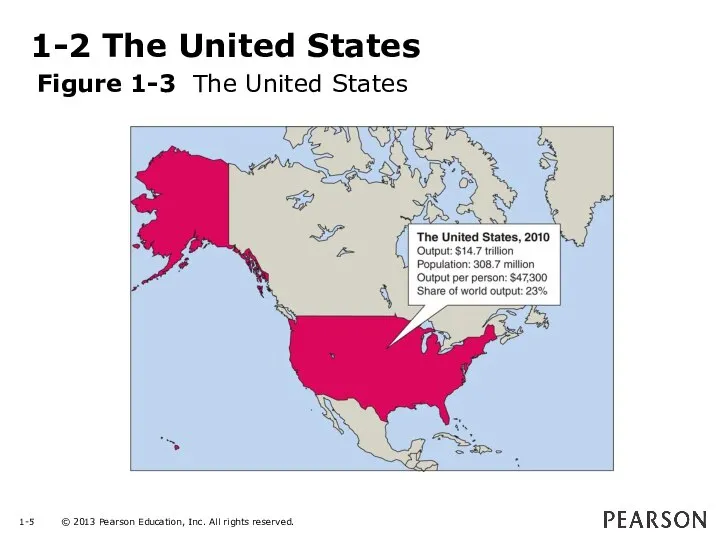
1-2 The United States
Figure 1-3 The United States
1-2 The United States
Figure 1-3 The United States
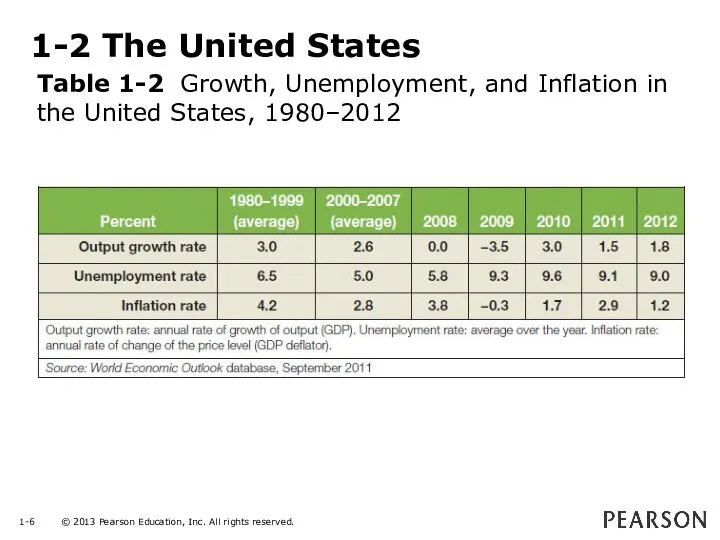
1-2 The United States
Table 1-2 Growth, Unemployment, and Inflation in the
1-2 The United States
Table 1-2 Growth, Unemployment, and Inflation in the
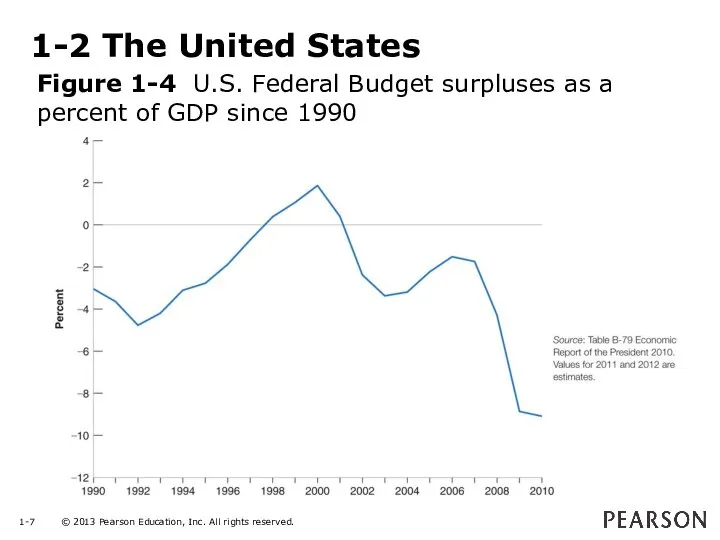
1-2 The United States
Figure 1-4 U.S. Federal Budget surpluses as a
1-2 The United States
Figure 1-4 U.S. Federal Budget surpluses as a
1-3 The Euro Area
Table 1-3 Growth, Unemployment, and Inflation in the
1-3 The Euro Area
Table 1-3 Growth, Unemployment, and Inflation in the
1-3 The Euro Area
Figure 1-5
The Euro area
1-3 The Euro Area
Figure 1-5
The Euro area
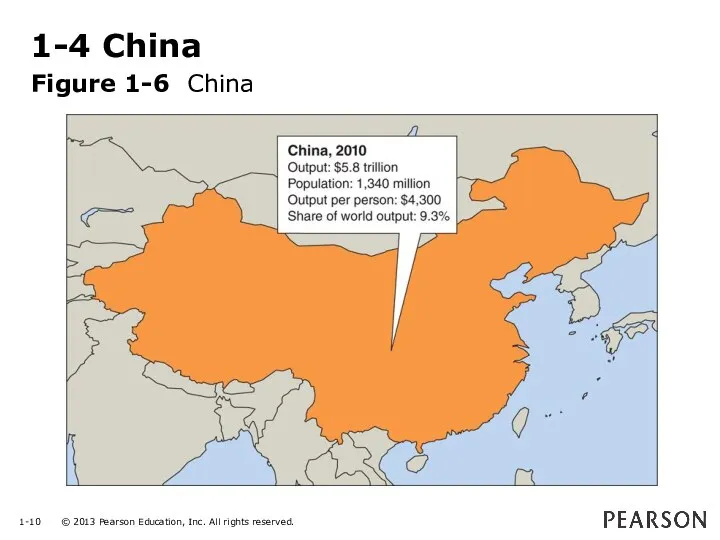
1-4 China
Figure 1-6 China
1-4 China
Figure 1-6 China
 Моделирование бизнес-процессов. Имитационное моделирование с помощью MATLAB. Циклы и кризисы. (Занятие 7)
 Metro Group. Системный анализ
 Рыночные реформы в экономике России конца XX века
 Методы экономических исследований. (Лекция 2)
 Штат и функции подразделений ППК «РЭО»
 Экономикадағы денсаулық сақтау рөлі
 Макроэкономическое равновесие: модель AD – AS
 Международная интеграция. Глобализация
 Классификация систем
 Сущность реструктуризации и ее основные этапы. Финансовая и производственная реструктуризация
 Chômage du Kazakhstan
 Международная организация труда
 Підприємство в системі ринкових відносин. (Лекція 1)
 Проблема ресурсов в современном обществе
 Механизм рыночного ценообразования
 Экономический эффект при использовании светодиодных ламп в первом корпусе ИЭК
 Нормативы для планирования подготовки производства
 Стоимостная оценка рисков
 Основные параметры инвестиционного проекта. Лекция 3. Инвестиционный анализ
 Итоги развития регионов в 2017 г. и новые вызовы. Тольятти на фоне других крупных городов страны
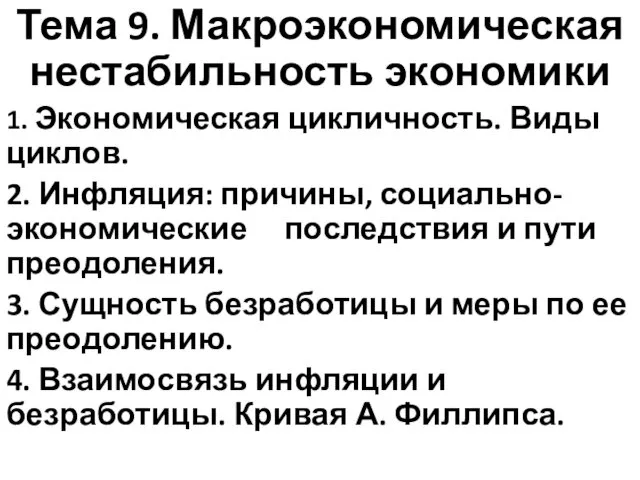 Макроэкономическая нестабильность экономики
 Проблемы миграции в современном мире
 Монополия и оценка потерь благосостояния в результате её деятельности. Лекция 8
 Решаем задание 10 по обществознанию. Практика
 АСКУЭ, как инструмент работы в условиях реформирования рынков энергоносителей
 Солнечные коллекторы
 Развитие сельского хозяйства в Нидерландах
 Кабельная система «Умный Дом»