- Capacity and Demand (Lecture # 10)

Содержание
- 2. A problem AUA average power consumption rate is: 75 kW. Large Auditorium Lighting ONLY takes: 120
- 3. Solution Answer: 75 kW? 120 kW? 195 kW? Or? Answer: Solve an optimization problem.
- 4. Capacity & Demand Investment is needed to add the physical Stock of Capital. Capital Stock =
- 5. Capacity & Demand Power shortage means: Peak demand > Installed capacity Energy shortage means: Not enough
- 6. Load curves Electric power demand = load Load curves, regular (periodic): Daily Weekly Seasonal Per shift,
- 7. Seasonal
- 8. Daily Peak Demand Annual Frequency Histogram
- 9. Daily
- 10. Capacity factor (CF) Actual Generated Energy CF = Energy Generated @ 100% Is it constant? It
- 11. Hydropower
- 12. Comparison
- 13. PV capacity factor 1kW of PV produces always annual amount kWhs equal to the monitoring amount:
- 14. Energy Shortage: Two Approaches Construction of new capacities - supply side. Conservation, Load leveling – demand
- 15. Peak vs. Average vs. Base AUA peak is: 75 kW? 120 kW? 195 kW? Or? Average
- 16. Countrywise Peak Average Base
- 17. Peak All powerplants, all generation capacities are operating. We are going to extreme measures: ALLOWING TO
- 18. Base Consumption never goes below certain amount Metsamor NPP is providing the base power.
- 20. 2011Ã.-Ç Ñ½áñáõÃÛ³Ý ¨ ¿É»Ïïñ³¿Ý»ñ·Ç³ÛÇ Ñ³ßí»ÏßÇé
- 21. ¾É»Ïïñ³¿Ý»ñ·Ç³ÛÇ Ñ³ßí»ÏßÇé
- 22. Average is in Between! Thus one needs: BASE, stabile, powerplants, e.g. Nuclear, Coal. CF > 90%;
- 24. Renewable Wind (CF Solar (CF
- 26. Load leveling is a method for reducing large fluctuations in power demand
- 27. Load Leveling - DSM Demand Side Management, the task is to decrease the demand at PEAK
- 28. Elasticity % Demand Change E(d) = % of Price Change
- 29. Load Leveling - SSM Supply Side Management, the task is to organize capacities to meet the
- 30. European policy In 2007, the EU was importing 82% of its oil and 57% of its
- 31. Energy Market
- 32. Dispatching
- 33. Storage Hydro-Pump Natural gas Thermal Hydrogen
- 34. Storage
- 35. Load levelling – pumped hydro storage
- 36. Load levelling – pumped hydro storage
- 37. RA gasification level ~94% Length of the main pipelines 14 050 km Number of gasified communities
- 38. Load levelling – EV fleet
- 40. Скачать презентацию
A problem
AUA average power consumption rate is:
75 kW.
Large Auditorium Lighting ONLY
A problem
AUA average power consumption rate is:
75 kW.
Large Auditorium Lighting ONLY
Solution
Answer:
75 kW?
120 kW?
195 kW?
Or?
Answer: Solve an optimization problem.
Solution
Answer:
75 kW?
120 kW?
195 kW?
Or?
Answer: Solve an optimization problem.
Capacity & Demand
Investment is needed to add the physical Stock of
Capacity & Demand
Investment is needed to add the physical Stock of
Capacity & Demand
Power shortage means:
Peak demand > Installed capacity
Energy shortage means:
Not
Capacity & Demand
Power shortage means:
Peak demand > Installed capacity
Energy shortage means:
Not
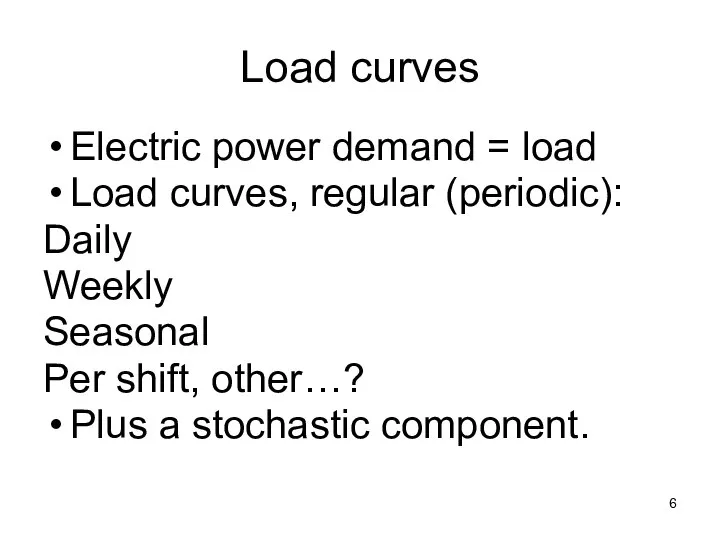
Load curves
Electric power demand = load
Load curves, regular (periodic):
Daily
Weekly
Seasonal
Per
Load curves
Electric power demand = load
Load curves, regular (periodic):
Daily
Weekly
Seasonal
Per
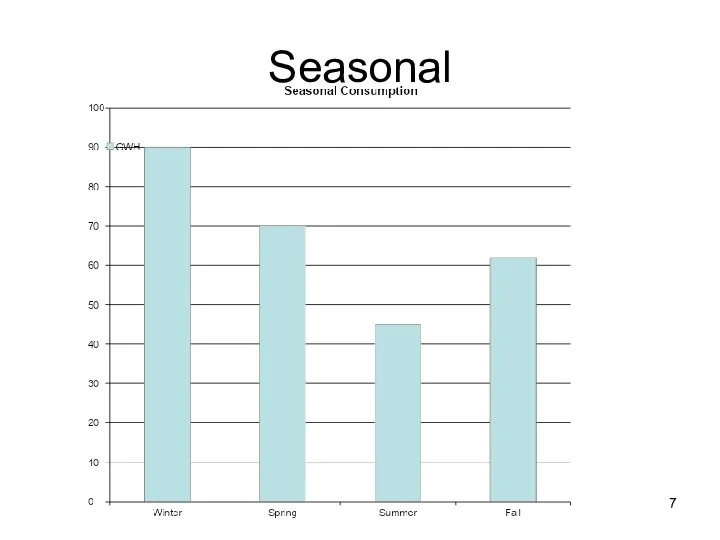
Seasonal
Seasonal
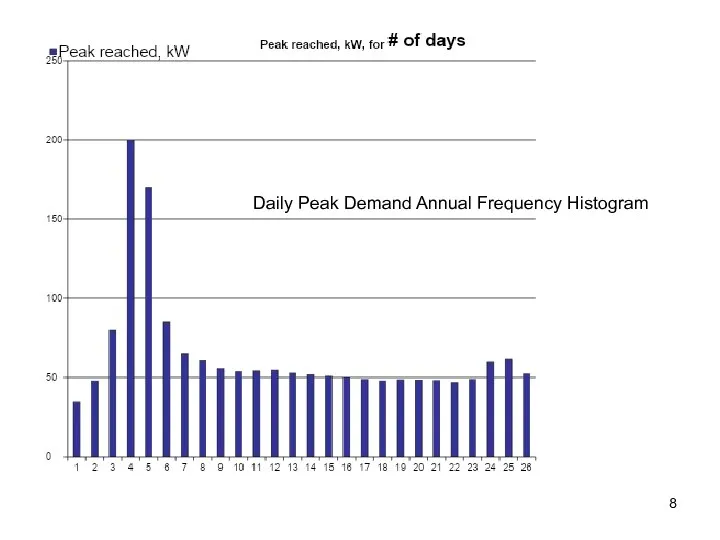
Daily Peak Demand Annual Frequency Histogram
Daily Peak Demand Annual Frequency Histogram
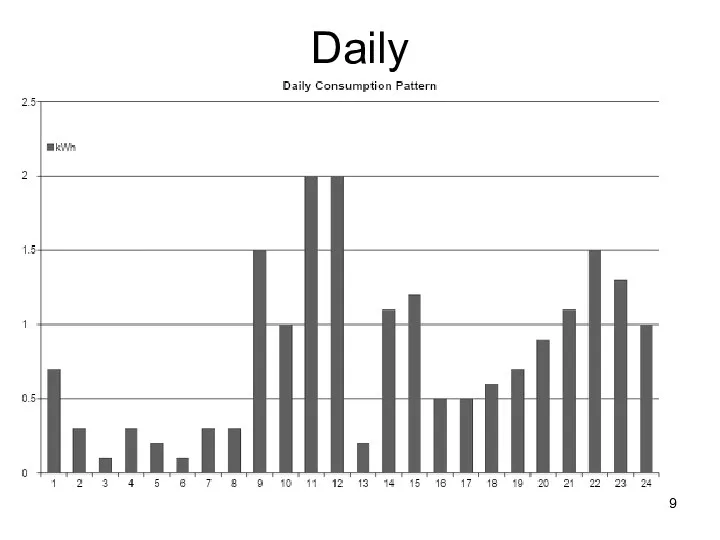
Daily
Daily
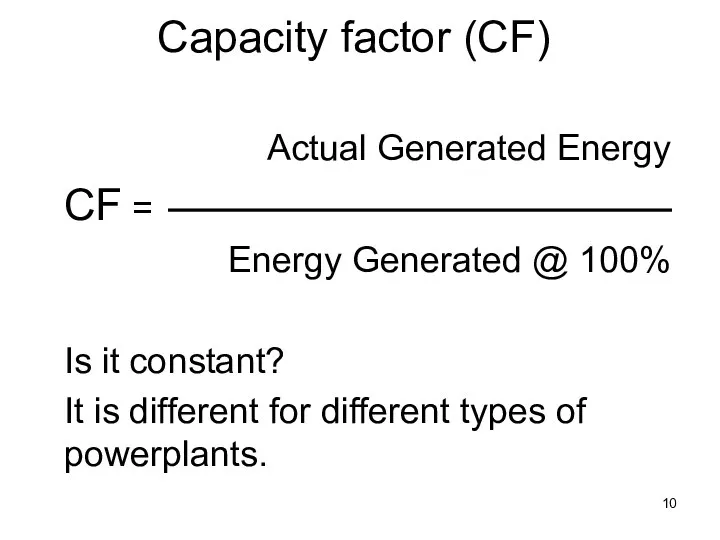
Capacity factor (CF)
Actual Generated Energy
CF =
Energy Generated @ 100%
Capacity factor (CF)
Actual Generated Energy
CF =
Energy Generated @ 100%
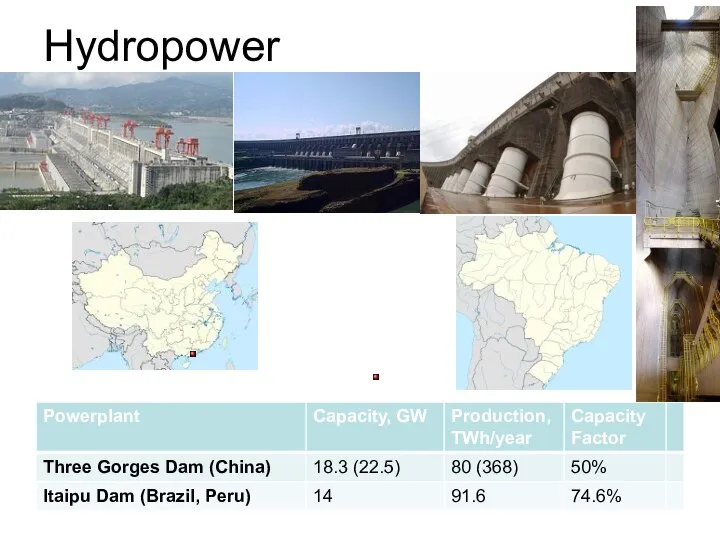
Hydropower
Hydropower
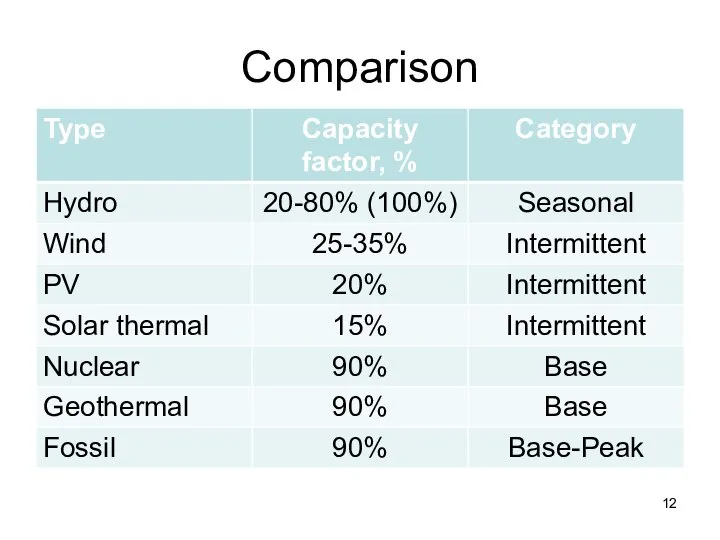
Comparison
Comparison
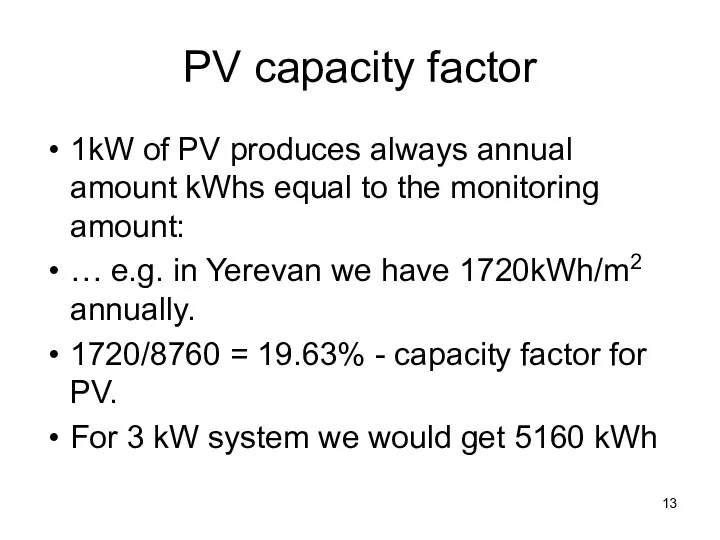
PV capacity factor
1kW of PV produces always annual amount kWhs equal
PV capacity factor
1kW of PV produces always annual amount kWhs equal
Energy Shortage:
Two Approaches
Construction of new capacities - supply side.
Conservation, Load
Energy Shortage:
Two Approaches
Construction of new capacities - supply side.
Conservation, Load
Peak vs. Average vs. Base
AUA peak is:
75 kW?
120 kW?
195
Peak vs. Average vs. Base
AUA peak is:
75 kW?
120 kW?
195
Countrywise
Peak
Average
Base
Countrywise
Peak
Average
Base
Peak
All powerplants, all generation capacities are operating.
We are going to extreme
Peak
All powerplants, all generation capacities are operating.
We are going to extreme
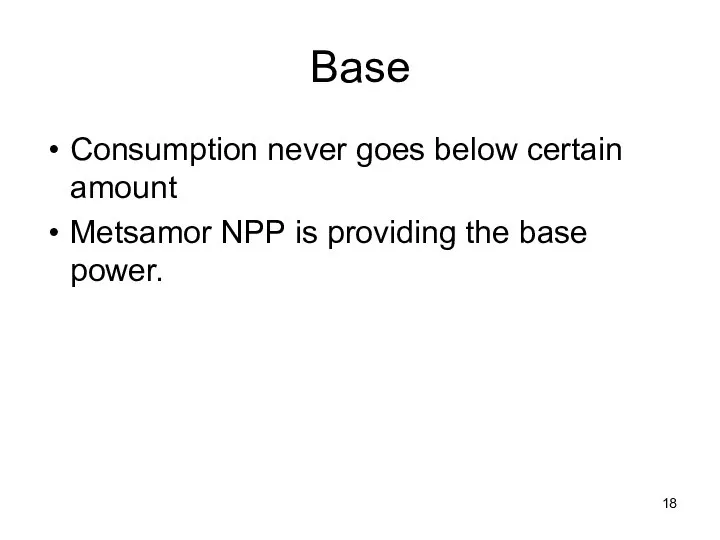
Base
Consumption never goes below certain amount
Metsamor NPP is providing the base
Base
Consumption never goes below certain amount
Metsamor NPP is providing the base
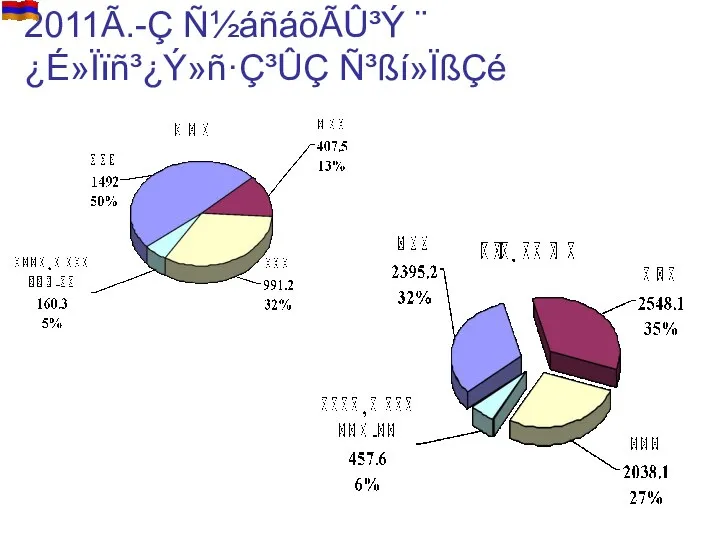
2011Ã.-Ç Ñ½áñáõÃÛ³Ý ¨
¿É»Ïïñ³¿Ý»ñ·Ç³ÛÇ Ñ³ßí»ÏßÇé
2011Ã.-Ç Ñ½áñáõÃÛ³Ý ¨
¿É»Ïïñ³¿Ý»ñ·Ç³ÛÇ Ñ³ßí»ÏßÇé
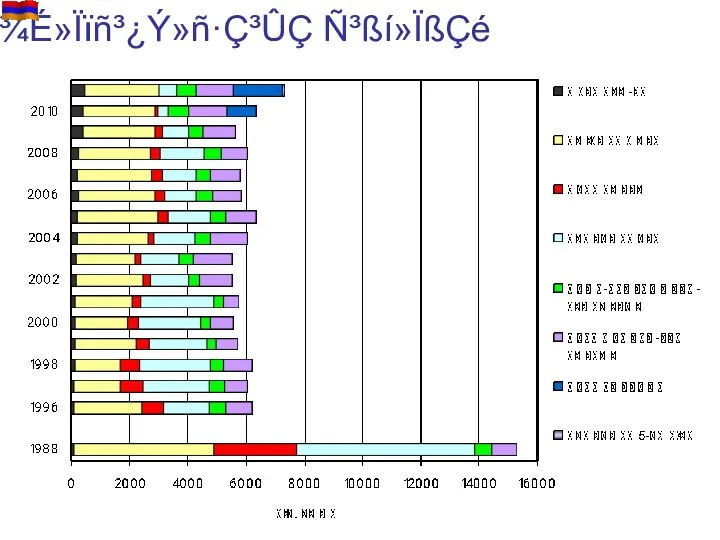
¾É»Ïïñ³¿Ý»ñ·Ç³ÛÇ Ñ³ßí»ÏßÇé
¾É»Ïïñ³¿Ý»ñ·Ç³ÛÇ Ñ³ßí»ÏßÇé
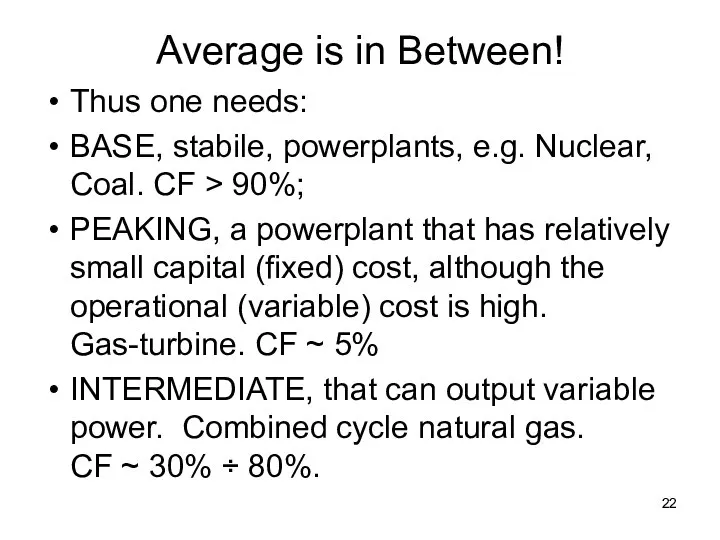
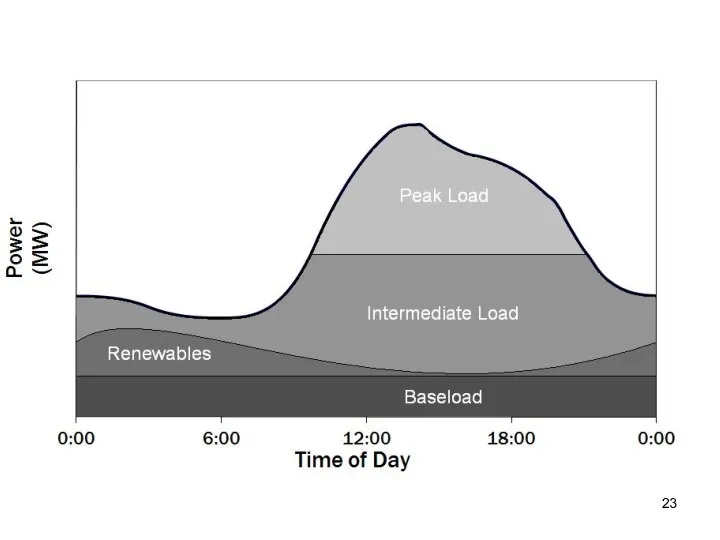
Average is in Between!
Thus one needs:
BASE, stabile, powerplants, e.g. Nuclear, Coal.
Average is in Between!
Thus one needs:
BASE, stabile, powerplants, e.g. Nuclear, Coal.

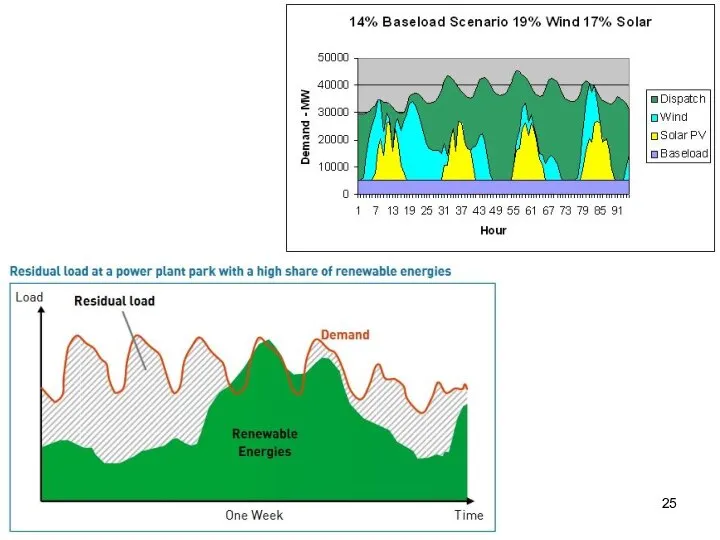
Renewable
Wind (CF <35%)
Solar (CF <25%)
Renewable
Wind (CF <35%)
Solar (CF <25%)
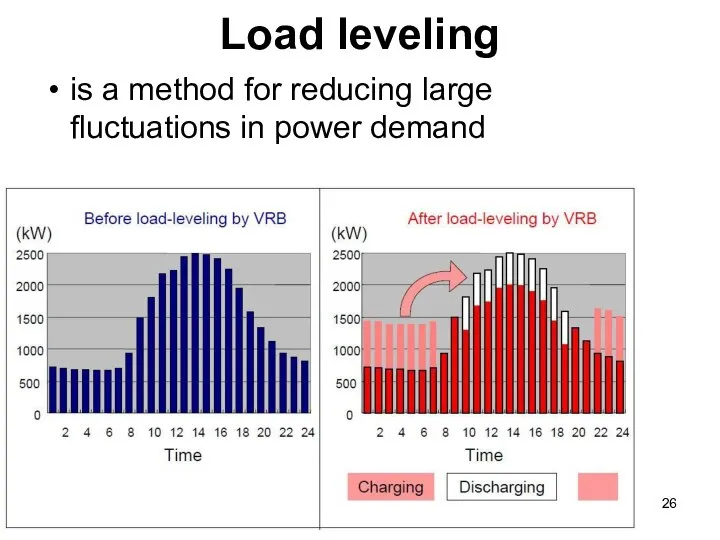
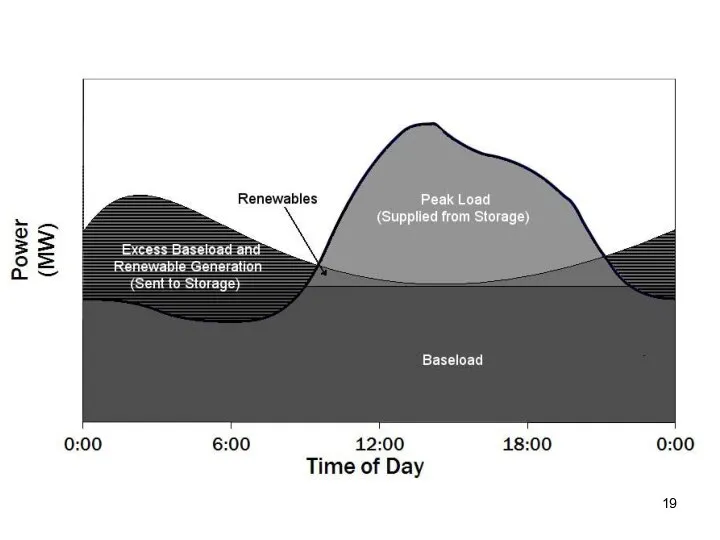
Load leveling
is a method for reducing large fluctuations in power
Load leveling
is a method for reducing large fluctuations in power
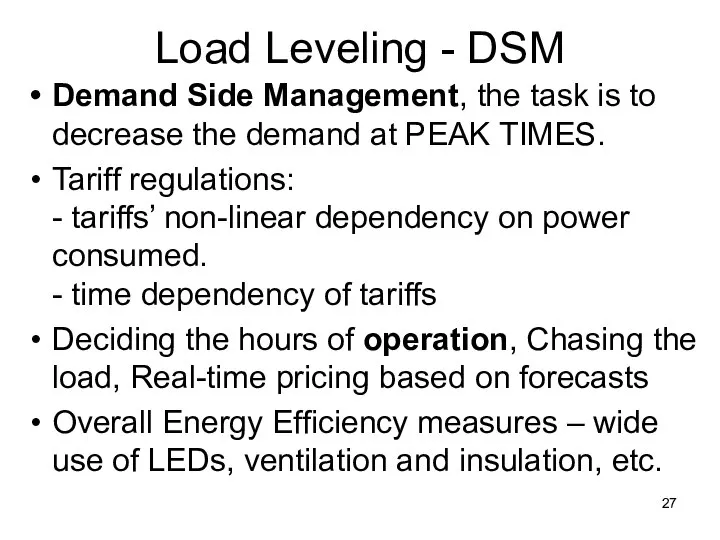
Load Leveling - DSM
Demand Side Management, the task is to decrease
Load Leveling - DSM
Demand Side Management, the task is to decrease
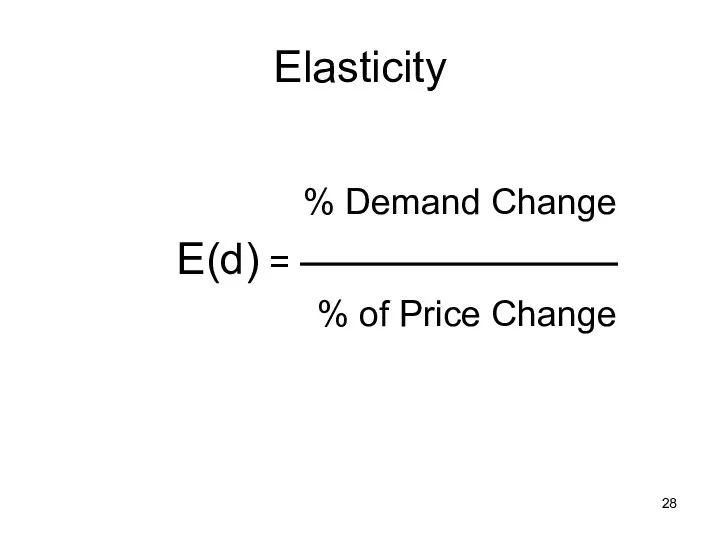
Elasticity
% Demand Change
E(d) =
% of Price Change
Elasticity
% Demand Change
E(d) =
% of Price Change
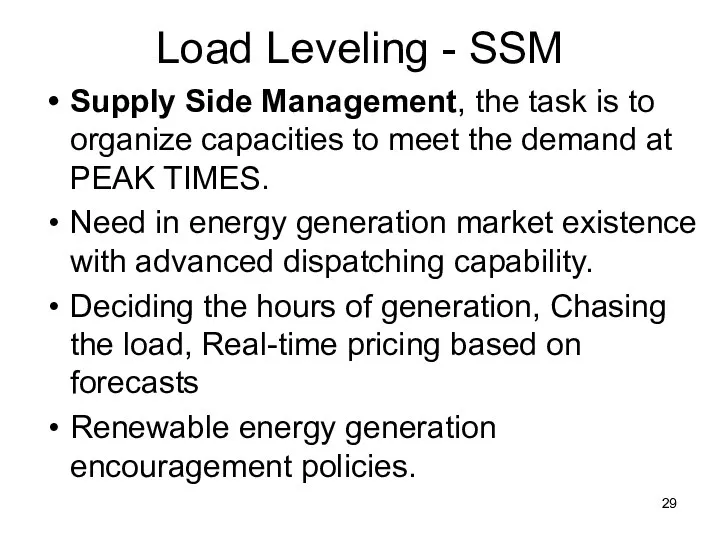
Load Leveling - SSM
Supply Side Management, the task is to organize
Load Leveling - SSM
Supply Side Management, the task is to organize

European policy
In 2007, the EU was importing 82% of its oil
European policy
In 2007, the EU was importing 82% of its oil
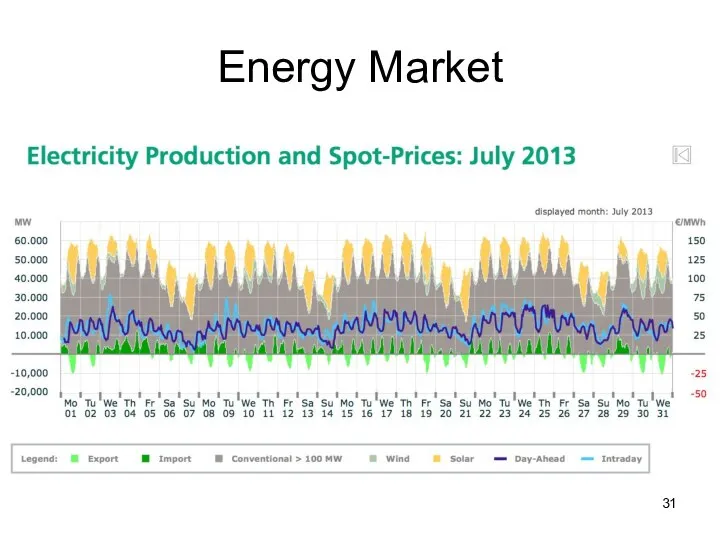
Energy Market
Energy Market
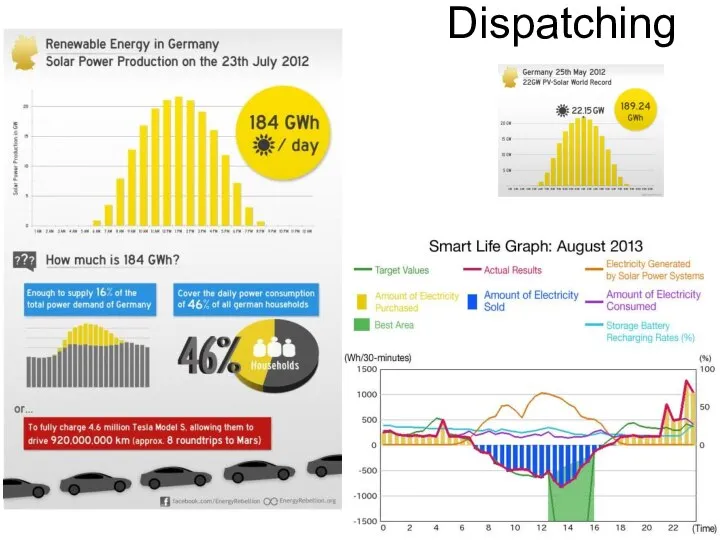
Dispatching
Dispatching
Storage
Hydro-Pump
Natural gas
Thermal
Hydrogen
Storage
Hydro-Pump
Natural gas
Thermal
Hydrogen

Storage
Storage
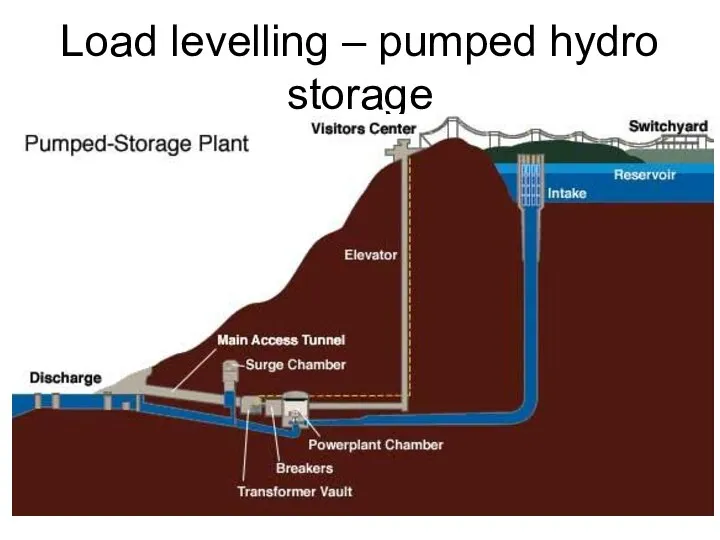
Load levelling – pumped hydro storage
Load levelling – pumped hydro storage
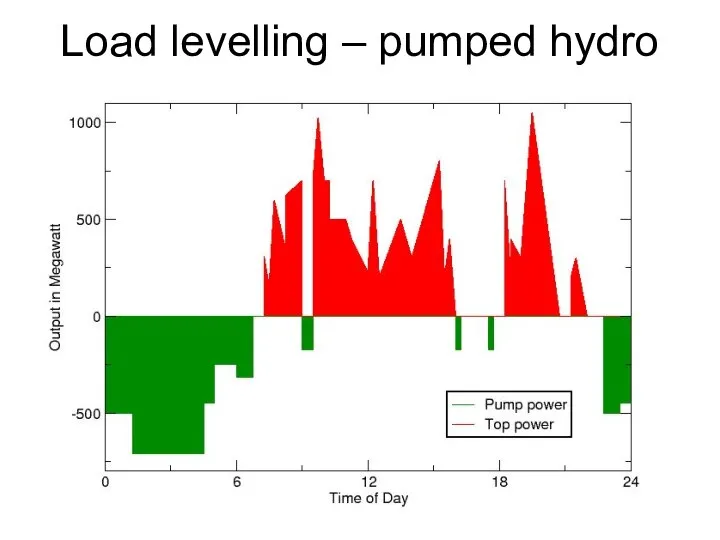
Load levelling – pumped hydro storage
Load levelling – pumped hydro storage
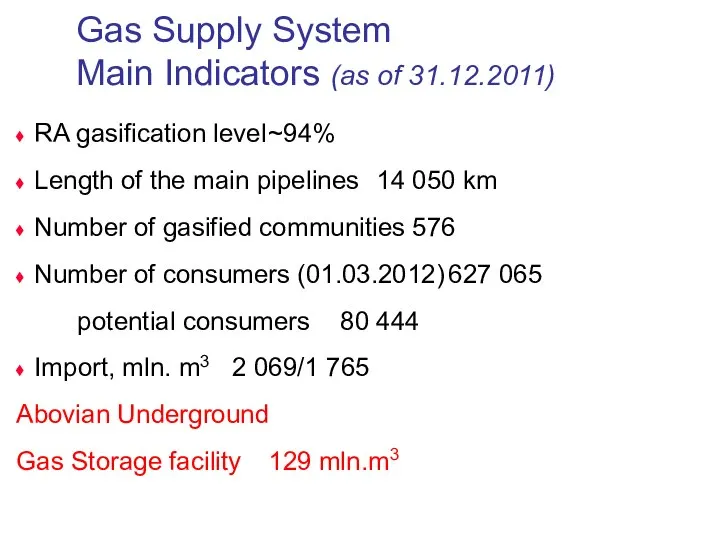
RA gasification level ~94%
Length of the main pipelines 14 050 km
Number of gasified
RA gasification level ~94%
Length of the main pipelines 14 050 km
Number of gasified
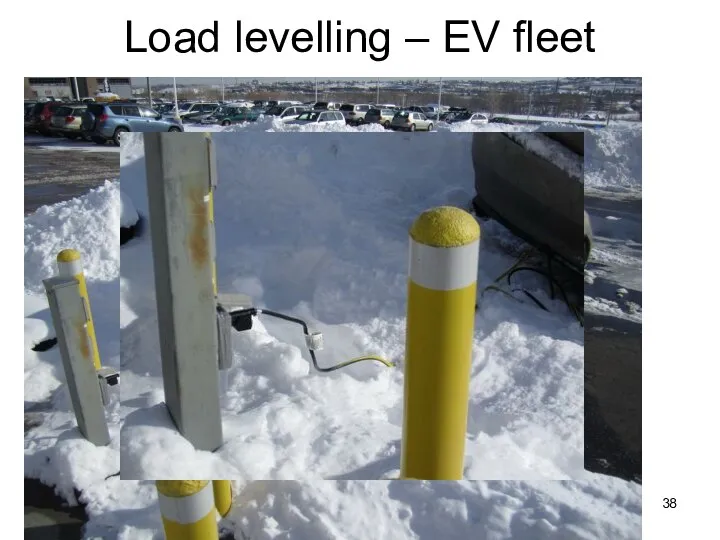
Load levelling – EV fleet
Load levelling – EV fleet
 Предмет макроэкономики и методы макроэкономического анализа
 Экономикалық теорияның пәні және зерттеу әдістері
 Общая характеристика рыночной экономики
 Сервисная деятельность как форма удовлетворения потребностей
 Экономика и её основные участники
 Экономический эффект базовых рабочих мест в технопарках
 Инфраструктурный комплекс
 Классификация видов, моделей, сегментов рынка труда
 Особенности стратегического анализа: PEST анализ
 Основы программного и проектного управления в развитии регионов
 Proiecte. Fonduri ne/rambursabile. Granturi. (Curs 5)
 Экономика предприятия
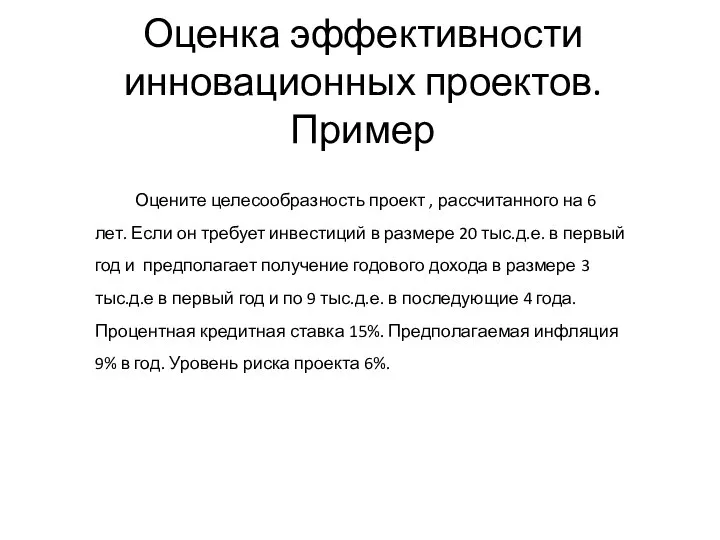 Оценка эффективности инновационных проектов. Пример
 Организмический подход в экономике
 Концепции макроэкономического равновесия
 Отраслевая структура машиностроения
 Модели макрорегиональной интеграции
 Бережливое производство
 Установление тарифов на использование объектов инженерной инфраструктуры, сетей водоснабжения и водоотведения
 Инвестиционный потенциал Кемеровской области
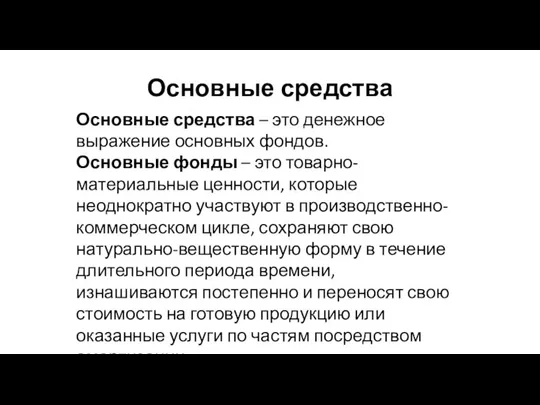 Основные средства
 Бюджетные отношения и основы бюджетной политики
 Приоритетные направления инновационного развития
 Рыночные структуры и конкуренция
 Составление экономико-географической характеристики одной из отраслей промышленности мира. Практическая работа
 Пример списания косвенных расходов на основное и вспомогательное производство организации
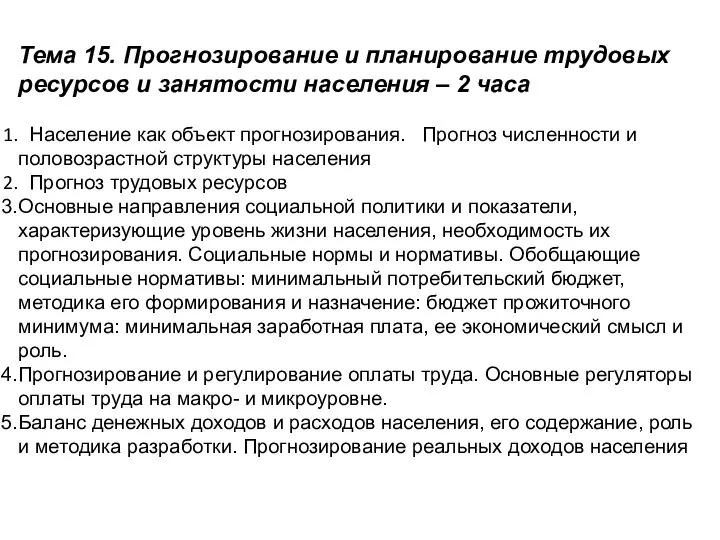 Прогнозирование и планирование трудовых ресурсов и занятости населения
 Роль государства в регулировании экономических процессов