- Republic of Rwanda: A Model of Reform-Driven, Market-Based, Sustainable Development

Содержание
- 2. Key Achievements over the last two decades Political stability, rule of law and zero tolerance for
- 3. 1. Country Overview
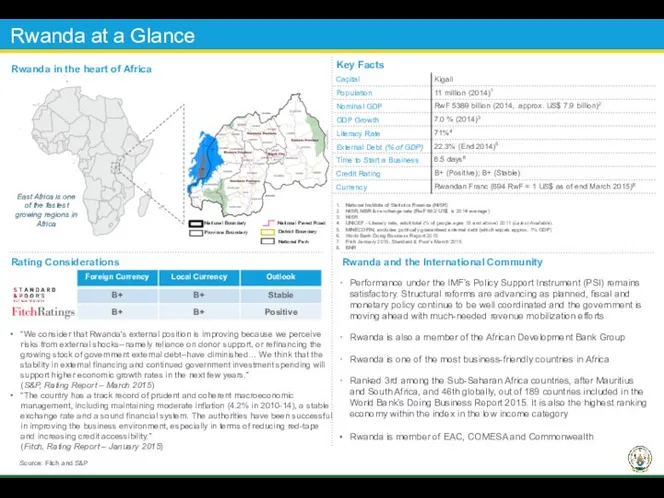
- 4. Rwanda at a Glance “We consider that Rwanda's external position is improving because we perceive risks
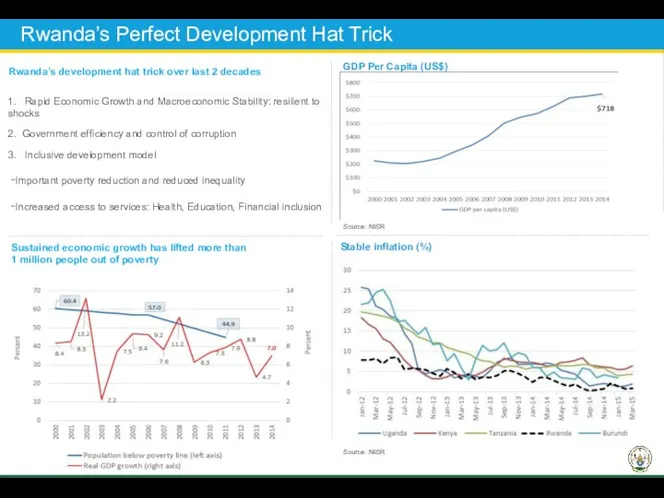
- 5. Rwanda’s Perfect Development Hat Trick GDP Per Capita (US$) Sustained economic growth has lifted more than
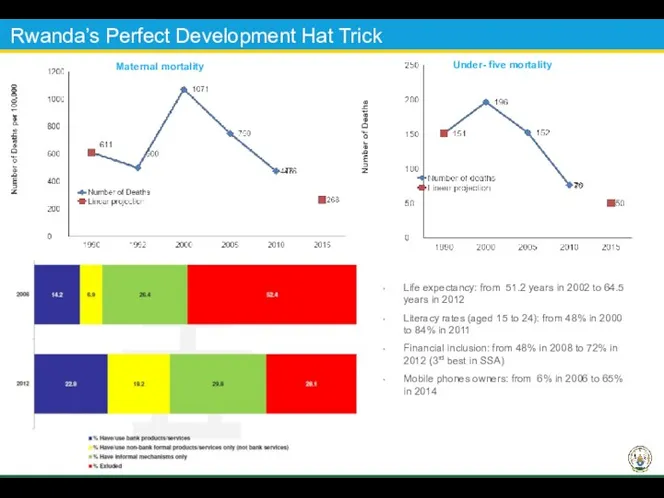
- 6. Rwanda’s Perfect Development Hat Trick Maternal mortality Under- five mortality Life expectancy: from 51.2 years in
- 7. 2. The Economy
- 8. Rwanda Has Been a Leader in Africa’s Economic Renaissance The Foundation of Rwanda’s Robust Growth Rwanda
- 9. Rwanda’s Recent Economic Developments GDP in 2014 The Rwandan economy grew by 7.0 percent in 2014,
- 10. Strong export growth: value has doubled in only 5 years Compound annual growth in exports is
- 11. Imports Support Growth Source: National Bank of Rwanda Source: National Bank of Rwanda Currently the main
- 12. Increased Imports Driving Balance of Payments At the end of 2014, Rwanda recorded a capital and
- 13. Rapid Expansion Of Revenues Underpins Improving Fiscal Position Domestic Revenue Collection (Multiplied 10-fold in a decade)
- 14. Stable Monetary Policy In June 2014, BNR adopted an accommodative monetary policy stance by cutting its
- 15. Banking Sector Supports Economic Growth Source: BNR . Banking Sector: key soundness indicators, in percent The
- 16. 3. Debt Management and Funding
- 17. Modest Government Debt Burden General Government Gross Debt (% of GDP) After reaching the completion point
- 18. Rwanda Debut Eurobond On April 25th 2013, Rwanda priced its debut $400mn RegS/144A, 10 years maturity
- 19. Building local Capital market through T-Bond Offerings
- 20. 4. Business Environment
- 21. Rwanda has a rank of 46 out of 189 economies worldwide. Rwanda’s ranking has improved rapidly
- 22. 5.The Road to Middle Income Status
- 24. Скачать презентацию
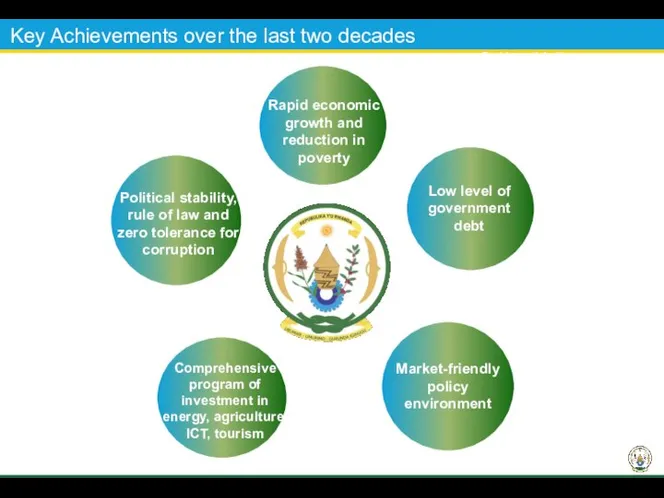
Key Achievements over the last two decades
Political stability, rule of law
Key Achievements over the last two decades
Political stability, rule of law

1. Country Overview
1. Country Overview
Rwanda at a Glance
“We consider that Rwanda's external position is improving
Rwanda at a Glance
“We consider that Rwanda's external position is improving
Rwanda’s Perfect Development Hat Trick
GDP Per Capita (US$)
Sustained economic growth has
Rwanda’s Perfect Development Hat Trick
GDP Per Capita (US$)
Sustained economic growth has
Rwanda’s Perfect Development Hat Trick
Maternal mortality
Under- five mortality
Life expectancy: from 51.2
Rwanda’s Perfect Development Hat Trick
Maternal mortality
Under- five mortality
Life expectancy: from 51.2

2. The Economy
2. The Economy
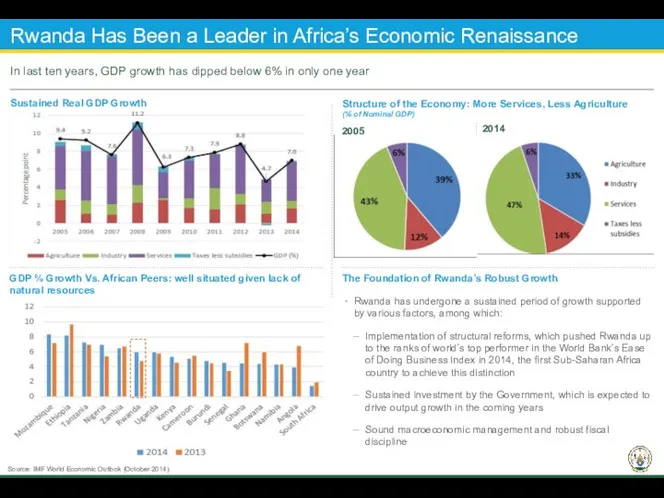
Rwanda Has Been a Leader in Africa’s Economic Renaissance
The Foundation of
Rwanda Has Been a Leader in Africa’s Economic Renaissance
The Foundation of
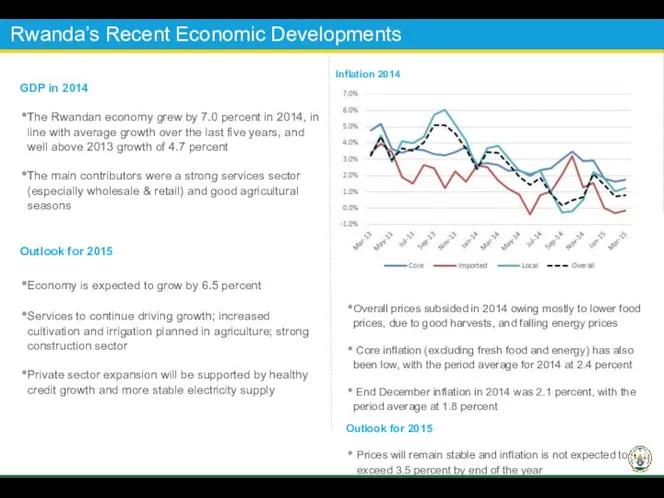
Rwanda’s Recent Economic Developments
GDP in 2014
The Rwandan economy grew by 7.0
Rwanda’s Recent Economic Developments
GDP in 2014
The Rwandan economy grew by 7.0
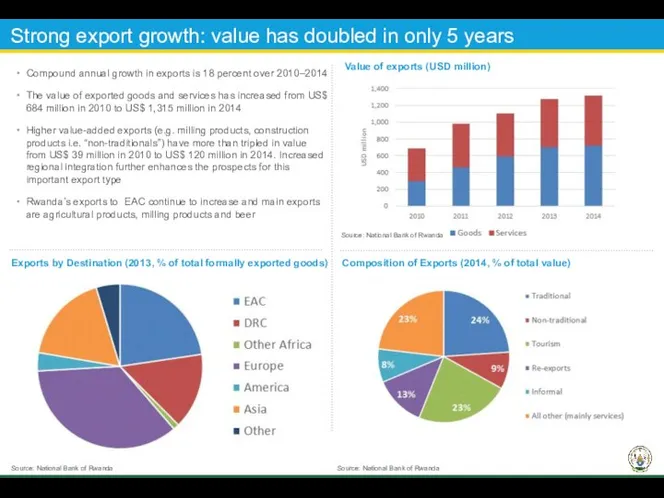
Strong export growth: value has doubled in only 5 years
Compound annual
Strong export growth: value has doubled in only 5 years
Compound annual
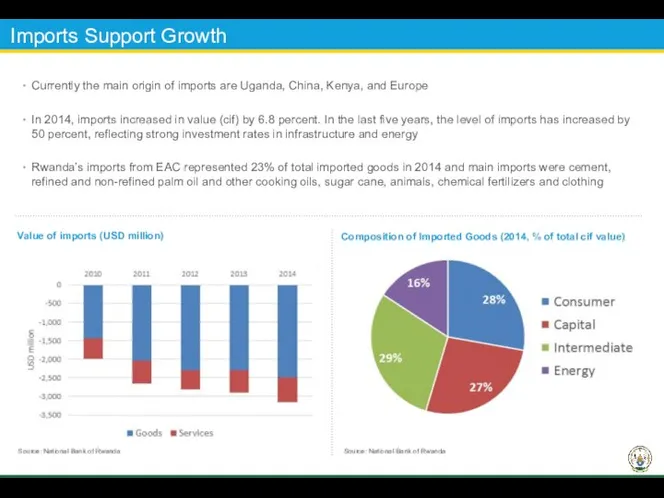
Imports Support Growth
Source: National Bank of Rwanda
Source: National Bank of
Imports Support Growth
Source: National Bank of Rwanda
Source: National Bank of
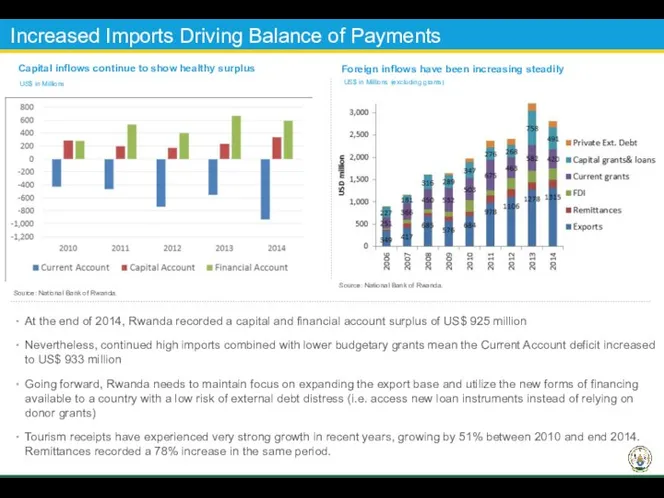
Increased Imports Driving Balance of Payments
At the end of 2014, Rwanda
Increased Imports Driving Balance of Payments
At the end of 2014, Rwanda

Rapid Expansion Of Revenues Underpins Improving Fiscal Position
Domestic Revenue Collection (Multiplied
Rapid Expansion Of Revenues Underpins Improving Fiscal Position
Domestic Revenue Collection (Multiplied
Stable Monetary Policy
In June 2014, BNR adopted an accommodative monetary policy
Stable Monetary Policy
In June 2014, BNR adopted an accommodative monetary policy

Banking Sector Supports Economic Growth
Source: BNR
.
Banking Sector: key soundness indicators,
Banking Sector Supports Economic Growth
Source: BNR
.
Banking Sector: key soundness indicators,

3. Debt Management and Funding
3. Debt Management and Funding
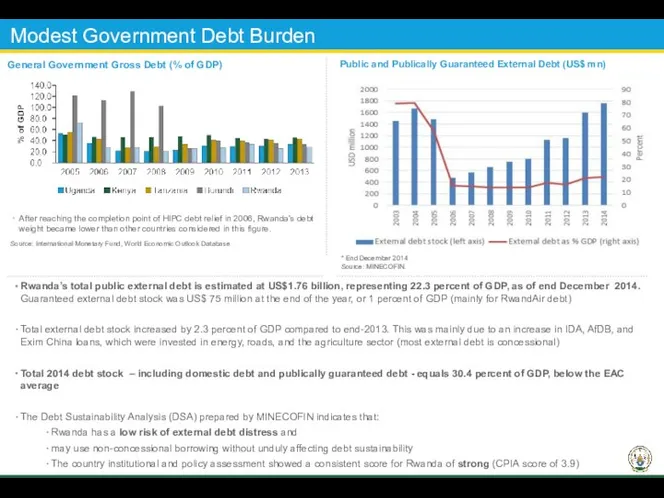
Modest Government Debt Burden
General Government Gross Debt (% of GDP)
After reaching
Modest Government Debt Burden
General Government Gross Debt (% of GDP)
After reaching
Rwanda Debut Eurobond
On April 25th 2013, Rwanda priced its debut $400mn
Rwanda Debut Eurobond
On April 25th 2013, Rwanda priced its debut $400mn
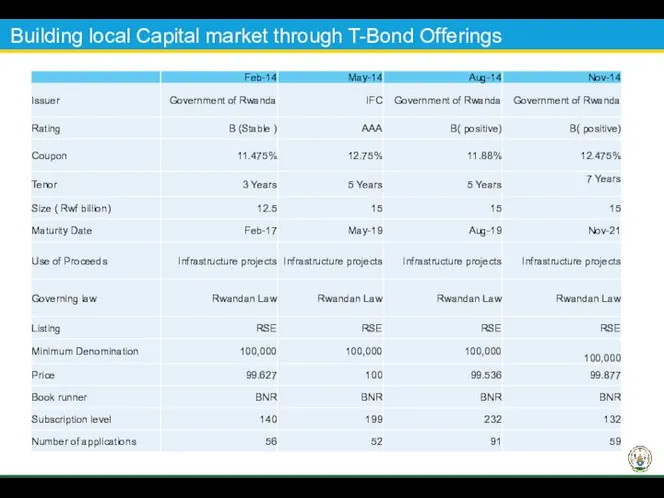
Building local Capital market through T-Bond Offerings
Building local Capital market through T-Bond Offerings

4. Business Environment
4. Business Environment
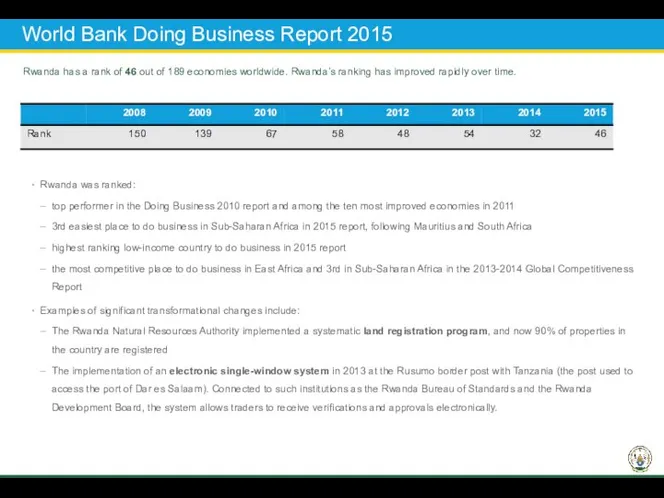
Rwanda has a rank of 46 out of 189 economies worldwide.
Rwanda has a rank of 46 out of 189 economies worldwide.
5.The Road to Middle Income Status
5.The Road to Middle Income Status
 Theoretical framework, objectives and principles of competition
 Анализ дебиторской задолженности (на примере ООО «Антратэк»)
 Микроэкономика. Фирма в рыночной экономике. (Лекция 3)
 Оценка экономической эффективности деятельности предприятия и пути ее повышения (на предприятии ООО «Практика Центр»)
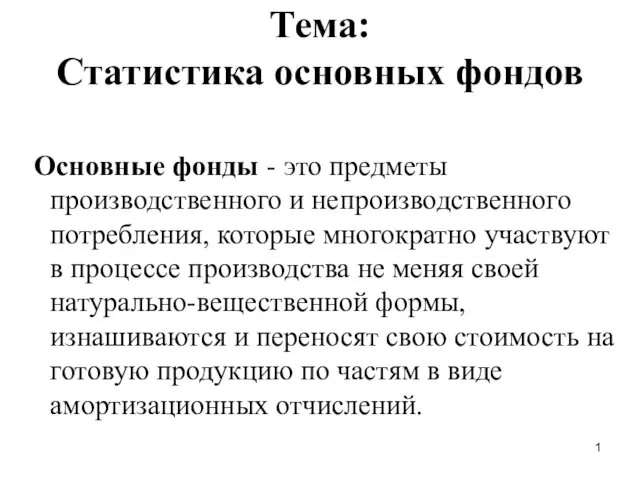 Статистика основных фондов
 Торгово-экономические отношения Республики Беларусь и Российской Федерации
 Геошоу. Порецкий район
 Подготовка внутренних аудиторов систем энергоменеджмента
 External Economies of Scale and the International Location of Production
 Экономика медиа: модели финансирования медиа
 Основы регионального управления экономикой
 Технические средства наноэлектроники. Нанолитография. (Тема 3.13.2)
 Значение, задачи и методический инструментарий экономического анализа
 Основные экономические показатели деятельности предприятия
 Трудовые ресурсы предприятия
 Развитие промышленности в Краснодарском крае
 Международный опыт создания ОЭЗ
 Контроллинг. Сущность и экономическое содержание контроллинга
 Государственная политика в период инфляции
 Социально-экономическое положение Иркутской области. Итоги I полугодия 2017 года
 Экономика и ее роль в жизни общества. (8 класс)
 Monopolistic competition. (Lecture 17)
 Местное самоуправление и его экономические основы. Государственная региональная политика. (Тема 3)
 EXPO-2017. Энергия - бұл адамзат тіршілігінің амуына жағдай жасаушы және ынталандырушы бірден-бір табиғи қайнар көз
 Предмет экономики
 Ярмарки і виставки. Міжнародний бізнес
 Mechanical engineering - leading branch of world economy
 Возникновение макроэкономики как науки. Предмет макроэкономики. Система макроэкономических целей