- The Basics of Supply and Demand

Содержание
- 2. ©2005 Pearson Education, Inc. Chapter 2 Introduction What are supply and demand? What is the market
- 3. ©2005 Pearson Education, Inc. Chapter 2 Supply and Demand Supply and demand analysis can: Help us
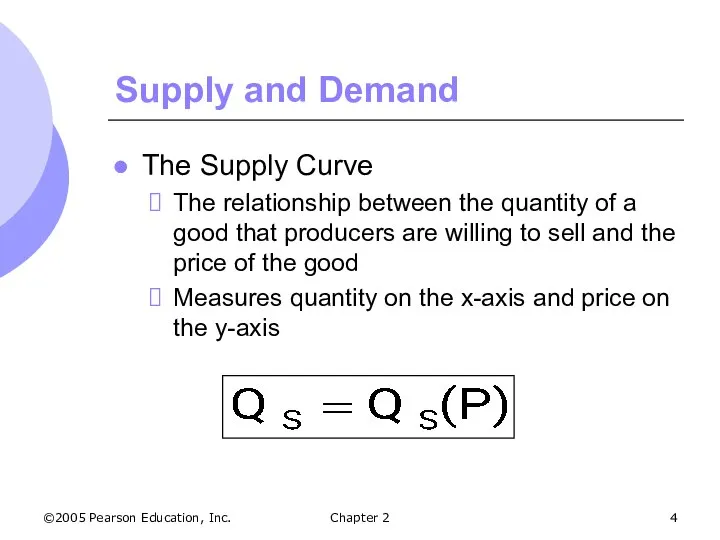
- 4. ©2005 Pearson Education, Inc. Chapter 2 Supply and Demand The Supply Curve The relationship between the
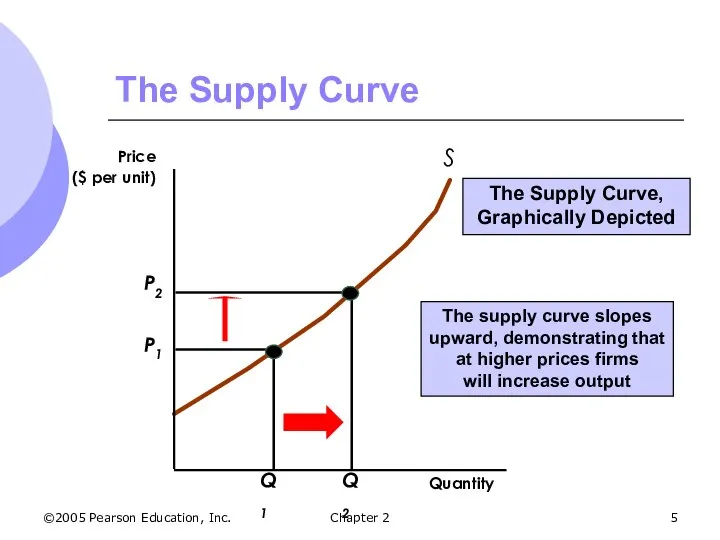
- 5. ©2005 Pearson Education, Inc. Chapter 2 The Supply Curve The supply curve slopes upward, demonstrating that
- 6. ©2005 Pearson Education, Inc. Chapter 2 The Supply Curve Other Variables Affecting Supply Costs of Production
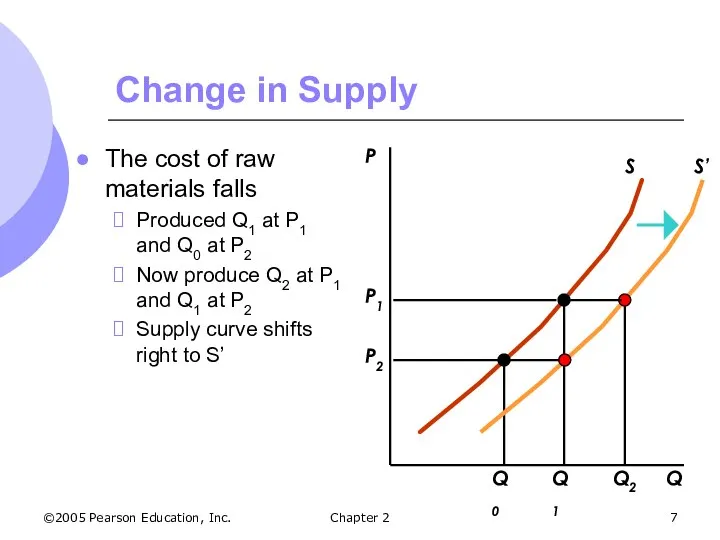
- 7. ©2005 Pearson Education, Inc. Chapter 2 Change in Supply The cost of raw materials falls Produced
- 8. ©2005 Pearson Education, Inc. Chapter 2 The Supply Curve Change in Quantity Supplied Movement along the
- 9. ©2005 Pearson Education, Inc. Chapter 2 Supply and Demand The Demand Curve The relationship between the
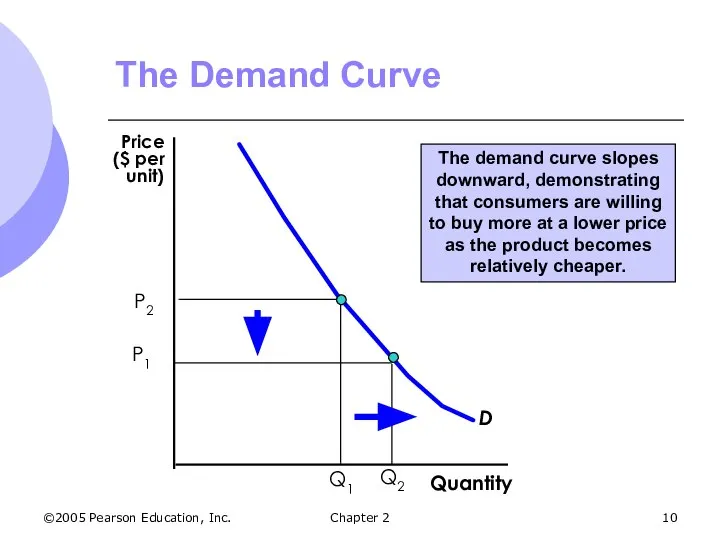
- 10. ©2005 Pearson Education, Inc. Chapter 2 The Demand Curve The demand curve slopes downward, demonstrating that
- 11. ©2005 Pearson Education, Inc. Chapter 2 The Demand Curve Other Variables Affecting Demand Income Increases in
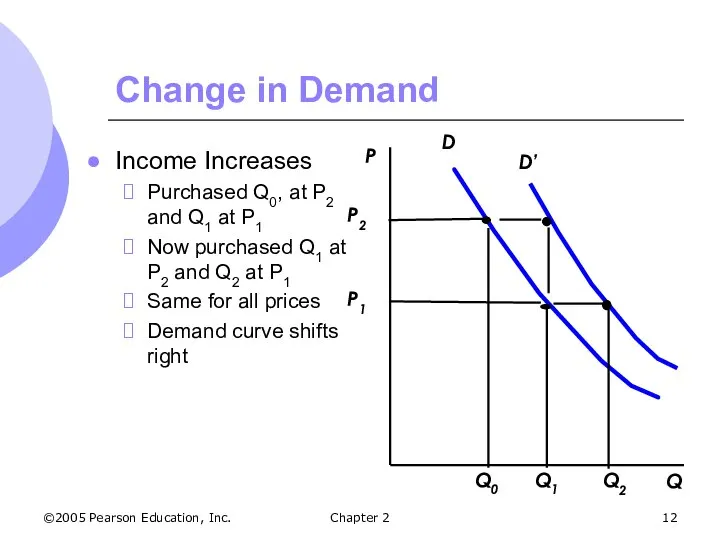
- 12. ©2005 Pearson Education, Inc. Chapter 2 Change in Demand Income Increases Purchased Q0, at P2 and
- 13. ©2005 Pearson Education, Inc. Chapter 2 The Demand Curve Changes in quantity demanded Movements along the
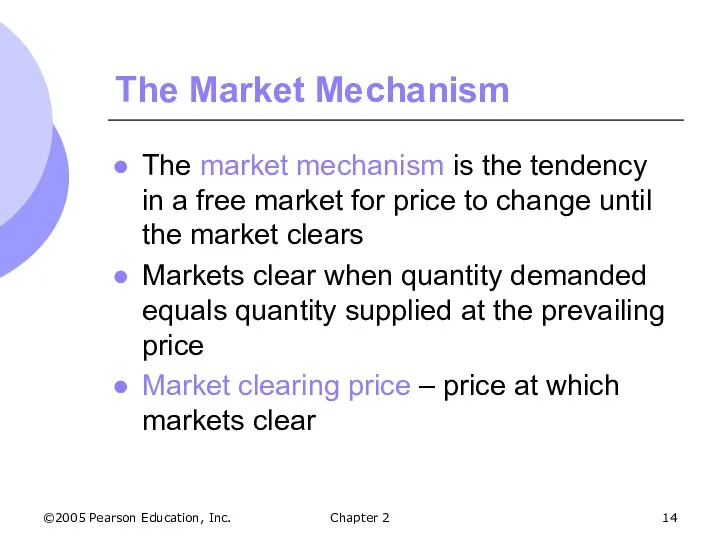
- 14. ©2005 Pearson Education, Inc. Chapter 2 The Market Mechanism The market mechanism is the tendency in
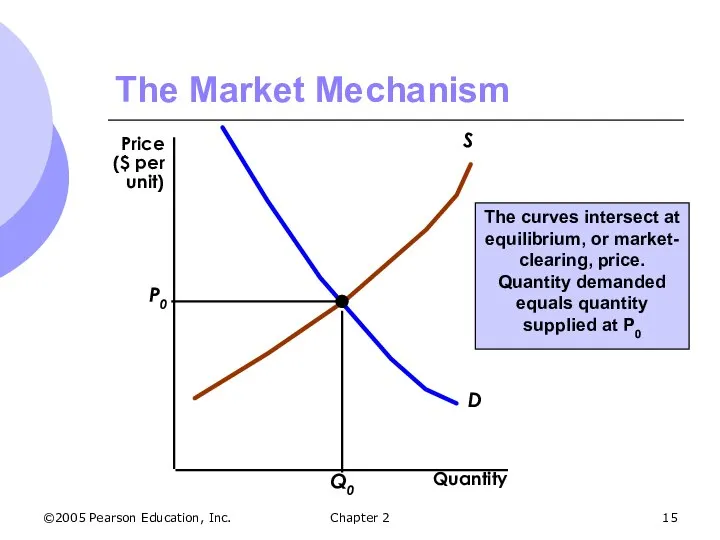
- 15. ©2005 Pearson Education, Inc. Chapter 2 The Market Mechanism The curves intersect at equilibrium, or market-
- 16. ©2005 Pearson Education, Inc. Chapter 2 The Market Mechanism In equilibrium There is no shortage or
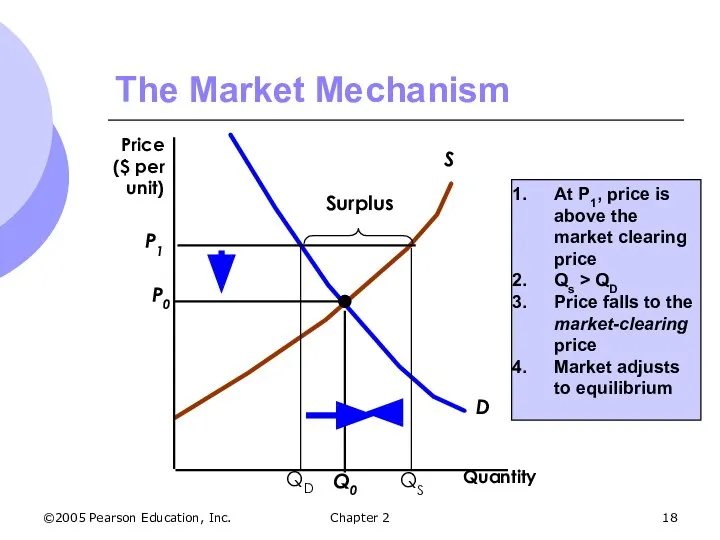
- 17. ©2005 Pearson Education, Inc. Chapter 2 Market Surplus1 The market price is above equilibrium There is
- 18. ©2005 Pearson Education, Inc. Chapter 2 The Market Mechanism At P1, price is above the market
- 19. ©2005 Pearson Education, Inc. Chapter 2 The Market Mechanism The market price is below equilibrium: There
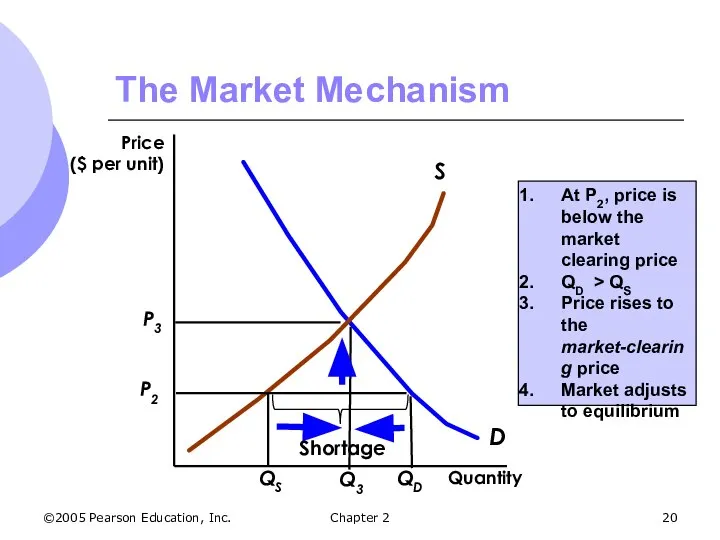
- 20. ©2005 Pearson Education, Inc. Chapter 2 The Market Mechanism At P2, price is below the market
- 21. ©2005 Pearson Education, Inc. Chapter 2 The Market Mechanism Supply and demand interact to determine the
- 22. ©2005 Pearson Education, Inc. Chapter 2 Changes in Market Equilibrium Equilibrium prices are determined by the
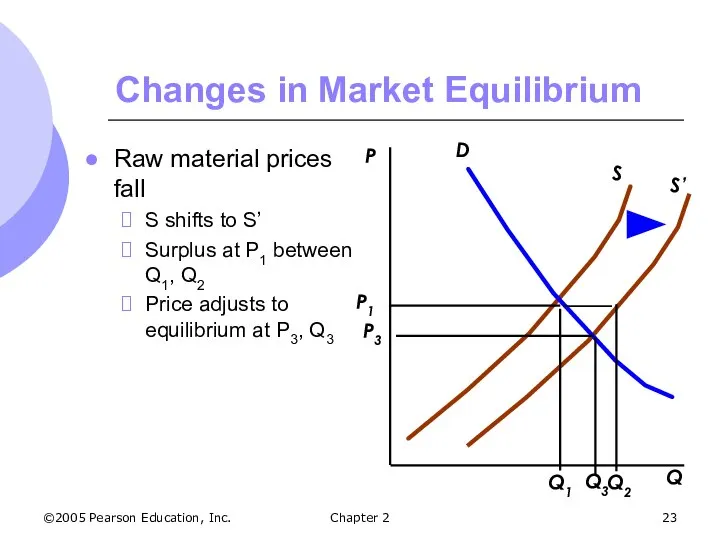
- 23. ©2005 Pearson Education, Inc. Chapter 2 Changes in Market Equilibrium Raw material prices fall S shifts
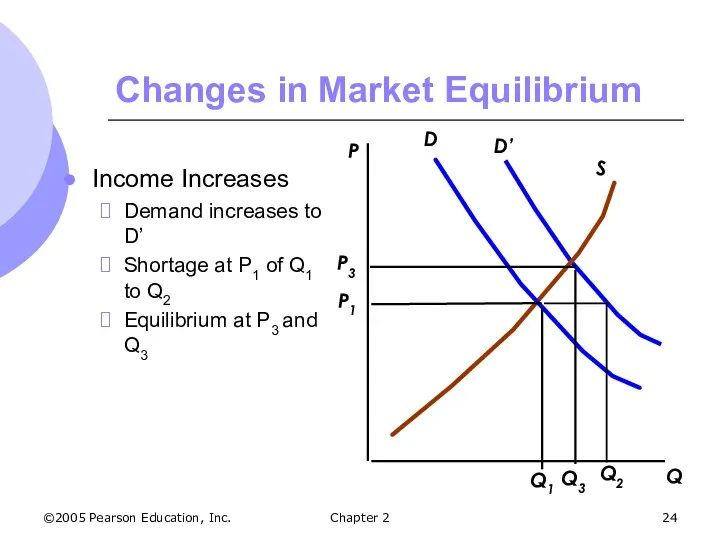
- 24. ©2005 Pearson Education, Inc. Chapter 2 Changes in Market Equilibrium Income Increases Demand increases to D’
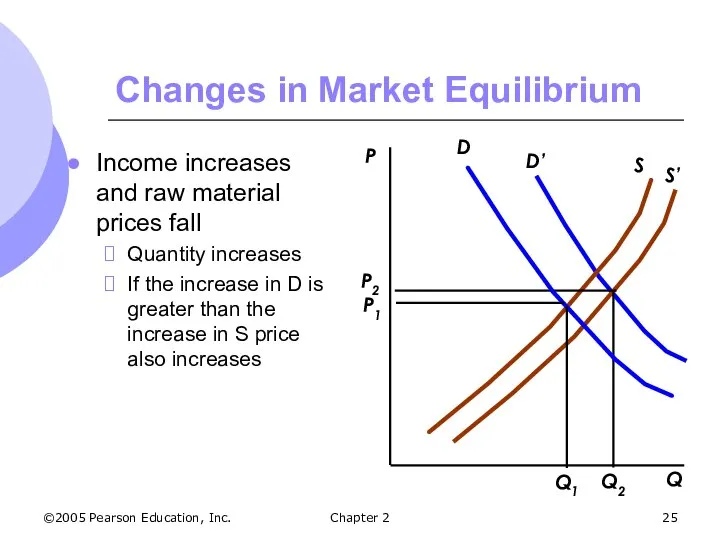
- 25. ©2005 Pearson Education, Inc. Chapter 2 Changes in Market Equilibrium Income increases and raw material prices
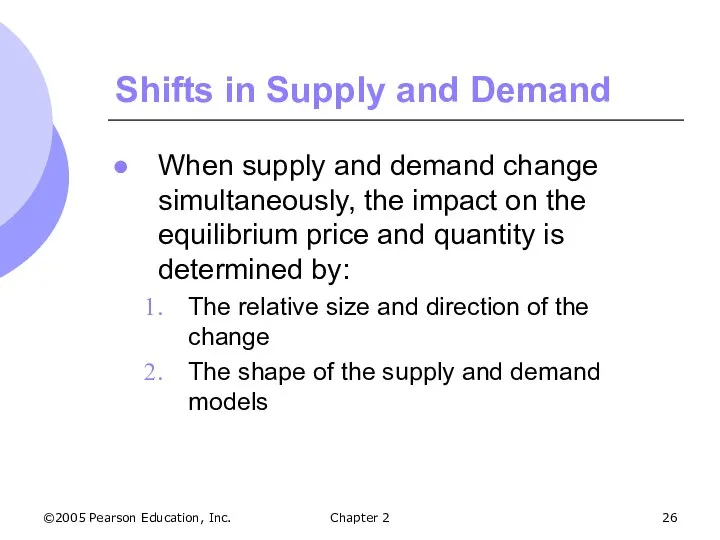
- 26. ©2005 Pearson Education, Inc. Chapter 2 Shifts in Supply and Demand When supply and demand change
- 27. ©2005 Pearson Education, Inc. Chapter 2 Elasticities of Supply and Demand Not only are we concerned
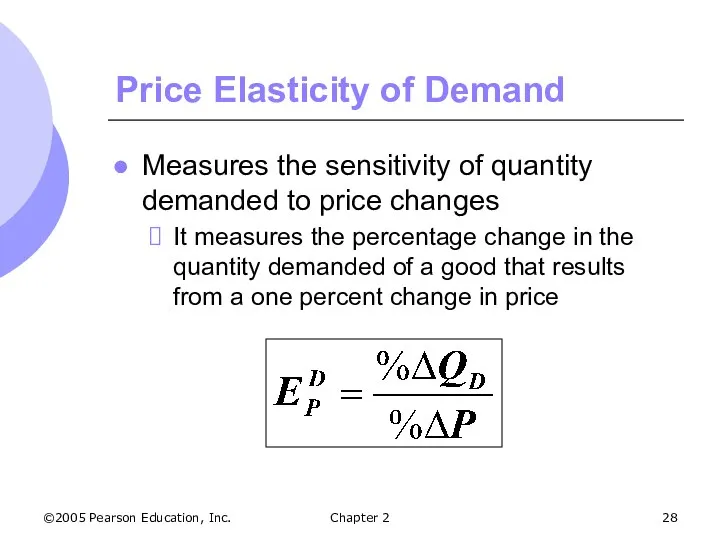
- 28. ©2005 Pearson Education, Inc. Chapter 2 Price Elasticity of Demand Measures the sensitivity of quantity demanded
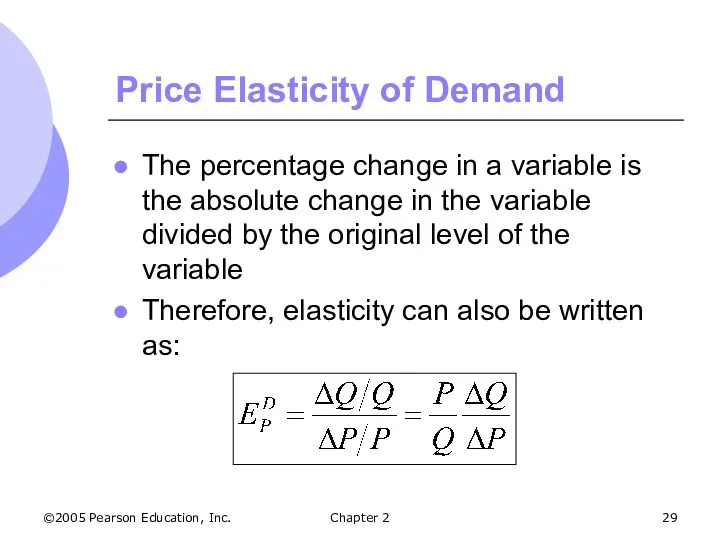
- 29. ©2005 Pearson Education, Inc. Chapter 2 Price Elasticity of Demand The percentage change in a variable
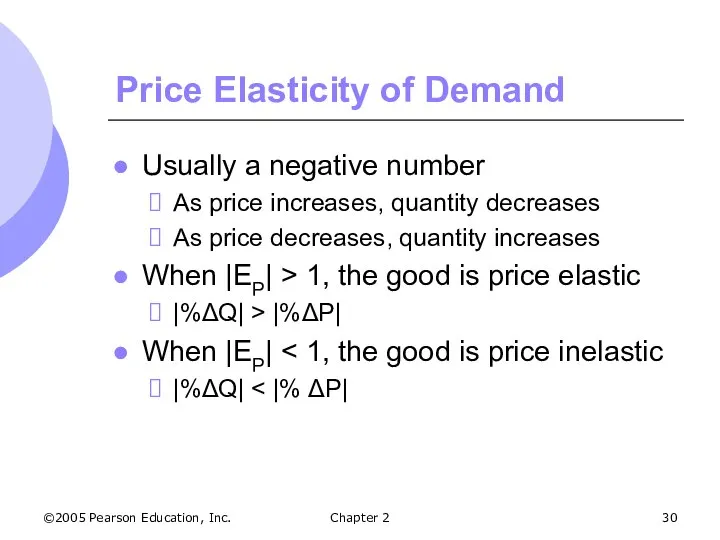
- 30. ©2005 Pearson Education, Inc. Chapter 2 Price Elasticity of Demand Usually a negative number As price
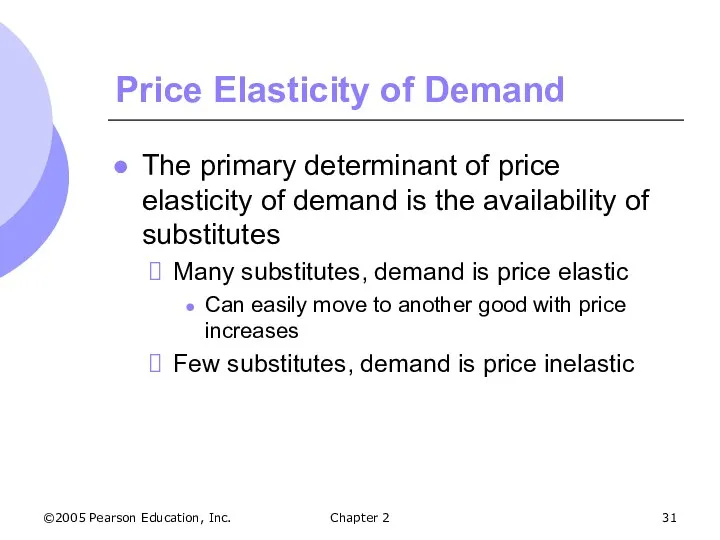
- 31. ©2005 Pearson Education, Inc. Chapter 2 Price Elasticity of Demand The primary determinant of price elasticity
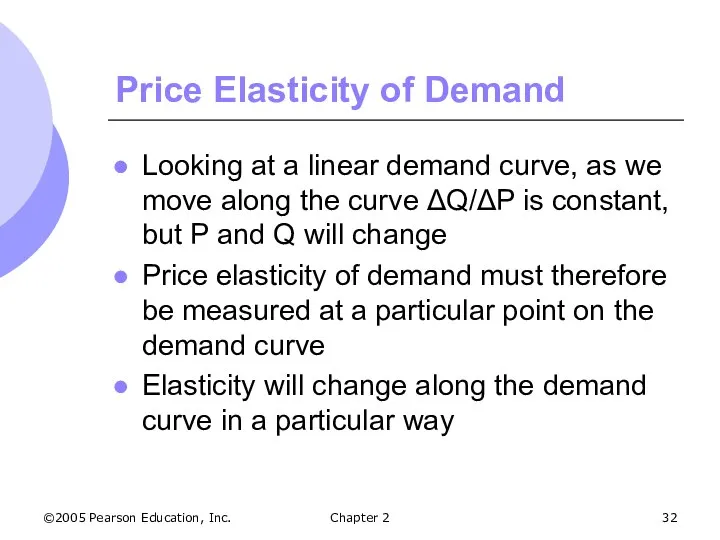
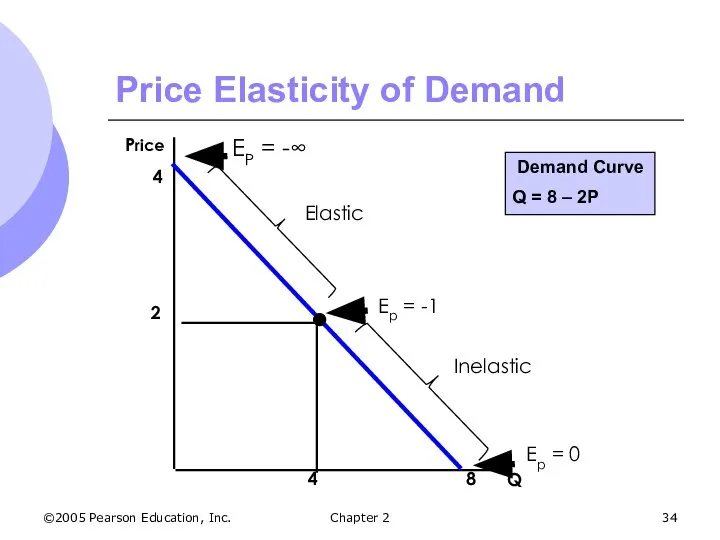
- 32. ©2005 Pearson Education, Inc. Chapter 2 Price Elasticity of Demand Looking at a linear demand curve,
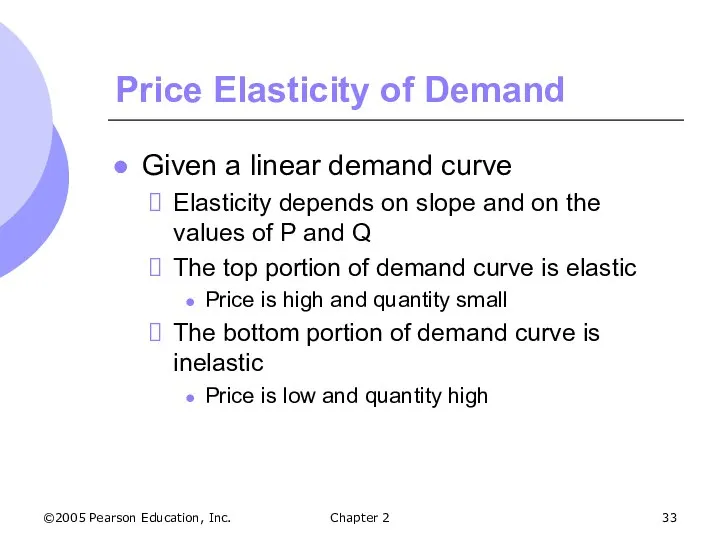
- 33. ©2005 Pearson Education, Inc. Chapter 2 Price Elasticity of Demand Given a linear demand curve Elasticity
- 34. ©2005 Pearson Education, Inc. Chapter 2 Price Elasticity of Demand Demand Curve Q = 8 –
- 35. ©2005 Pearson Education, Inc. Chapter 2 Price Elasticity of Demand The steeper the demand curve, the
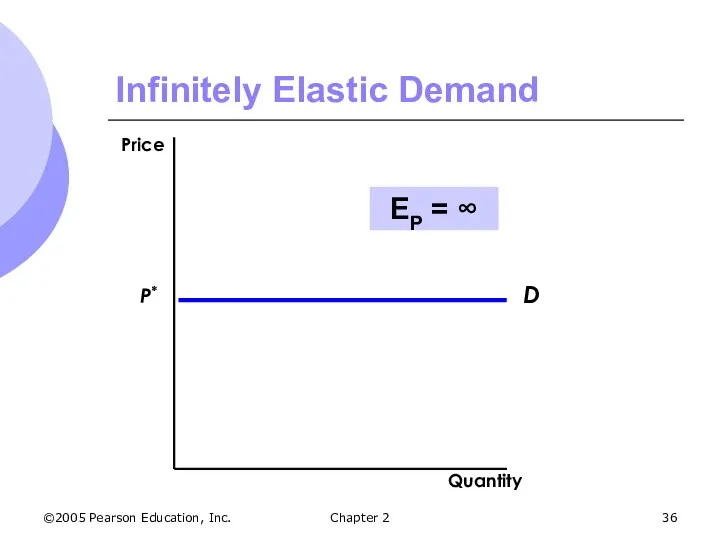
- 36. ©2005 Pearson Education, Inc. Chapter 2 Infinitely Elastic Demand EP = ∞
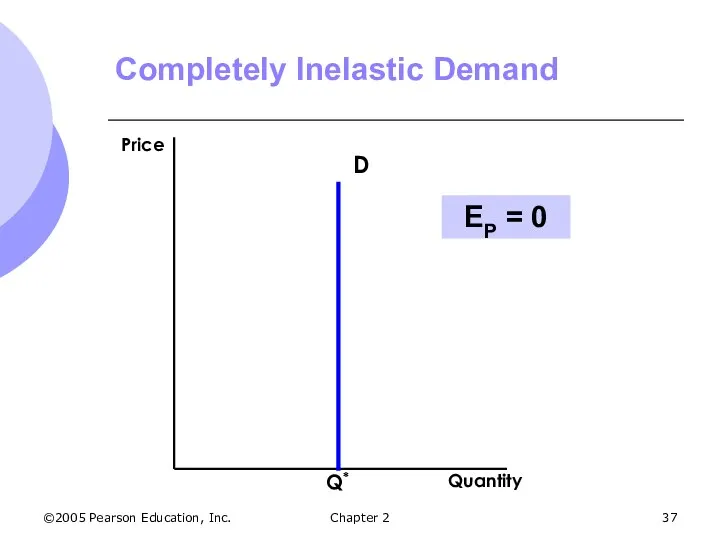
- 37. ©2005 Pearson Education, Inc. Chapter 2 Completely Inelastic Demand Q* D EP = 0
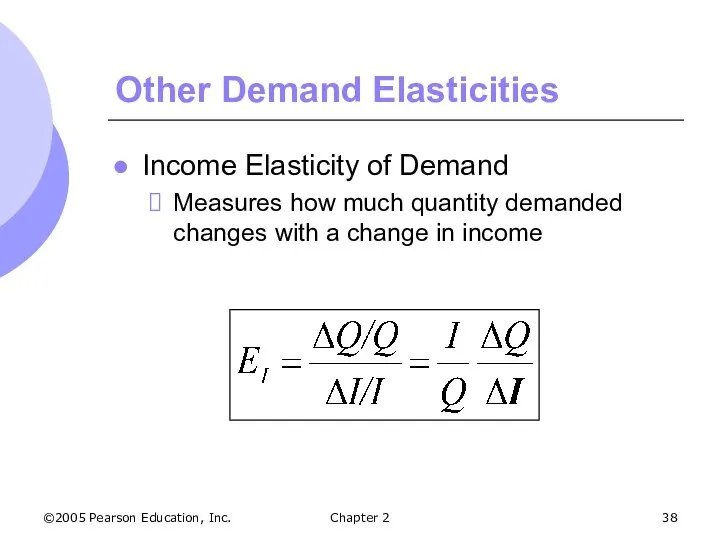
- 38. ©2005 Pearson Education, Inc. Chapter 2 Other Demand Elasticities Income Elasticity of Demand Measures how much
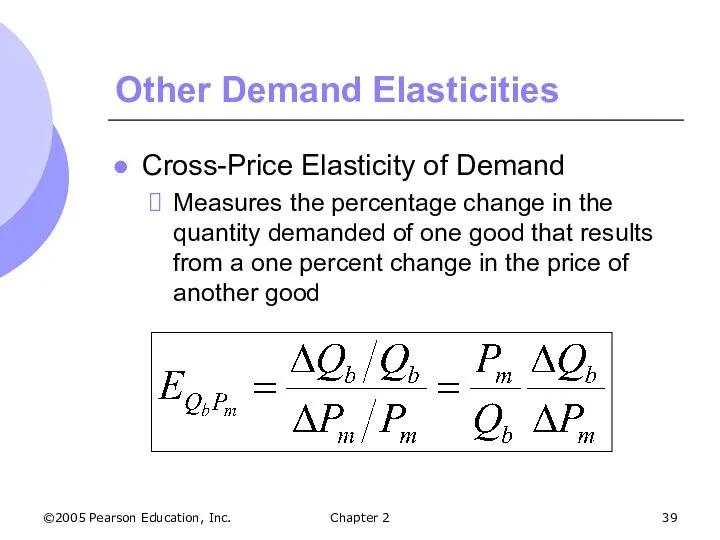
- 39. ©2005 Pearson Education, Inc. Chapter 2 Other Demand Elasticities Cross-Price Elasticity of Demand Measures the percentage
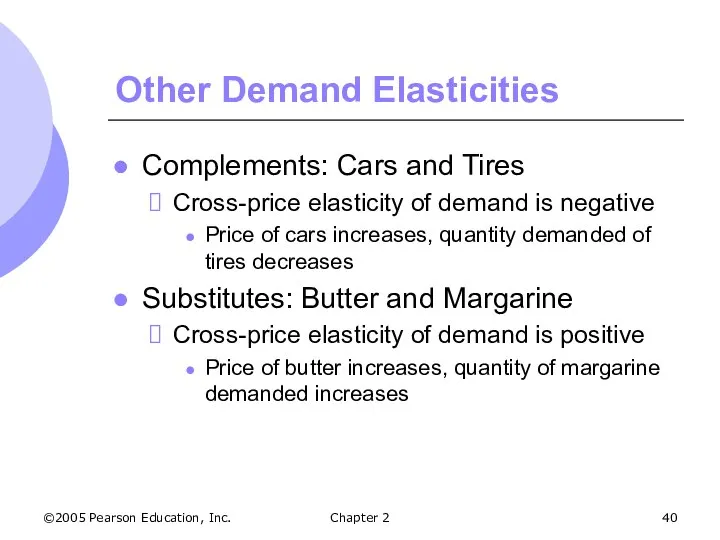
- 40. ©2005 Pearson Education, Inc. Chapter 2 Other Demand Elasticities Complements: Cars and Tires Cross-price elasticity of
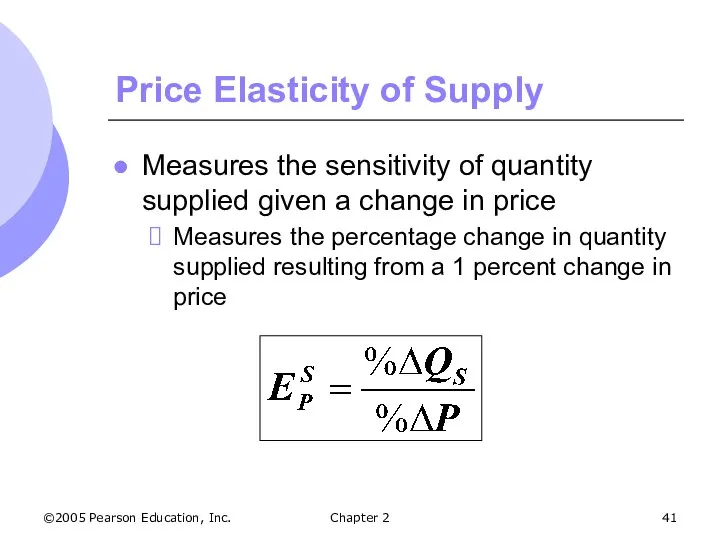
- 41. ©2005 Pearson Education, Inc. Chapter 2 Price Elasticity of Supply Measures the sensitivity of quantity supplied
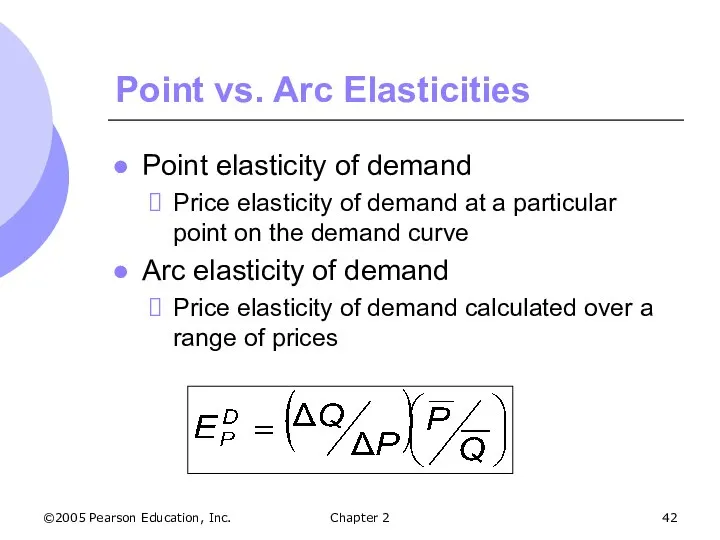
- 42. ©2005 Pearson Education, Inc. Chapter 2 Point vs. Arc Elasticities Point elasticity of demand Price elasticity
- 43. ©2005 Pearson Education, Inc. Chapter 2 Short-Run Versus Long-Run Elasticity Price elasticity varies with the amount
- 44. ©2005 Pearson Education, Inc. Chapter 2 Short-Run Versus Long-Run Elasticity Demand In general, demand is much
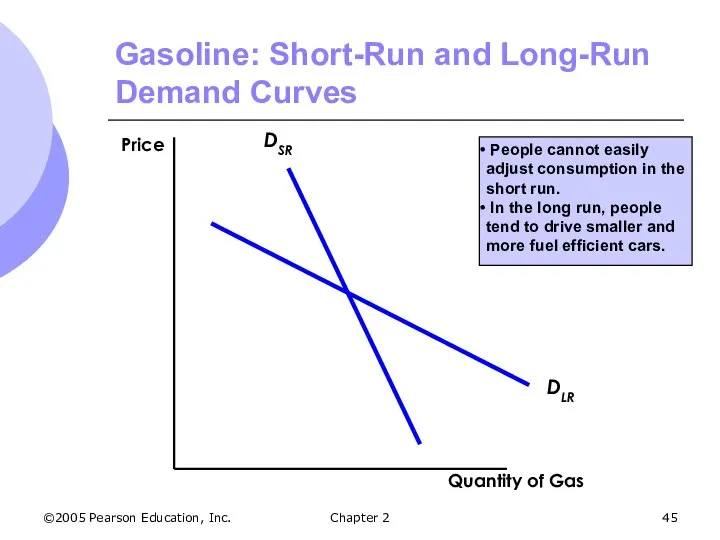
- 45. ©2005 Pearson Education, Inc. Chapter 2 Gasoline: Short-Run and Long-Run Demand Curves People cannot easily adjust
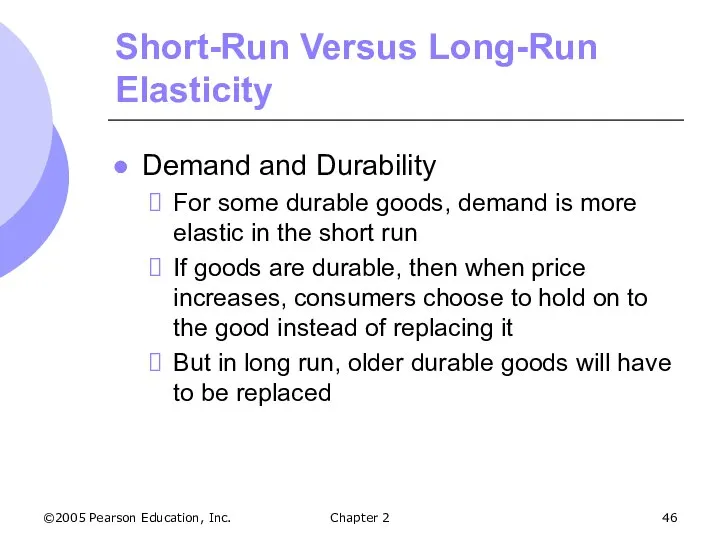
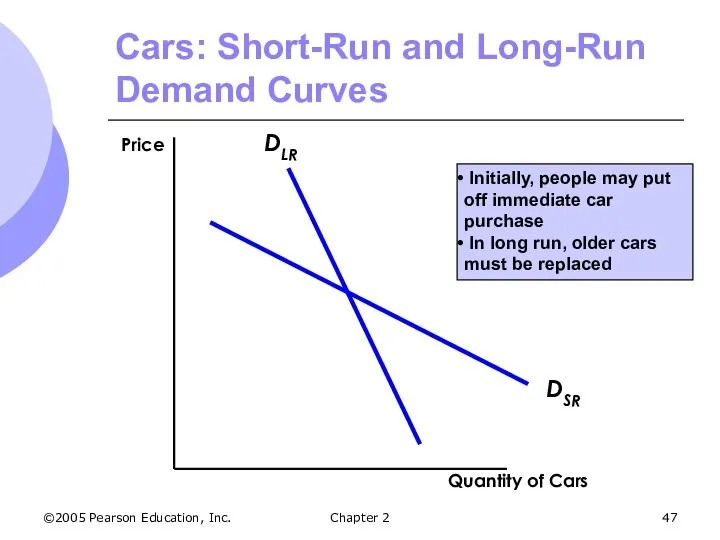
- 46. ©2005 Pearson Education, Inc. Chapter 2 Short-Run Versus Long-Run Elasticity Demand and Durability For some durable
- 47. ©2005 Pearson Education, Inc. Chapter 2 Initially, people may put off immediate car purchase In long
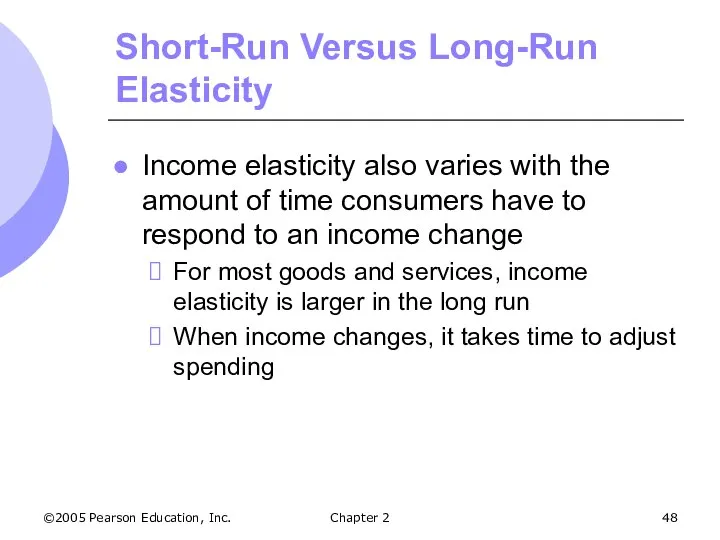
- 48. ©2005 Pearson Education, Inc. Chapter 2 Short-Run Versus Long-Run Elasticity Income elasticity also varies with the
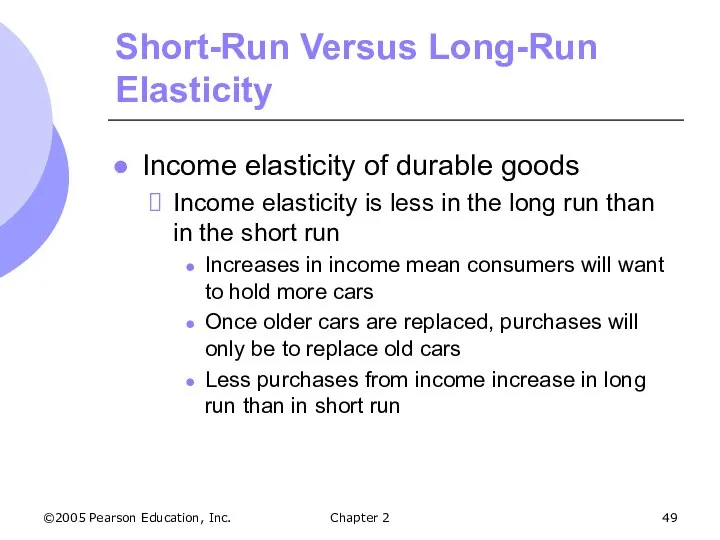
- 49. ©2005 Pearson Education, Inc. Chapter 2 Short-Run Versus Long-Run Elasticity Income elasticity of durable goods Income
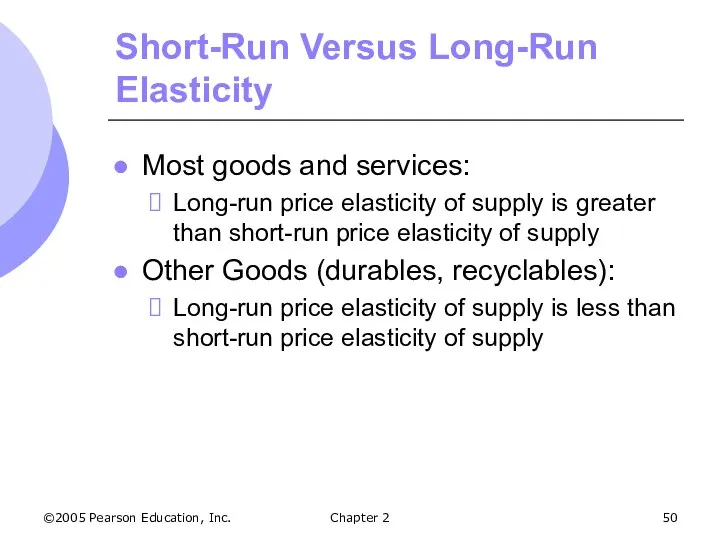
- 50. ©2005 Pearson Education, Inc. Chapter 2 Short-Run Versus Long-Run Elasticity Most goods and services: Long-run price
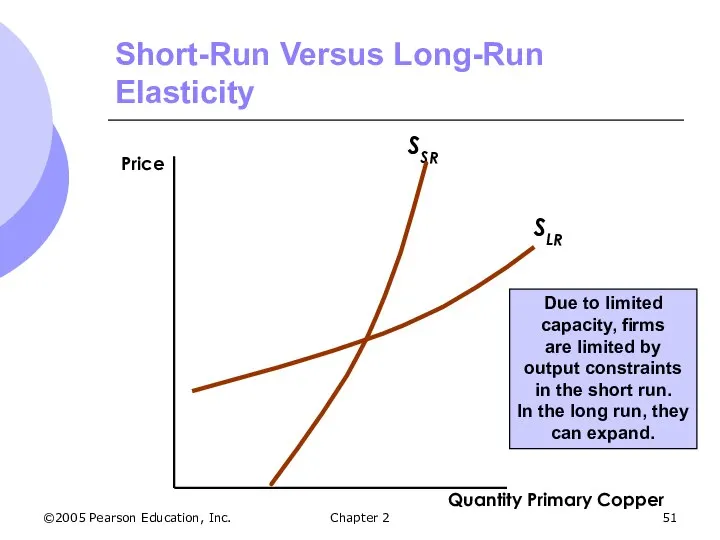
- 51. ©2005 Pearson Education, Inc. Chapter 2 Short-Run Versus Long-Run Elasticity Due to limited capacity, firms are
- 52. ©2005 Pearson Education, Inc. Chapter 2 Predicting the Effects of Changing Market Conditions Supply and demand
- 53. ©2005 Pearson Education, Inc. Chapter 2 Predicting the Effects of Changing Market Conditions We know Equilibrium
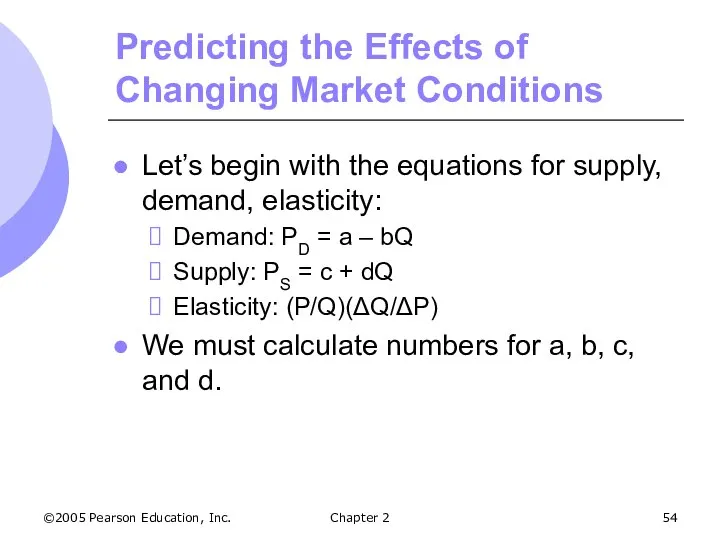
- 54. ©2005 Pearson Education, Inc. Chapter 2 Predicting the Effects of Changing Market Conditions Let’s begin with
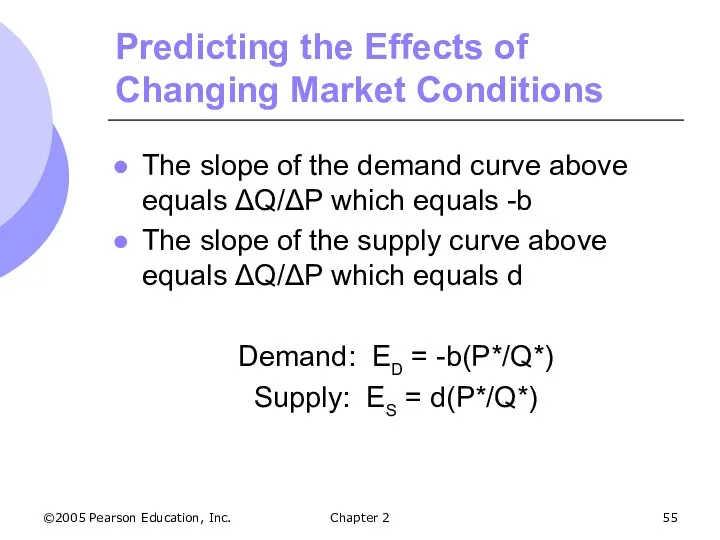
- 55. ©2005 Pearson Education, Inc. Chapter 2 Predicting the Effects of Changing Market Conditions The slope of
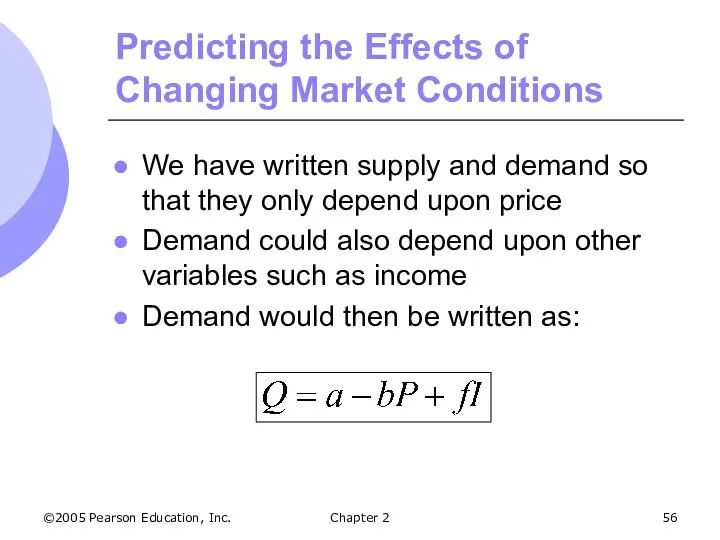
- 56. ©2005 Pearson Education, Inc. Chapter 2 Predicting the Effects of Changing Market Conditions We have written
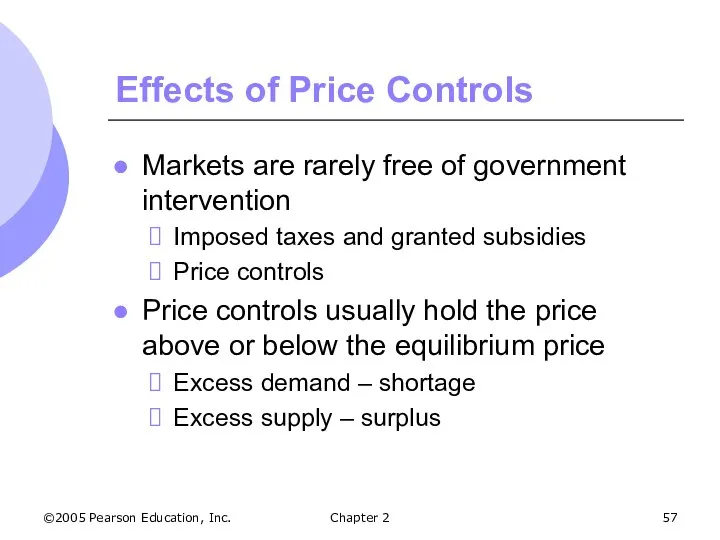
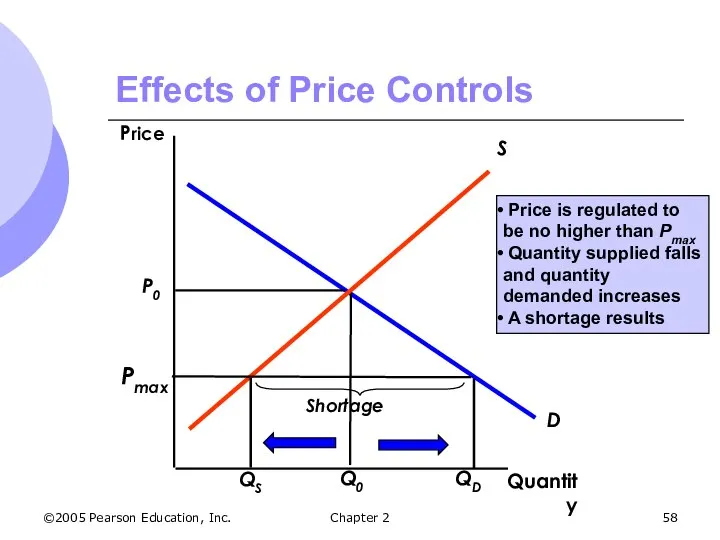
- 57. ©2005 Pearson Education, Inc. Chapter 2 Effects of Price Controls Markets are rarely free of government
- 58. ©2005 Pearson Education, Inc. Chapter 2 Effects of Price Controls Price is regulated to be no
- 60. Скачать презентацию
©2005 Pearson Education, Inc.
Chapter 2
Introduction
What are supply and demand?
What is the
©2005 Pearson Education, Inc.
Chapter 2
Introduction
What are supply and demand?
What is the
©2005 Pearson Education, Inc.
Chapter 2
Supply and Demand
Supply and demand analysis can:
Help
©2005 Pearson Education, Inc.
Chapter 2
Supply and Demand
Supply and demand analysis can:
Help
©2005 Pearson Education, Inc.
Chapter 2
Supply and Demand
The Supply Curve
The relationship between
©2005 Pearson Education, Inc.
Chapter 2
Supply and Demand
The Supply Curve
The relationship between
©2005 Pearson Education, Inc.
Chapter 2
The Supply Curve
The supply curve slopes
upward, demonstrating
©2005 Pearson Education, Inc.
Chapter 2
The Supply Curve
The supply curve slopes
upward, demonstrating
©2005 Pearson Education, Inc.
Chapter 2
The Supply Curve
Other Variables Affecting Supply
Costs of
©2005 Pearson Education, Inc.
Chapter 2
The Supply Curve
Other Variables Affecting Supply
Costs of
©2005 Pearson Education, Inc.
Chapter 2
Change in Supply
The cost of raw materials
©2005 Pearson Education, Inc.
Chapter 2
Change in Supply
The cost of raw materials
©2005 Pearson Education, Inc.
Chapter 2
The Supply Curve
Change in Quantity Supplied
Movement along
©2005 Pearson Education, Inc.
Chapter 2
The Supply Curve
Change in Quantity Supplied
Movement along
©2005 Pearson Education, Inc.
Chapter 2
Supply and Demand
The Demand Curve
The relationship between
©2005 Pearson Education, Inc.
Chapter 2
Supply and Demand
The Demand Curve
The relationship between
©2005 Pearson Education, Inc.
Chapter 2
The Demand Curve
The demand curve slopes
downward, demonstrating
©2005 Pearson Education, Inc.
Chapter 2
The Demand Curve
The demand curve slopes
downward, demonstrating
©2005 Pearson Education, Inc.
Chapter 2
The Demand Curve
Other Variables Affecting Demand
Income
Increases in
©2005 Pearson Education, Inc.
Chapter 2
The Demand Curve
Other Variables Affecting Demand
Income
Increases in
©2005 Pearson Education, Inc.
Chapter 2
Change in Demand
Income Increases
Purchased Q0, at P2
©2005 Pearson Education, Inc.
Chapter 2
Change in Demand
Income Increases
Purchased Q0, at P2
©2005 Pearson Education, Inc.
Chapter 2
The Demand Curve
Changes in quantity demanded
Movements along
©2005 Pearson Education, Inc.
Chapter 2
The Demand Curve
Changes in quantity demanded
Movements along
©2005 Pearson Education, Inc.
Chapter 2
The Market Mechanism
The market mechanism is the
©2005 Pearson Education, Inc.
Chapter 2
The Market Mechanism
The market mechanism is the
©2005 Pearson Education, Inc.
Chapter 2
The Market Mechanism
The curves intersect at
equilibrium, or
©2005 Pearson Education, Inc.
Chapter 2
The Market Mechanism
The curves intersect at
equilibrium, or
©2005 Pearson Education, Inc.
Chapter 2
The Market Mechanism
In equilibrium
There is no shortage
©2005 Pearson Education, Inc.
Chapter 2
The Market Mechanism
In equilibrium
There is no shortage
©2005 Pearson Education, Inc.
Chapter 2
Market Surplus1
The market price is above equilibrium
There
©2005 Pearson Education, Inc.
Chapter 2
Market Surplus1
The market price is above equilibrium
There
©2005 Pearson Education, Inc.
Chapter 2
The Market Mechanism
At P1, price is above
©2005 Pearson Education, Inc.
Chapter 2
The Market Mechanism
At P1, price is above
©2005 Pearson Education, Inc.
Chapter 2
The Market Mechanism
The market price is below
©2005 Pearson Education, Inc.
Chapter 2
The Market Mechanism
The market price is below
©2005 Pearson Education, Inc.
Chapter 2
The Market Mechanism
At P2, price is below
©2005 Pearson Education, Inc.
Chapter 2
The Market Mechanism
At P2, price is below
©2005 Pearson Education, Inc.
Chapter 2
The Market Mechanism
Supply and demand interact to
©2005 Pearson Education, Inc.
Chapter 2
The Market Mechanism
Supply and demand interact to
©2005 Pearson Education, Inc.
Chapter 2
Changes in Market Equilibrium
Equilibrium prices are determined
©2005 Pearson Education, Inc.
Chapter 2
Changes in Market Equilibrium
Equilibrium prices are determined
©2005 Pearson Education, Inc.
Chapter 2
Changes in Market Equilibrium
Raw material prices fall
S
©2005 Pearson Education, Inc.
Chapter 2
Changes in Market Equilibrium
Raw material prices fall
S
©2005 Pearson Education, Inc.
Chapter 2
Changes in Market Equilibrium
Income Increases
Demand increases to
©2005 Pearson Education, Inc.
Chapter 2
Changes in Market Equilibrium
Income Increases
Demand increases to
©2005 Pearson Education, Inc.
Chapter 2
Changes in Market Equilibrium
Income increases and raw
©2005 Pearson Education, Inc.
Chapter 2
Changes in Market Equilibrium
Income increases and raw
©2005 Pearson Education, Inc.
Chapter 2
Shifts in Supply and Demand
When supply and
©2005 Pearson Education, Inc.
Chapter 2
Shifts in Supply and Demand
When supply and
©2005 Pearson Education, Inc.
Chapter 2
Elasticities of Supply and Demand
Not only are
©2005 Pearson Education, Inc.
Chapter 2
Elasticities of Supply and Demand
Not only are
©2005 Pearson Education, Inc.
Chapter 2
Price Elasticity of Demand
Measures the sensitivity of
©2005 Pearson Education, Inc.
Chapter 2
Price Elasticity of Demand
Measures the sensitivity of
©2005 Pearson Education, Inc.
Chapter 2
Price Elasticity of Demand
The percentage change in
©2005 Pearson Education, Inc.
Chapter 2
Price Elasticity of Demand
The percentage change in
©2005 Pearson Education, Inc.
Chapter 2
Price Elasticity of Demand
Usually a negative number
As
©2005 Pearson Education, Inc.
Chapter 2
Price Elasticity of Demand
Usually a negative number
As
©2005 Pearson Education, Inc.
Chapter 2
Price Elasticity of Demand
The primary determinant of
©2005 Pearson Education, Inc.
Chapter 2
Price Elasticity of Demand
The primary determinant of
©2005 Pearson Education, Inc.
Chapter 2
Price Elasticity of Demand
Looking at a linear
©2005 Pearson Education, Inc.
Chapter 2
Price Elasticity of Demand
Looking at a linear
©2005 Pearson Education, Inc.
Chapter 2
Price Elasticity of Demand
Given a linear demand
©2005 Pearson Education, Inc.
Chapter 2
Price Elasticity of Demand
Given a linear demand
©2005 Pearson Education, Inc.
Chapter 2
Price Elasticity of Demand
Demand Curve
Q = 8
©2005 Pearson Education, Inc.
Chapter 2
Price Elasticity of Demand
Demand Curve
Q = 8
©2005 Pearson Education, Inc.
Chapter 2
Price Elasticity of Demand
The steeper the demand
©2005 Pearson Education, Inc.
Chapter 2
Price Elasticity of Demand
The steeper the demand
©2005 Pearson Education, Inc.
Chapter 2
Infinitely Elastic Demand
EP = ∞
©2005 Pearson Education, Inc.
Chapter 2
Infinitely Elastic Demand
EP = ∞
©2005 Pearson Education, Inc.
Chapter 2
Completely Inelastic Demand
Q*
D
EP = 0
©2005 Pearson Education, Inc.
Chapter 2
Completely Inelastic Demand
Q*
D
EP = 0
©2005 Pearson Education, Inc.
Chapter 2
Other Demand Elasticities
Income Elasticity of Demand
Measures how
©2005 Pearson Education, Inc.
Chapter 2
Other Demand Elasticities
Income Elasticity of Demand
Measures how
©2005 Pearson Education, Inc.
Chapter 2
Other Demand Elasticities
Cross-Price Elasticity of Demand
Measures the
©2005 Pearson Education, Inc.
Chapter 2
Other Demand Elasticities
Cross-Price Elasticity of Demand
Measures the
©2005 Pearson Education, Inc.
Chapter 2
Other Demand Elasticities
Complements: Cars and Tires
Cross-price elasticity
©2005 Pearson Education, Inc.
Chapter 2
Other Demand Elasticities
Complements: Cars and Tires
Cross-price elasticity
©2005 Pearson Education, Inc.
Chapter 2
Price Elasticity of Supply
Measures the sensitivity of
©2005 Pearson Education, Inc.
Chapter 2
Price Elasticity of Supply
Measures the sensitivity of
©2005 Pearson Education, Inc.
Chapter 2
Point vs. Arc Elasticities
Point elasticity of demand
Price
©2005 Pearson Education, Inc.
Chapter 2
Point vs. Arc Elasticities
Point elasticity of demand
Price
©2005 Pearson Education, Inc.
Chapter 2
Short-Run Versus Long-Run Elasticity
Price elasticity varies with
©2005 Pearson Education, Inc.
Chapter 2
Short-Run Versus Long-Run Elasticity
Price elasticity varies with
©2005 Pearson Education, Inc.
Chapter 2
Short-Run Versus Long-Run Elasticity
Demand
In general, demand is
©2005 Pearson Education, Inc.
Chapter 2
Short-Run Versus Long-Run Elasticity
Demand
In general, demand is
©2005 Pearson Education, Inc.
Chapter 2
Gasoline: Short-Run and Long-Run Demand Curves
People
©2005 Pearson Education, Inc.
Chapter 2
Gasoline: Short-Run and Long-Run Demand Curves
People
©2005 Pearson Education, Inc.
Chapter 2
Short-Run Versus Long-Run Elasticity
Demand and Durability
For some
©2005 Pearson Education, Inc.
Chapter 2
Short-Run Versus Long-Run Elasticity
Demand and Durability
For some
©2005 Pearson Education, Inc.
Chapter 2
Initially, people may put off immediate
©2005 Pearson Education, Inc.
Chapter 2
Initially, people may put off immediate
©2005 Pearson Education, Inc.
Chapter 2
Short-Run Versus Long-Run Elasticity
Income elasticity also varies
©2005 Pearson Education, Inc.
Chapter 2
Short-Run Versus Long-Run Elasticity
Income elasticity also varies
©2005 Pearson Education, Inc.
Chapter 2
Short-Run Versus Long-Run Elasticity
Income elasticity of durable
©2005 Pearson Education, Inc.
Chapter 2
Short-Run Versus Long-Run Elasticity
Income elasticity of durable
©2005 Pearson Education, Inc.
Chapter 2
Short-Run Versus Long-Run Elasticity
Most goods and services:
Long-run
©2005 Pearson Education, Inc.
Chapter 2
Short-Run Versus Long-Run Elasticity
Most goods and services:
Long-run
©2005 Pearson Education, Inc.
Chapter 2
Short-Run Versus Long-Run Elasticity
Due to limited
capacity, firms
are
©2005 Pearson Education, Inc.
Chapter 2
Short-Run Versus Long-Run Elasticity
Due to limited
capacity, firms
are
©2005 Pearson Education, Inc.
Chapter 2
Predicting the Effects of Changing Market Conditions
Supply
©2005 Pearson Education, Inc.
Chapter 2
Predicting the Effects of Changing Market Conditions
Supply
©2005 Pearson Education, Inc.
Chapter 2
Predicting the Effects of Changing Market Conditions
We
©2005 Pearson Education, Inc.
Chapter 2
Predicting the Effects of Changing Market Conditions
We
©2005 Pearson Education, Inc.
Chapter 2
Predicting the Effects of Changing Market Conditions
Let’s
©2005 Pearson Education, Inc.
Chapter 2
Predicting the Effects of Changing Market Conditions
Let’s
©2005 Pearson Education, Inc.
Chapter 2
Predicting the Effects of Changing Market Conditions
The
©2005 Pearson Education, Inc.
Chapter 2
Predicting the Effects of Changing Market Conditions
The
©2005 Pearson Education, Inc.
Chapter 2
Predicting the Effects of Changing Market Conditions
We
©2005 Pearson Education, Inc.
Chapter 2
Predicting the Effects of Changing Market Conditions
We
©2005 Pearson Education, Inc.
Chapter 2
Effects of Price Controls
Markets are rarely free
©2005 Pearson Education, Inc.
Chapter 2
Effects of Price Controls
Markets are rarely free
©2005 Pearson Education, Inc.
Chapter 2
Effects of Price Controls
Price is regulated
©2005 Pearson Education, Inc.
Chapter 2
Effects of Price Controls
Price is regulated
 Показатели эффективности производственной программы
 Понятие, предмет и метод экономического права. Субъекты, объекты экономического права
 Дополнительность (Complementarity)
 Теории международной торговли
 Демографические и миграционные процессы в узловых регионах современного мира
 Функционально-стоимостной анализ
 Россия и ЕС
 Анализ государственной кадровой политики США
 Альтернативная стоимость и кривая производственных возможностей
 Туристские формальности стран - массовых направлений туризма
 Глобальные проблемы человечества
 Лозанская школа маржинализма
 Исследование рынка гостиничных услуг и делового туризма в Санкт-Петербурге
 Макроэкономическая нестабильность и циклические колебания
 Белорусская модель экономики
 Особенности рынка труда
 Мировой рынок услуг
 Федеральный акселератор технологических проектов GenerationS
 Ресурсное обеспечение предприятия. Основные и оборотные средства. (Лекция 2)
 Рынки ресурсов. Рынок земли
 Система комплексного экономического анализа
 Реализация функций СМК, закрепленных за ОТК
 Життєвий цикл проекту
 Микроэкономика. Фирма. Методы исследования микроэкономических явлений и процессов
 Проведение международных коммерческих сделок по купле-продаже товаров. (Тема 3)
 Артемовская ТЭЦ
 Кризисы 1970-1980-х гг. Становление информационного общества
 Экономика труда. Лекция 1