- Nested data is stored in .json files as shown in figure below

Содержание
- 2. Task 1 Python script to Read .json nested data, plot tabulated data Script should be capable
- 3. Plot 1 1. Vs with depth 2. Vp with depth Save as locationame_velocityProfile .png velocityProfile
- 4. Site dispersion & theoretical dispersion velocity with frequency on same plot Plot 2 dispersionData Save as
- 5. plot 3- labTest grainSizeDistribution nonlinearTest Save as locationame_labTest .png
- 7. Скачать презентацию
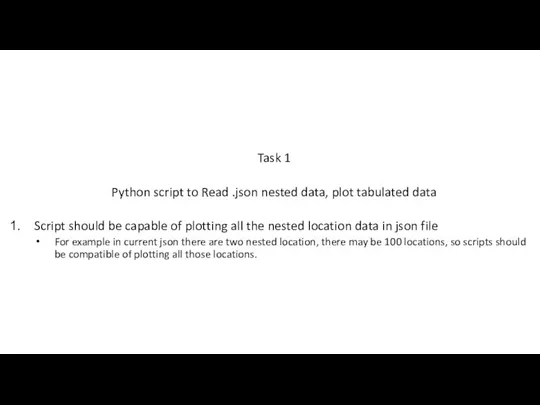
Task 1
Python script to Read .json nested data, plot tabulated data
Task 1
Python script to Read .json nested data, plot tabulated data
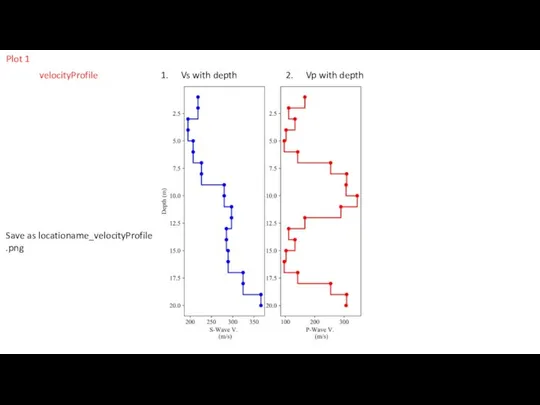
Plot 1
1. Vs with depth
2. Vp with depth
Save as locationame_velocityProfile .png
velocityProfile
Plot 1
1. Vs with depth
2. Vp with depth
Save as locationame_velocityProfile .png
velocityProfile
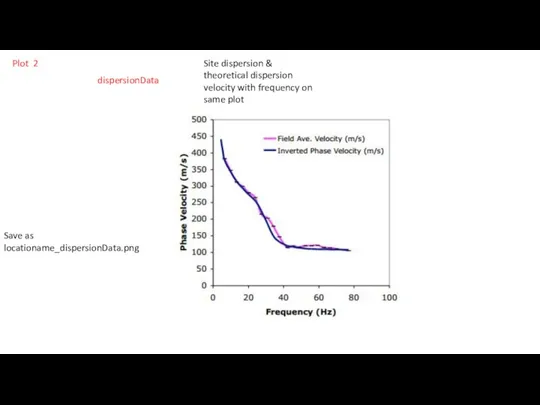
Site dispersion & theoretical dispersion velocity with frequency on same plot
Plot
Site dispersion & theoretical dispersion velocity with frequency on same plot
Plot
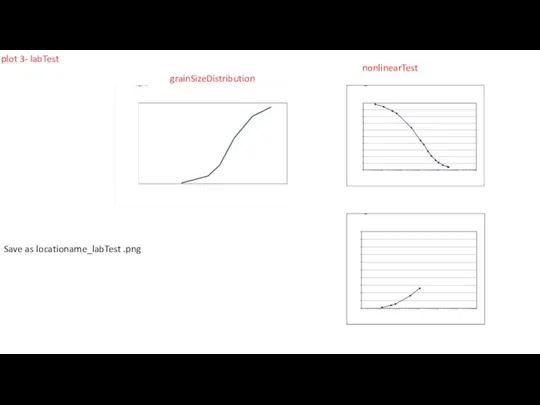
plot 3- labTest
grainSizeDistribution
nonlinearTest
Save as locationame_labTest .png
plot 3- labTest
grainSizeDistribution
nonlinearTest
Save as locationame_labTest .png
 Новые правила интеграции
 Информатика программирование: Основы языка программирования JAVA
 Обработка информации. Создание движущихся изображений
 Обучение аккаунтов
 Презентация по информатике Безопасный интернет
  Раздел 2. Общий состав и структура электронно-вычислительных машин и вычислительных систем Тема 2.1 Архитектура ЭВМ и вычислите
 Кодирование графической информации. Пространственная дискретизация. Палитры цветов в системах цветопередачи RGB, CMYK и HSB
 Современные технологии продвижения ресторана в Интернет
 Качество программных средств. Стандарты, регламентирующие показатели качества ПС
 Формы представления информации
 Операционная система Windows. Рабочий стол. Операции с мышью
  Оптимизатор времени
 Коды Brawl Stars
 Учимся с Марусей
 MS WORD. Создание таблиц в текстовом редакторе
 Актуальные тренды рынка труда 20172018
 Интерактивный плакат Компьютерные коммуникации
 Информационное общество Производство компьютеров Ткаченко и Скалаба
 Презентация "Линейные вычислительные алгоритмы" - скачать презентации по Информатике
 Файловые системы
 Create a own Database
 Профилактика интернет - рисков и угроз жизни детей и подростков
 Основы логики
 Язык программирования JavaScript
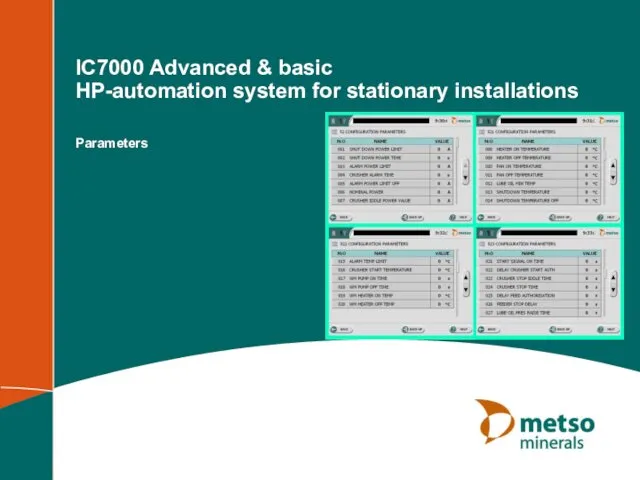 IC7000 Advanced & basic HP-automation system for stationary installations
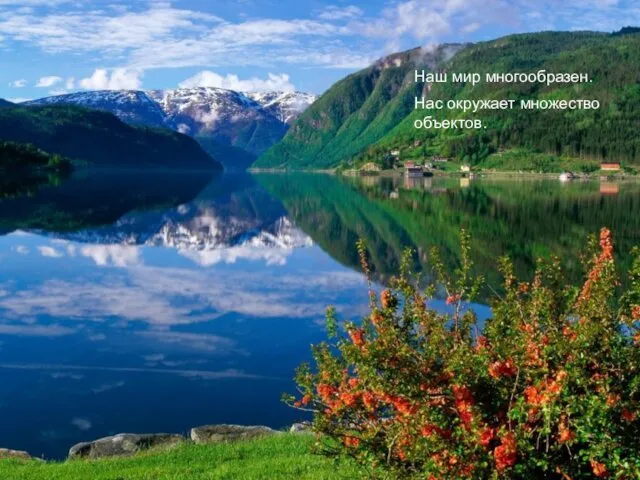 Единицы измерения информации
 AlarusApp
 Свойства систем