- Training course introduction to PSR system

Содержание
- 2. The data and information, in its totality or partial expression, contained in this document are property
- 3. Signature Sheet
- 4. Changes Record
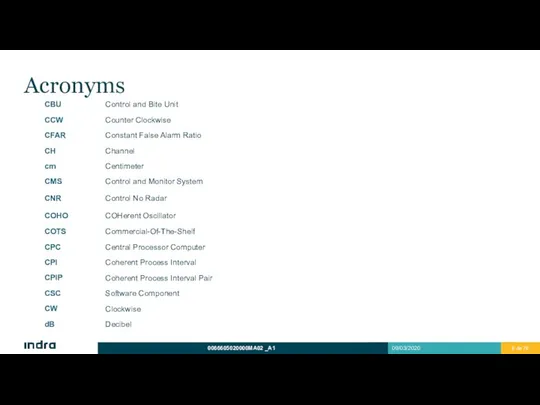
- 5. Acronyms
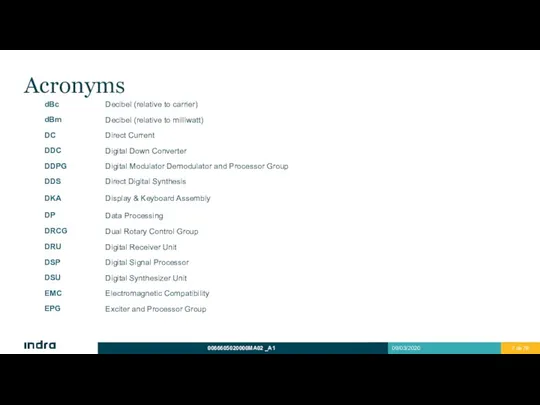
- 6. Acronyms
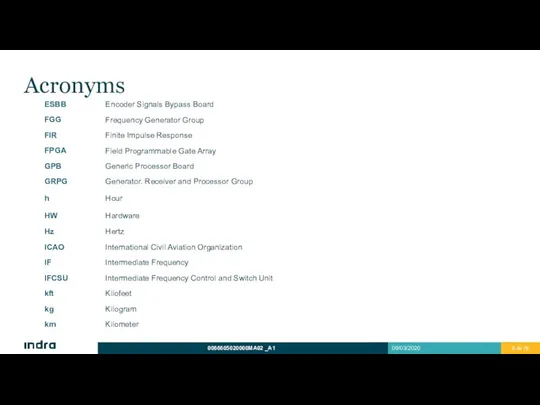
- 7. Acronyms
- 8. Acronyms
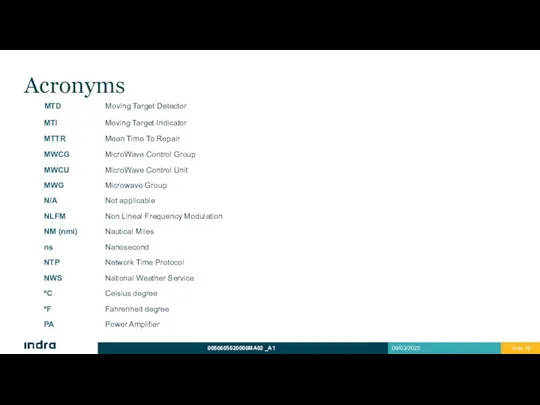
- 9. Acronyms
- 10. Acronyms
- 11. Acronyms
- 12. Acronyms
- 13. Acronyms
- 14. Acronyms
- 17. 1 Preliminary Notions
- 18. Primary Surveillance S-band radar which provides air surveillance, tracking activity and weather detection for all target
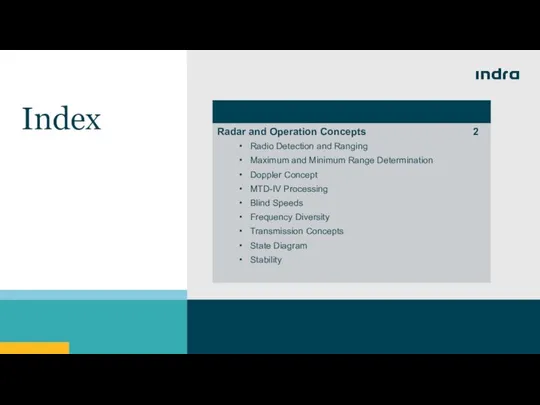
- 19. 2 Radar and Operation Concepts Radio Detection and Ranging Maximum and Minimum Range Determination Doppler Concept
- 20. Radio Detection and Ranging BASIC CONCEPT A primary radar operates by radiating electromagnetic energy and detecting
- 21. Maximum and Minimum Range Determination MAXIMUM RANGE Radar system range is not related linearly to transmitted
- 22. Maximum and Minimum Range Determination Maximum range improvement In order to improve maximum range, transmitted average
- 23. Maximum and Minimum Range Determination Pulse Compression Range resolution is related to pulse duration: Goal: a
- 24. Maximum and Minimum Range Determination Pulse Compression NLFM (Non Linear Frequency Modulation) The pulse compression technique
- 25. Maximum and Minimum Range Determination Pulse Compression (Resolution) By means of this technique, resolution is a
- 26. Maximum and Minimum Range Determination Short Pulse Transmission SHORT PULSE TRANSMISSION: By means of pulse compression,
- 27. Doppler Concept Introduction Doppler Frequency: Changes in electromagnetic frequency that occurs when the source of the
- 28. Doppler Concept Introduction Sound is propagated at 1000 ft/s. ( 1 NM approx.. 6000 ft) ?
- 29. Doppler Concept Introduction Observer-2 does not hear the horn sound till 6 seconds after the driver
- 30. Doppler Concept Radar Application Considering the relative movement of a target with respect a radar, the
- 31. Doppler Concept Radar Application Calculation of Doppler shift: Wavelength: Frequency of Doppler: Radar and Operation Concepts
- 32. It is impossible to determine a Doppler change from one pulse echo returned from a target.
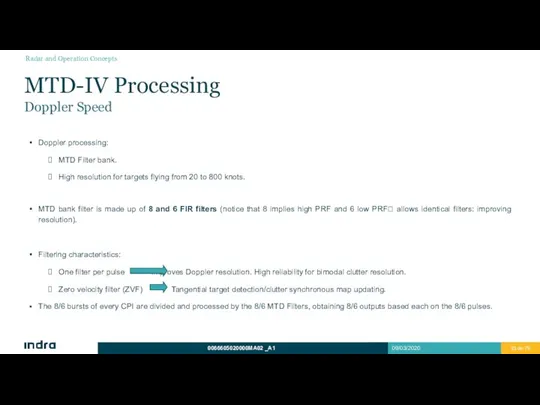
- 33. MTD-IV Processing Doppler Speed Doppler processing: MTD Filter bank. High resolution for targets flying from 20
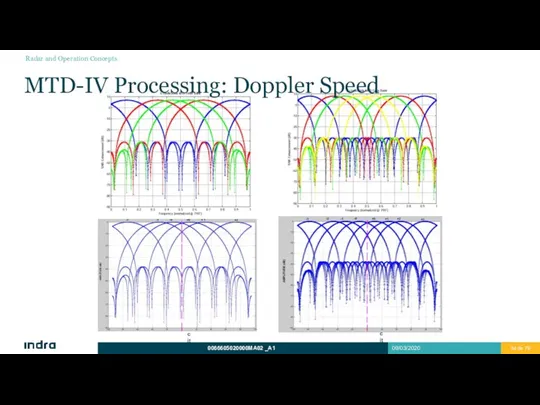
- 34. MTD-IV Processing: Doppler Speed Radar velocity (knot) Radar velocity (knot) Radar and Operation Concepts
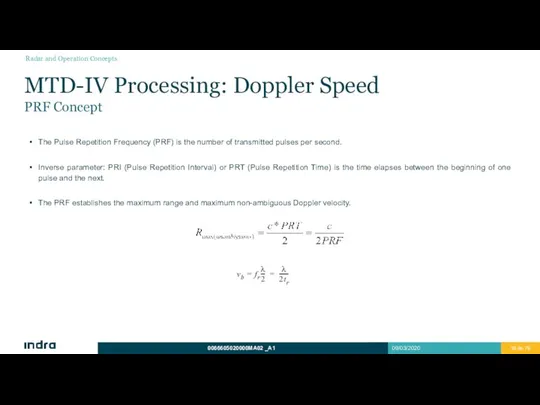
- 35. MTD-IV Processing: Doppler Speed PRF Concept The Pulse Repetition Frequency (PRF) is the number of transmitted
- 36. MTD-IV Processing PRT Concept The PRT of the radar becomes important in maximum range determination because
- 37. Blind Speeds PROBLEM: If a target has a Doppler frequency which is a PRF exact multiple,
- 38. Blind Speeds MTD filters determines first blind speed. Radar and Operation Concepts
- 39. Frequency Diversity This method is used in order to improve the probability of detection, caused by
- 40. Transmission Concepts CPIs + PRF + Frequency Diversity Signal transmitted in 2 CPIs per beamwidth (1,4º)
- 41. CPI 1 CPI 2 1,4 º Transmission Concepts CPIs + PRF + Frequency Diversity PRT 2
- 42. Transmission Concepts CPIs + PRF + Frequency Diversity TRANSMITTED SIGNAL: PTIP ? time elapses in synchronism
- 43. State Diagram STANDARD DIAGRAM: According to range: Short or long pulse echo ? maximum range or
- 44. Stability STABILITY ?COHERENT RADAR Outstanding measurement in radars which uses Doppler (instabilities can produce Doppler errors).
- 45. 3 Design Features Evolution Main Features Characteristic Summary
- 46. Evolution Collects features about Indra 3D radar (Lanza). Designed following the EUROCONTROL and ICAO Specifications. Includes
- 47. Main Features TAR and TMA applications. ASR system provides improvement levels of safety, integrity, maintainability and
- 48. Characteristic Summary System Performance Design Features
- 49. Characteristic Summary System Performance Design Features
- 50. Characteristic Summary Antenna Performance Design Features
- 51. Characteristic Summary Receiver and Processor Performance Design Features
- 52. 4 General Description System Architecture System Elements Functional Description Operation and Monitoring
- 53. System Architecture PSR + MSSR General Description
- 54. System Architecture Block Diagram OUTDOOR EQUIPMENT INDOOR EQUIPMENT GRPG 1 GRPG 2 General Description
- 55. System Architecture: Interfaces General Description
- 56. System Architecture External Interfaces ASTERIX Cat. 34 & 48 (1 & 2) ATCC DATA PROCESSOR WEATHER
- 57. System Architecture Interfaces General Description
- 58. System Architecture Antenna and Pedestal Group (APG) APG General Description
- 59. System Architecture Antenna and Pedestal Group (APG) ANTENNA PEDESTAL ROTARY JOINT General Description
- 60. System Architecture Dual Rotary Control Group (DRCG) General Description
- 61. System Architecture Transmitter, GRPG and MWG TRANSMITTER General Description
- 62. System Architecture Transmitter CONTROL/MONITOR BOARD CIRCUIT BREAKER 10 RF AMPLIFIER PANELS (FAIL-SOFT) CABINET REDUNDAT BLOWERS REDUNDANT
- 63. EPG1 CHANNEL A CHANNEL B CPC1 RXG1 SDG MWCG RXG2 EPG2 SWR2 SWR1 CPC2 MWPG SDG:
- 64. System Architecture Microwave Group (MWG) and Compressor Dehydrator Compressor Dehydrator MWG General Description
- 65. System Architecture Channel Distribution for Microwave Group (MWG) HARMONIC FILTER BIDIRECTIONAL COUPLER WAVEGUIDE DUPLEXER (WDD) WAVEGUIDE
- 66. Functional Description Antenna and Pedestal Group (APG) APG assembly performs RF signal radiation and reception with
- 67. Functional Description Transmission Path Diagram General Description
- 68. Functional Description Transmission Path EPG (Frequency Generation). Oscillator signal generation (STALO y COHO). Transmitted signal generation
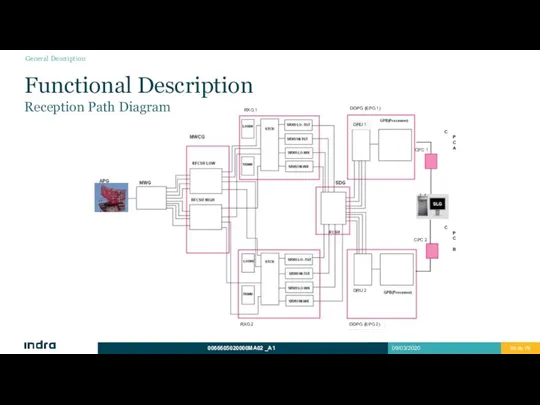
- 69. Functional Description Reception Path Diagram CPC B CPC A DDPG (EPG 1) CPC 1 CPC 2
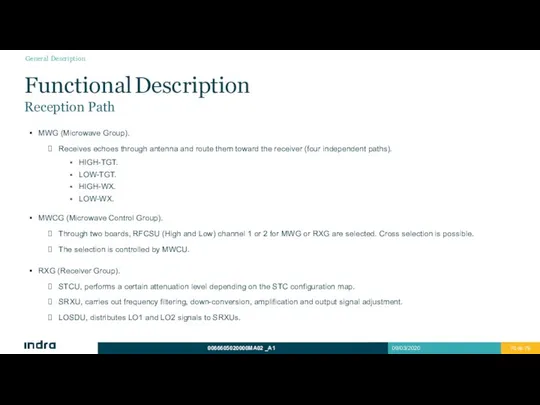
- 70. Functional Description Reception Path MWG (Microwave Group). Receives echoes through antenna and route them toward the
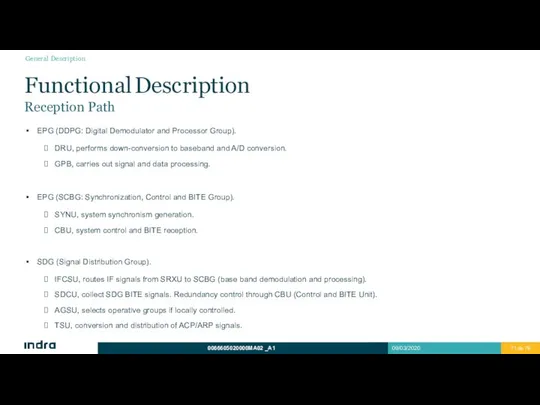
- 71. EPG (DDPG: Digital Demodulator and Processor Group). DRU, performs down-conversion to baseband and A/D conversion. GPB,
- 72. RXG IF test signal from TXGU ? TISMU ? SRXUs. MWG RF test signal from TXGU?
- 73. RXG Stability control (three points of the transmitted signal are monitored) in TXG. These samples are
- 74. Redundant dual channels for reception and signal processing. Automatic fault detection ? possible automatic channel switching.
- 75. System Controlling. Antenna (turning, polarization). Transmitter (radiation on/off). Possibility of switching in various points. Operation mode
- 76. Performance evaluation. Test target injection. Permanent Echoes. Signal processing. Pulse compression. MTD filtering. CFAR techniques. Clutter
- 77. Operation and Monitoring Control and Monitoring System Main Screen General Description
- 78. All failures are reported and are monitored in both Local or Remote Control and Monitoring System
- 80. Скачать презентацию
The data and information, in its totality or partial expression, contained
The data and information, in its totality or partial expression, contained
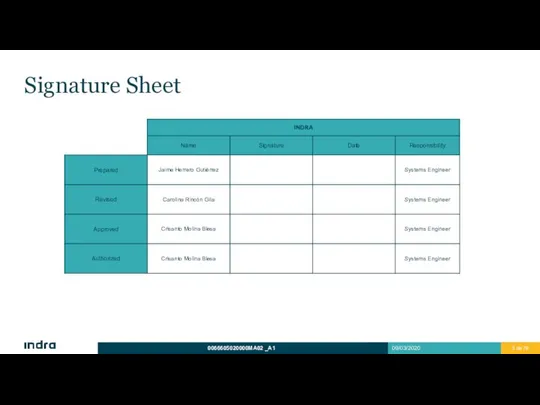
Signature Sheet
Signature Sheet
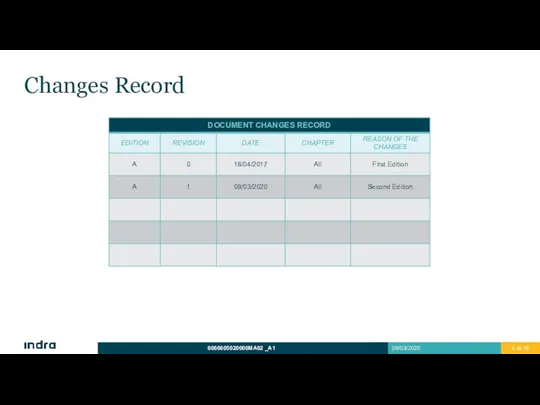
Changes Record
Changes Record
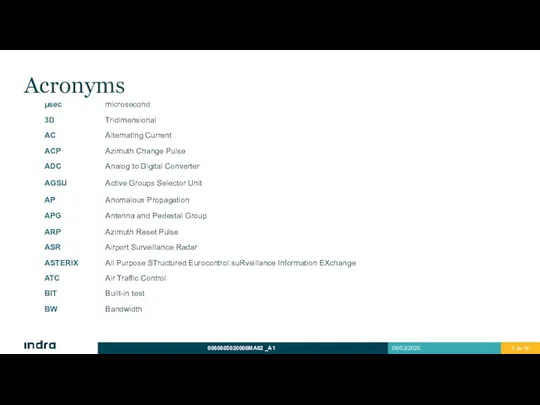
Acronyms
Acronyms
Acronyms
Acronyms
Acronyms
Acronyms
Acronyms
Acronyms

Acronyms
Acronyms
Acronyms
Acronyms
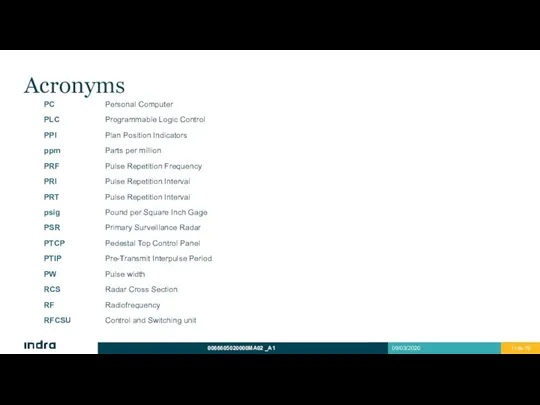
Acronyms
Acronyms
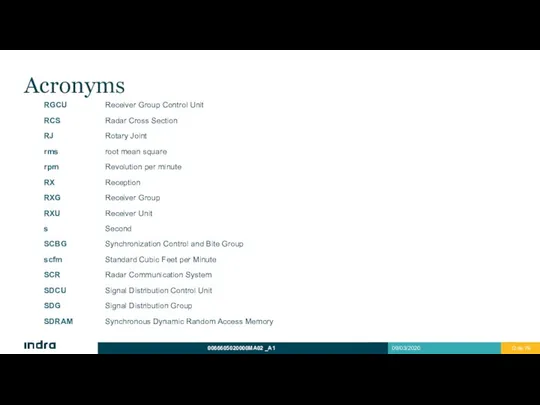
Acronyms
Acronyms
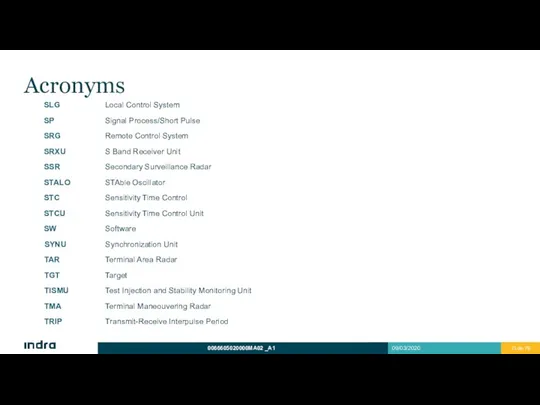
Acronyms
Acronyms
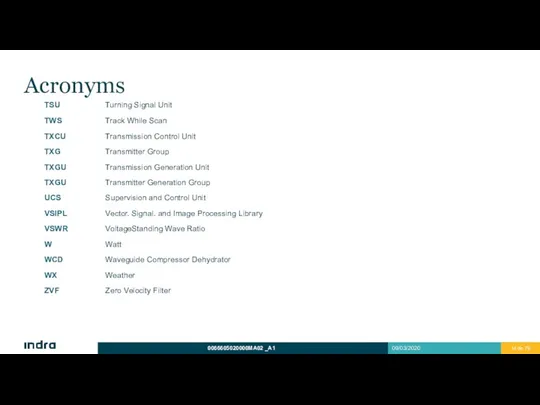
Acronyms
Acronyms

1
Preliminary Notions
1
Preliminary Notions
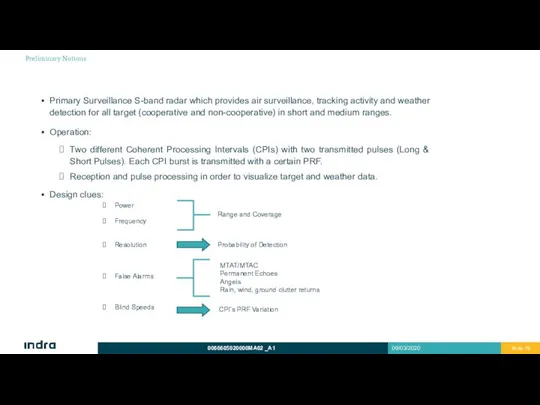
Primary Surveillance S-band radar which provides air surveillance, tracking activity and
Primary Surveillance S-band radar which provides air surveillance, tracking activity and
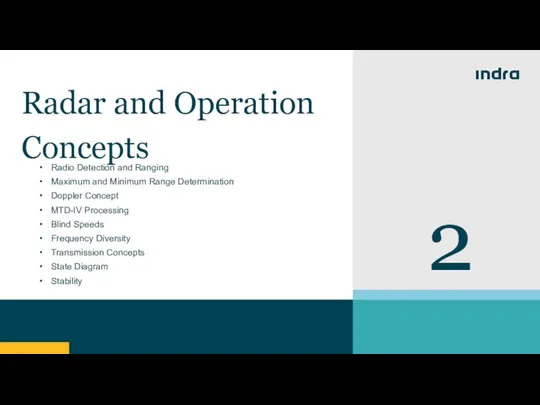
2
Radar and Operation Concepts
Radio Detection and Ranging
Maximum and Minimum Range Determination
2
Radar and Operation Concepts
Radio Detection and Ranging
Maximum and Minimum Range Determination
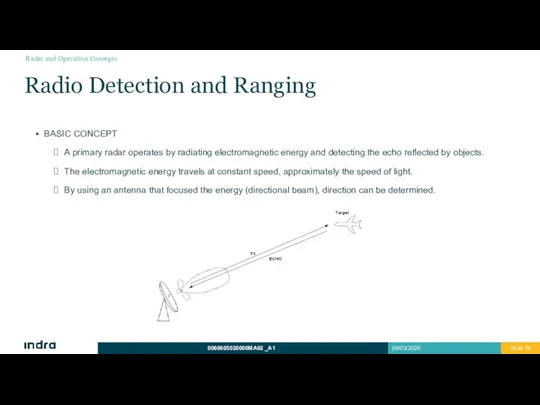
Radio Detection and Ranging
BASIC CONCEPT
A primary radar operates by radiating electromagnetic
Radio Detection and Ranging
BASIC CONCEPT
A primary radar operates by radiating electromagnetic
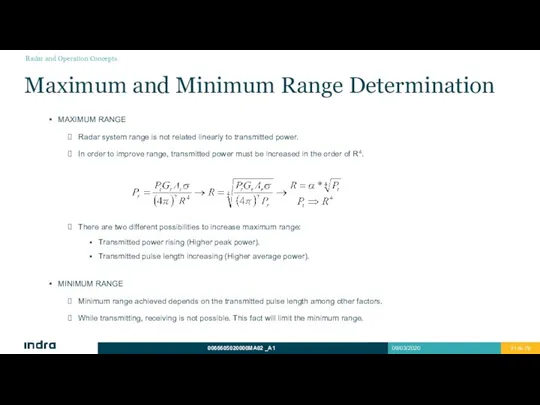
Maximum and Minimum Range Determination
MAXIMUM RANGE
Radar system range is
Maximum and Minimum Range Determination
MAXIMUM RANGE
Radar system range is
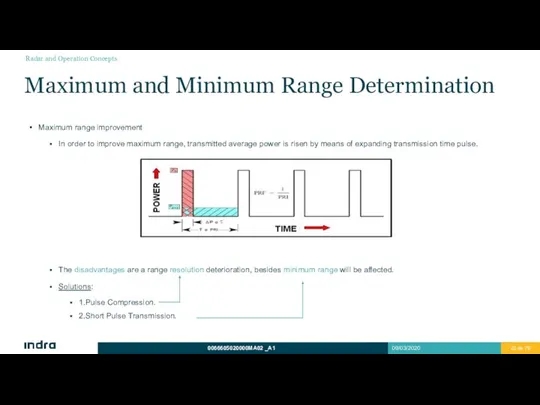
Maximum and Minimum Range Determination
Maximum range improvement
In order to
Maximum and Minimum Range Determination
Maximum range improvement
In order to
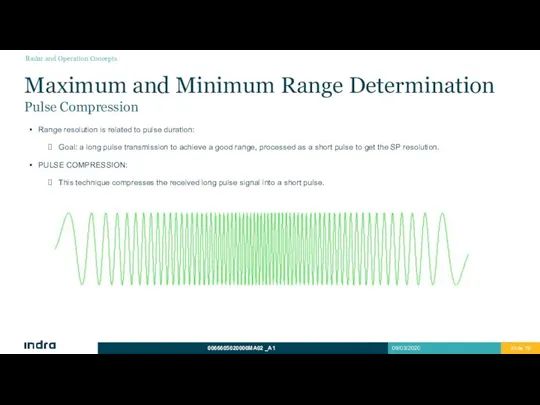
Maximum and Minimum Range Determination
Pulse Compression
Range resolution is related
Maximum and Minimum Range Determination
Pulse Compression
Range resolution is related
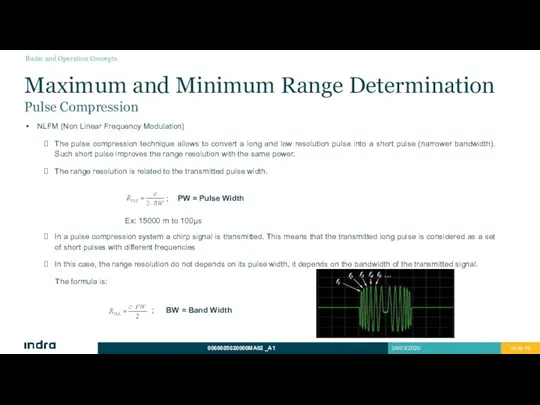
Maximum and Minimum Range Determination
Pulse Compression
NLFM (Non Linear Frequency
Maximum and Minimum Range Determination
Pulse Compression
NLFM (Non Linear Frequency
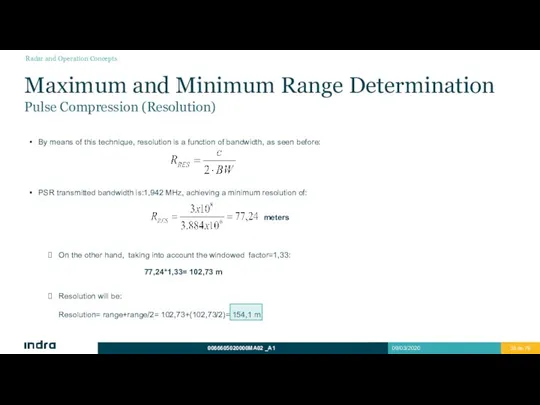
Maximum and Minimum Range Determination
Pulse Compression (Resolution)
By means of this
Maximum and Minimum Range Determination
Pulse Compression (Resolution)
By means of this
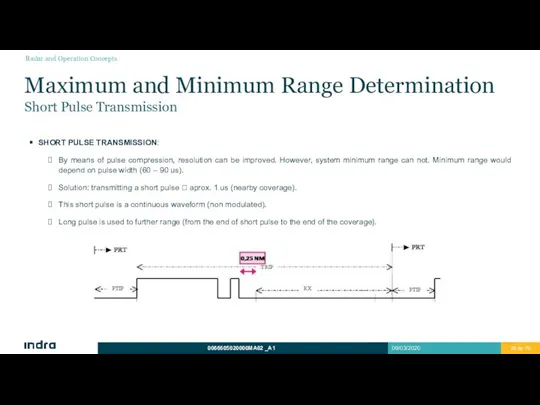
Maximum and Minimum Range Determination
Short Pulse Transmission
SHORT PULSE TRANSMISSION:
By
Maximum and Minimum Range Determination
Short Pulse Transmission
SHORT PULSE TRANSMISSION:
By
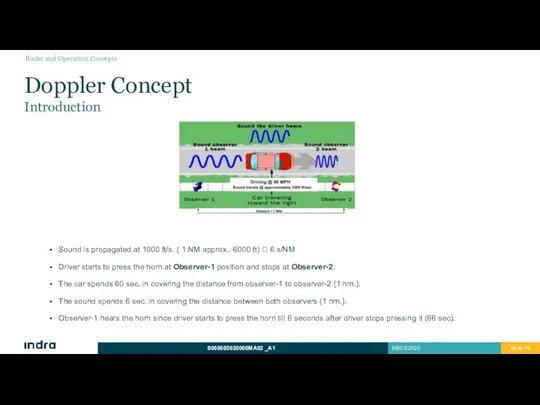
Doppler Concept
Introduction
Doppler Frequency:
Changes in electromagnetic frequency that occurs when the source
Doppler Concept
Introduction
Doppler Frequency:
Changes in electromagnetic frequency that occurs when the source
Doppler Concept
Introduction
Sound is propagated at 1000 ft/s. ( 1 NM approx..
Doppler Concept
Introduction
Sound is propagated at 1000 ft/s. ( 1 NM approx..
Doppler Concept
Introduction
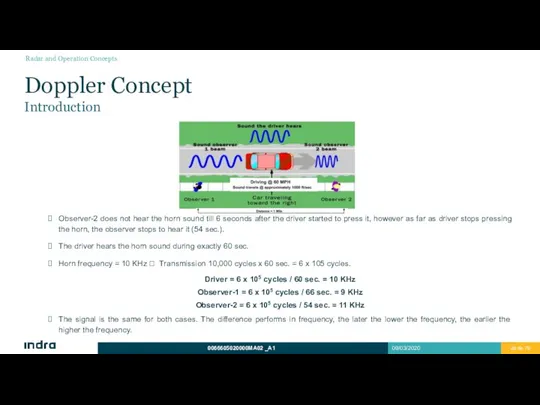
Observer-2 does not hear the horn sound till 6 seconds
Doppler Concept
Introduction
Observer-2 does not hear the horn sound till 6 seconds
Doppler Concept
Radar Application
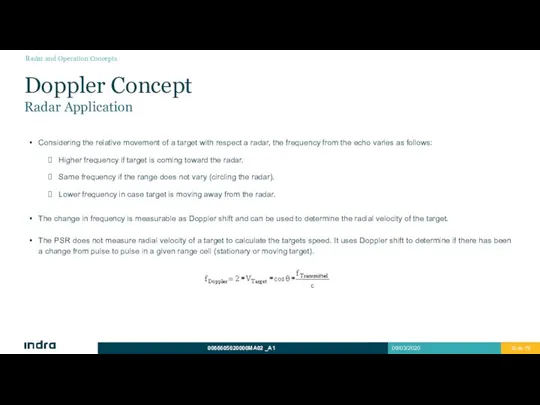
Considering the relative movement of a target with
Doppler Concept
Radar Application
Considering the relative movement of a target with
Doppler Concept
Radar Application
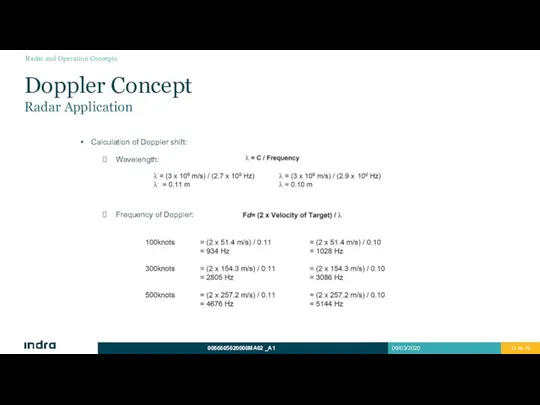
Calculation of Doppler shift:
Wavelength:
Frequency of Doppler:
Radar
Doppler Concept
Radar Application
Calculation of Doppler shift:
Wavelength:
Frequency of Doppler:
Radar
It is impossible to determine a Doppler change from one pulse
It is impossible to determine a Doppler change from one pulse
MTD-IV Processing
Doppler Speed
Doppler processing:
MTD Filter bank.
High resolution for targets flying
MTD-IV Processing
Doppler Speed
Doppler processing:
MTD Filter bank.
High resolution for targets flying
MTD-IV Processing: Doppler Speed
Radar velocity (knot)
Radar velocity (knot)
Radar and Operation Concepts
MTD-IV Processing: Doppler Speed
Radar velocity (knot)
Radar velocity (knot)
Radar and Operation Concepts
MTD-IV Processing: Doppler Speed
PRF Concept
The Pulse Repetition Frequency (PRF) is the
MTD-IV Processing: Doppler Speed
PRF Concept
The Pulse Repetition Frequency (PRF) is the
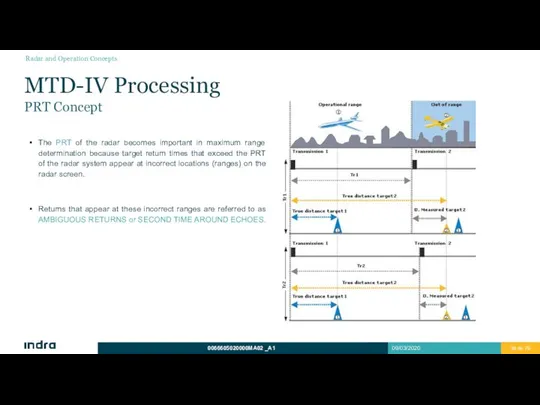
MTD-IV Processing
PRT Concept
The PRT of the radar becomes important in maximum
MTD-IV Processing
PRT Concept
The PRT of the radar becomes important in maximum
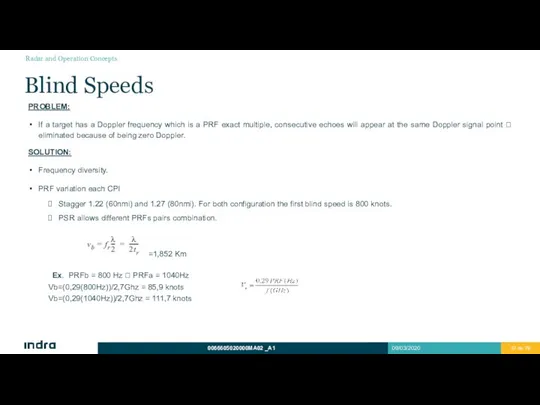
Blind Speeds
PROBLEM:
If a target has a Doppler frequency which is a
Blind Speeds
PROBLEM:
If a target has a Doppler frequency which is a
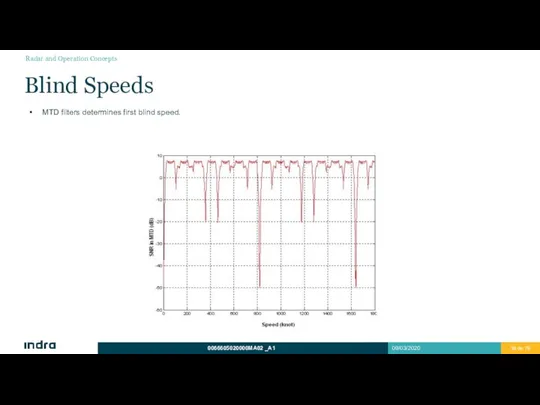
Blind Speeds
MTD filters determines first blind speed.
Radar and Operation Concepts
Blind Speeds
MTD filters determines first blind speed.
Radar and Operation Concepts
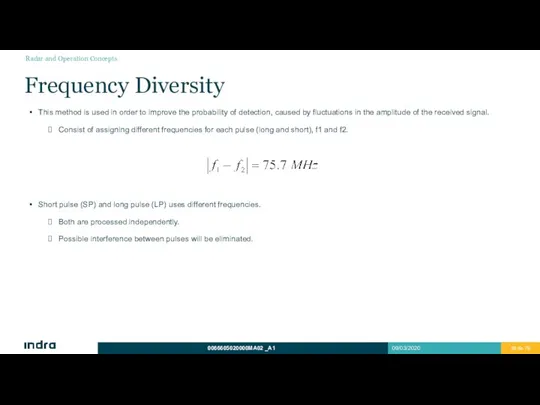
Frequency Diversity
This method is used in order to improve the probability
Frequency Diversity
This method is used in order to improve the probability
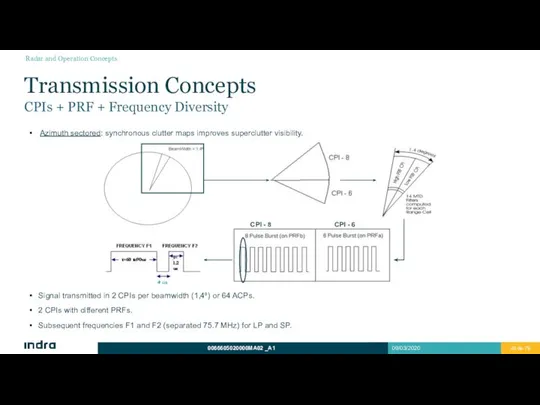
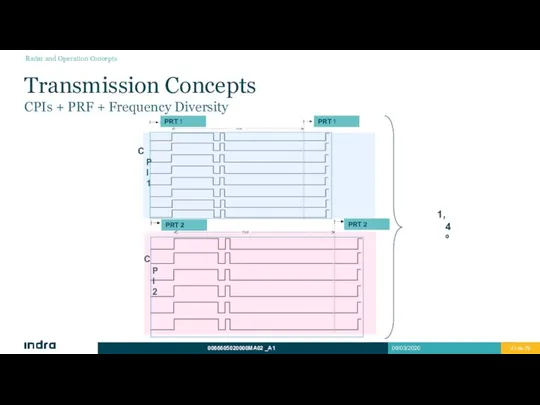
Transmission Concepts
CPIs + PRF + Frequency Diversity
Signal transmitted in 2 CPIs
Transmission Concepts
CPIs + PRF + Frequency Diversity
Signal transmitted in 2 CPIs
CPI 1
CPI 2
1,4 º
Transmission Concepts
CPIs + PRF + Frequency
CPI 1
CPI 2
1,4 º
Transmission Concepts CPIs + PRF + Frequency
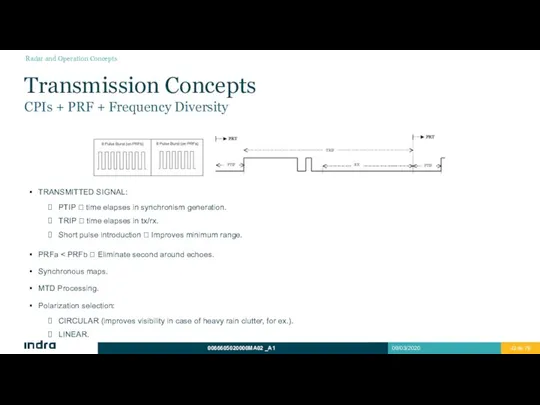
Transmission Concepts
CPIs + PRF + Frequency Diversity
TRANSMITTED SIGNAL:
PTIP ? time elapses
Transmission Concepts
CPIs + PRF + Frequency Diversity
TRANSMITTED SIGNAL:
PTIP ? time elapses
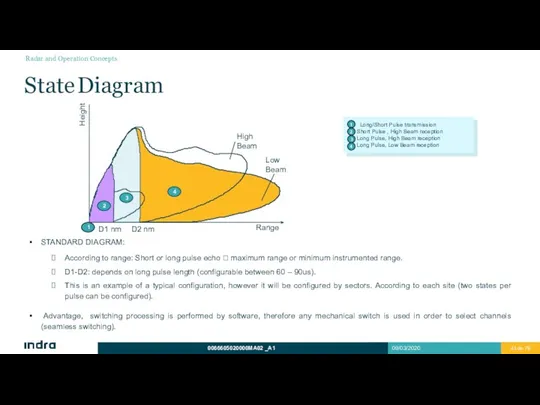
State Diagram
STANDARD DIAGRAM:
According to range: Short or long pulse echo ?
State Diagram
STANDARD DIAGRAM:
According to range: Short or long pulse echo ?
Stability
STABILITY ?COHERENT RADAR
Outstanding measurement in radars which uses Doppler (instabilities can
Stability
STABILITY ?COHERENT RADAR
Outstanding measurement in radars which uses Doppler (instabilities can

3
Design Features
Evolution
Main Features
Characteristic Summary
3
Design Features
Evolution
Main Features
Characteristic Summary
Evolution
Collects features about Indra 3D radar (Lanza).
Designed following the EUROCONTROL
Evolution
Collects features about Indra 3D radar (Lanza).
Designed following the EUROCONTROL
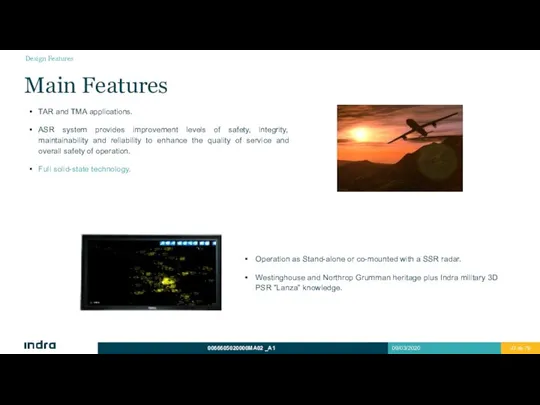
Main Features
TAR and TMA applications.
ASR system provides improvement levels of safety,
Main Features
TAR and TMA applications.
ASR system provides improvement levels of safety,
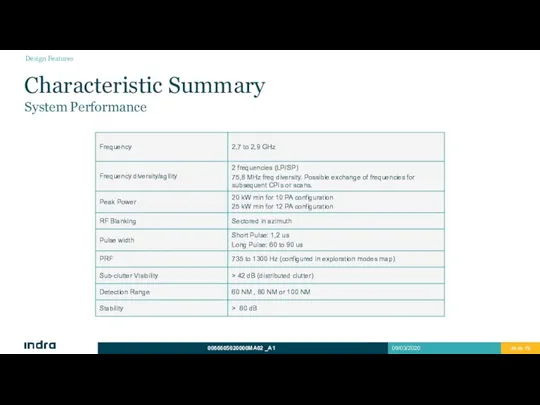
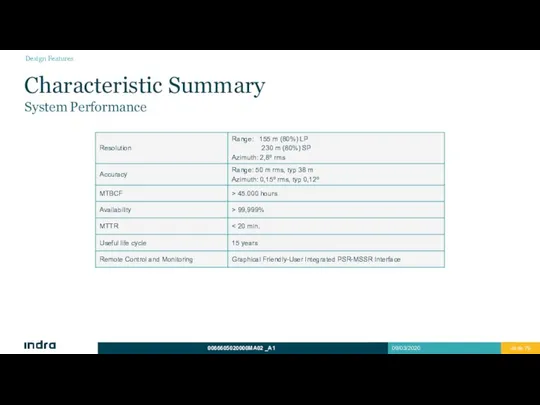
Characteristic Summary
System Performance
Design Features
Characteristic Summary
System Performance
Design Features
Characteristic Summary
System Performance
Design Features
Characteristic Summary
System Performance
Design Features
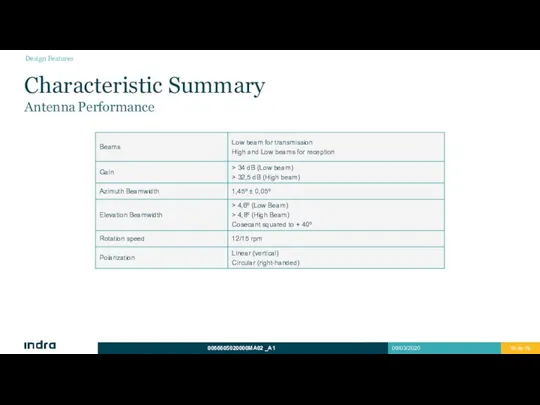
Characteristic Summary
Antenna Performance
Design Features
Characteristic Summary
Antenna Performance
Design Features
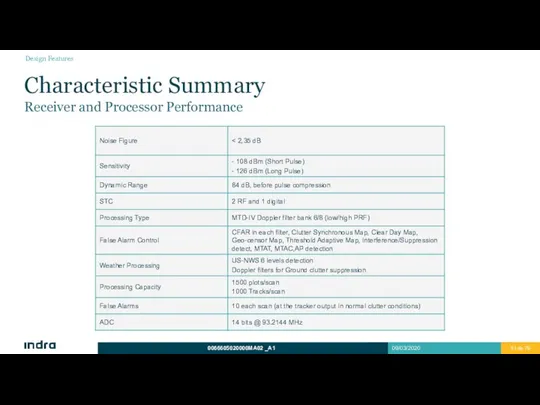
Characteristic Summary
Receiver and Processor Performance
Design Features
Characteristic Summary
Receiver and Processor Performance
Design Features
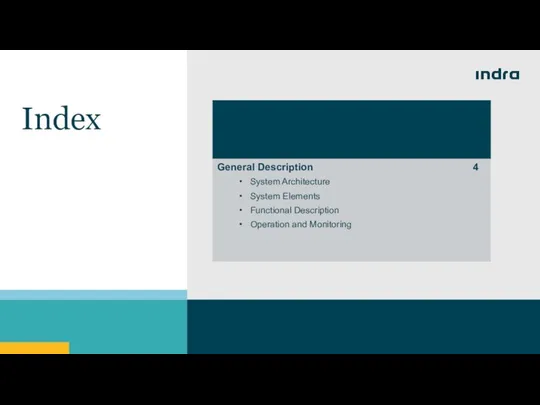
4
General Description
System Architecture
System Elements
Functional Description
Operation and Monitoring
4
General Description
System Architecture
System Elements
Functional Description
Operation and Monitoring
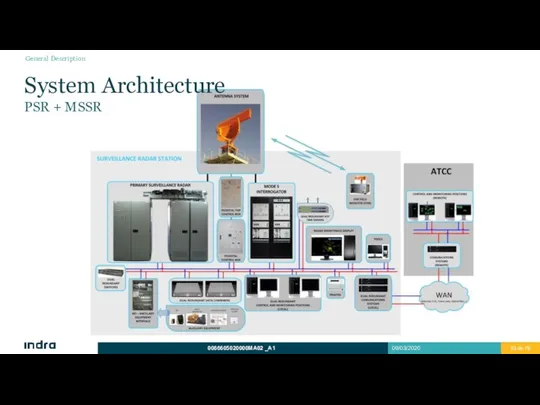
System Architecture
PSR + MSSR
General Description
System Architecture
PSR + MSSR
General Description
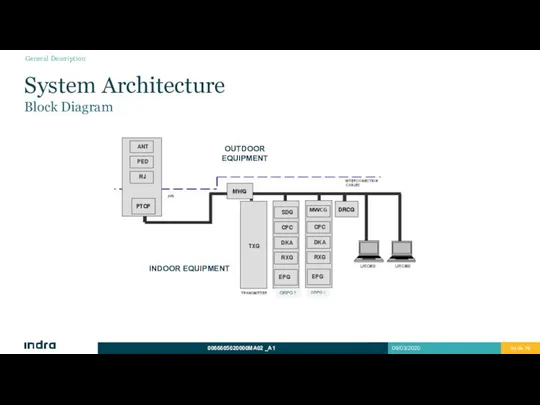
System Architecture
Block Diagram
OUTDOOR EQUIPMENT
INDOOR EQUIPMENT
GRPG 1
GRPG 2
General Description
System Architecture
Block Diagram
OUTDOOR EQUIPMENT
INDOOR EQUIPMENT
GRPG 1
GRPG 2
General Description
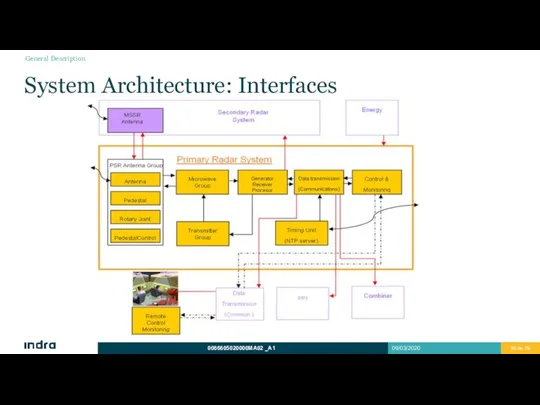
System Architecture: Interfaces
General Description
System Architecture: Interfaces
General Description
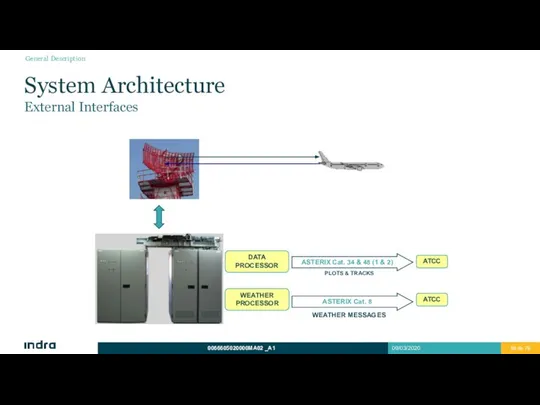
System Architecture
External Interfaces
ASTERIX Cat. 34 & 48 (1 & 2)
ATCC
DATA PROCESSOR
WEATHER
System Architecture
External Interfaces
ASTERIX Cat. 34 & 48 (1 & 2)
ATCC
DATA PROCESSOR
WEATHER
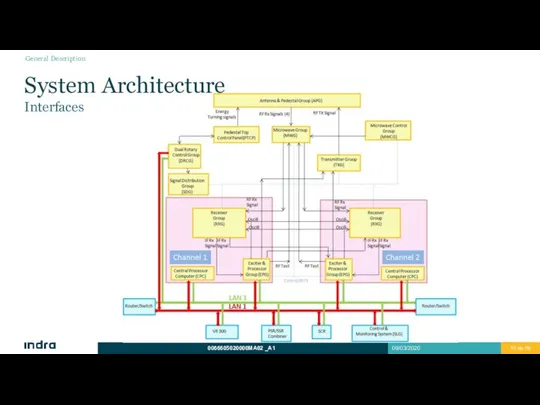
System Architecture
Interfaces
General Description
System Architecture
Interfaces
General Description
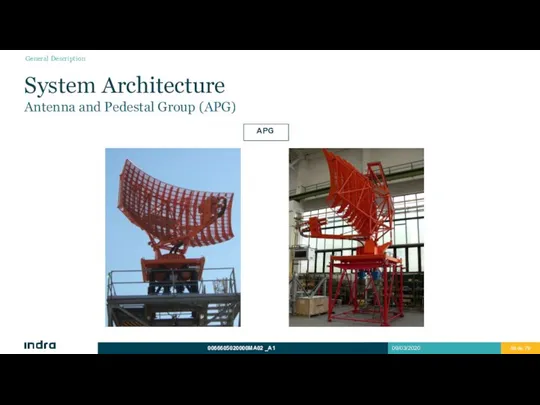
System Architecture
Antenna and Pedestal Group (APG)
APG
General Description
System Architecture
Antenna and Pedestal Group (APG)
APG
General Description
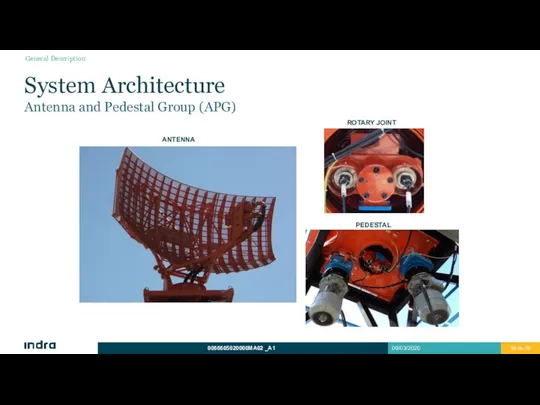
System Architecture
Antenna and Pedestal Group (APG)
ANTENNA
PEDESTAL
ROTARY JOINT
General
System Architecture
Antenna and Pedestal Group (APG)
ANTENNA
PEDESTAL
ROTARY JOINT
General
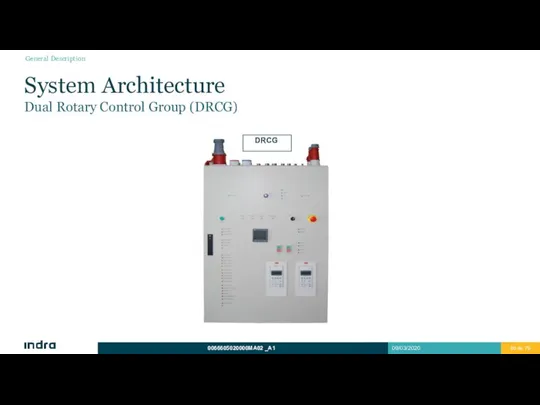
System Architecture
Dual Rotary Control Group (DRCG)
General Description
System Architecture
Dual Rotary Control Group (DRCG)
General Description
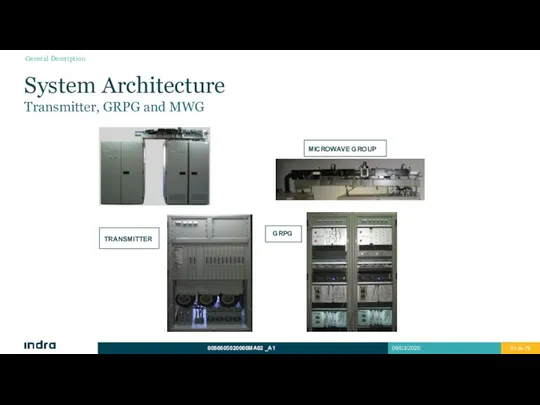
System Architecture
Transmitter, GRPG and MWG
TRANSMITTER
General Description
System Architecture
Transmitter, GRPG and MWG
TRANSMITTER
General Description
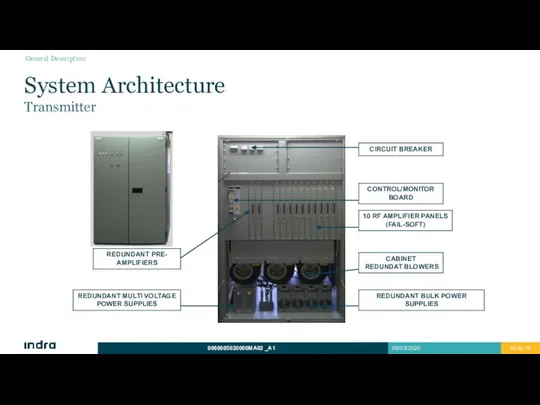
System Architecture
Transmitter
CONTROL/MONITOR BOARD
CIRCUIT BREAKER
10 RF AMPLIFIER PANELS
(FAIL-SOFT)
CABINET
REDUNDAT BLOWERS
REDUNDANT BULK
System Architecture
Transmitter
CONTROL/MONITOR BOARD
CIRCUIT BREAKER
10 RF AMPLIFIER PANELS
(FAIL-SOFT)
CABINET
REDUNDAT BLOWERS
REDUNDANT BULK
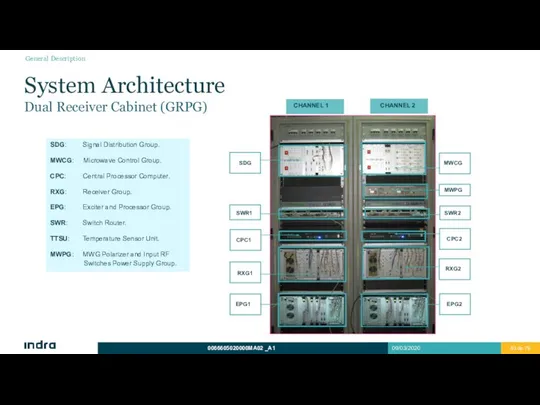
EPG1
CHANNEL A
CHANNEL B
CPC1
RXG1
SDG
MWCG
RXG2
EPG2
SWR2
SWR1
CPC2
MWPG
SDG: Signal Distribution Group.
MWCG:
EPG1
CHANNEL A
CHANNEL B
CPC1
RXG1
SDG
MWCG
RXG2
EPG2
SWR2
SWR1
CPC2
MWPG
SDG: Signal Distribution Group.
MWCG:
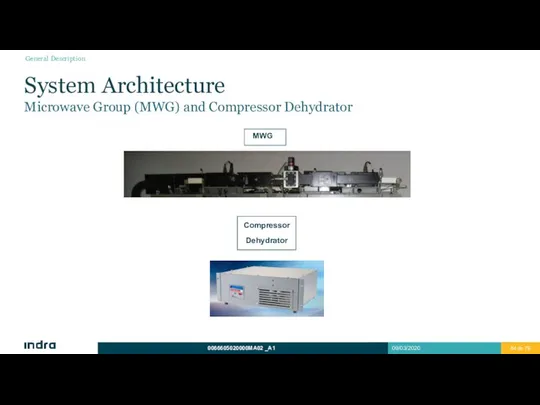
System Architecture
Microwave Group (MWG) and Compressor Dehydrator
Compressor
Dehydrator
MWG
General Description
System Architecture
Microwave Group (MWG) and Compressor Dehydrator
Compressor
Dehydrator
MWG
General Description
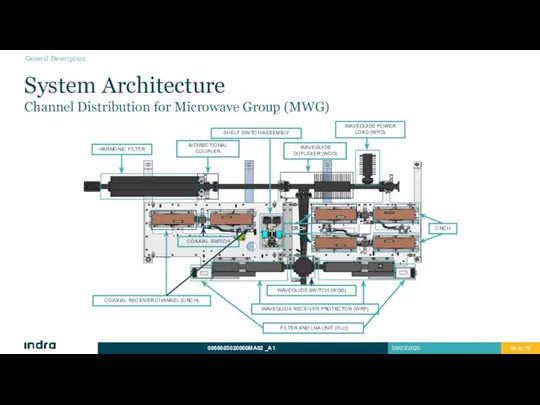
System Architecture
Channel Distribution for Microwave Group (MWG)
HARMONIC FILTER
BIDIRECTIONAL COUPLER
WAVEGUIDE
System Architecture
Channel Distribution for Microwave Group (MWG)
HARMONIC FILTER
BIDIRECTIONAL COUPLER
WAVEGUIDE
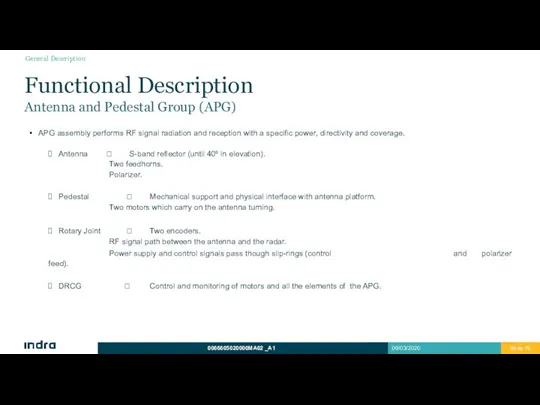
Functional Description
Antenna and Pedestal Group (APG)
APG assembly performs RF signal radiation
Functional Description
Antenna and Pedestal Group (APG)
APG assembly performs RF signal radiation
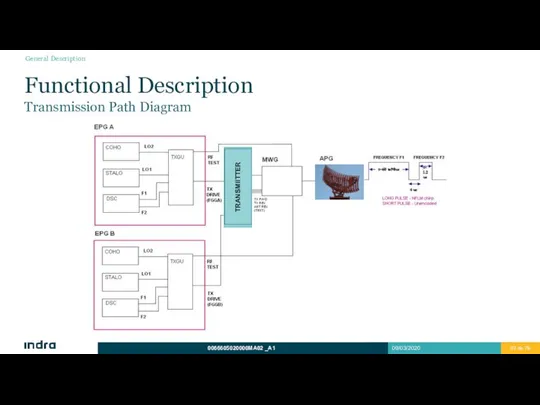
Functional Description
Transmission Path Diagram
General Description
Functional Description
Transmission Path Diagram
General Description
Functional Description
Transmission Path
EPG (Frequency Generation).
Oscillator signal generation (STALO y COHO).
Transmitted
Functional Description
Transmission Path
EPG (Frequency Generation).
Oscillator signal generation (STALO y COHO).
Transmitted
Functional Description
Reception Path Diagram
CPC B
CPC A
DDPG (EPG 1)
CPC
Functional Description
Reception Path Diagram
CPC B
CPC A
DDPG (EPG 1)
CPC
Functional Description
Reception Path
MWG (Microwave Group).
Receives echoes through antenna and
Functional Description
Reception Path
MWG (Microwave Group).
Receives echoes through antenna and
EPG (DDPG: Digital Demodulator and Processor Group).
DRU, performs down-conversion to baseband
EPG (DDPG: Digital Demodulator and Processor Group).
DRU, performs down-conversion to baseband
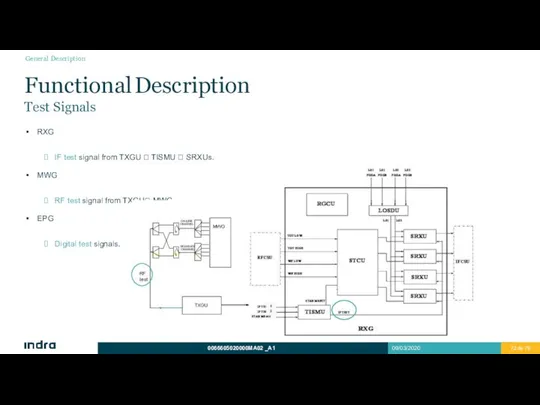
RXG
IF test signal from TXGU ? TISMU ? SRXUs.
MWG
RF test
RXG
IF test signal from TXGU ? TISMU ? SRXUs.
MWG
RF test
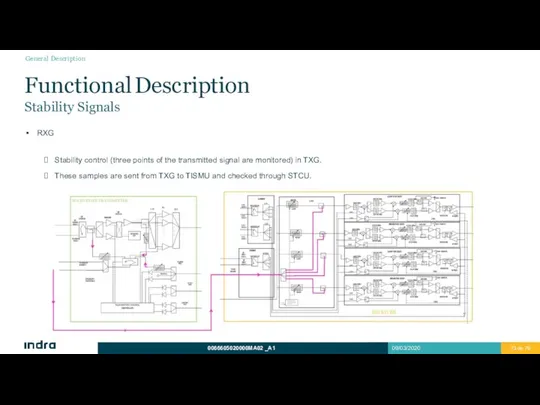
RXG
Stability control (three points of the transmitted signal are monitored) in
RXG
Stability control (three points of the transmitted signal are monitored) in
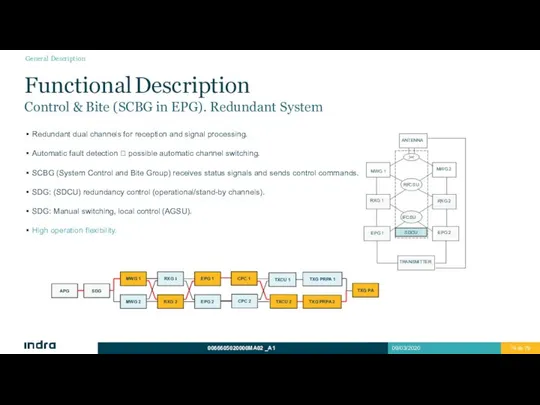
Redundant dual channels for reception and signal processing.
Automatic fault detection
Redundant dual channels for reception and signal processing.
Automatic fault detection
System Controlling.
Antenna (turning, polarization).
Transmitter (radiation on/off).
Possibility of switching in various points.
Operation
System Controlling.
Antenna (turning, polarization).
Transmitter (radiation on/off).
Possibility of switching in various points.
Operation
Performance evaluation.
Test target injection.
Permanent Echoes.
Signal processing.
Pulse compression.
MTD filtering. CFAR techniques.
Clutter
Performance evaluation.
Test target injection.
Permanent Echoes.
Signal processing.
Pulse compression.
MTD filtering. CFAR techniques.
Clutter
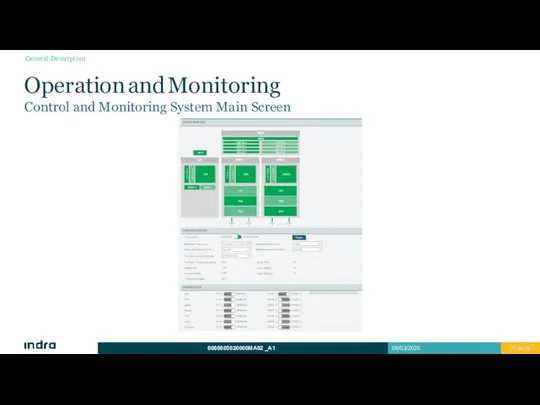
Operation and Monitoring
Control and Monitoring System Main Screen
General Description
Operation and Monitoring
Control and Monitoring System Main Screen
General Description
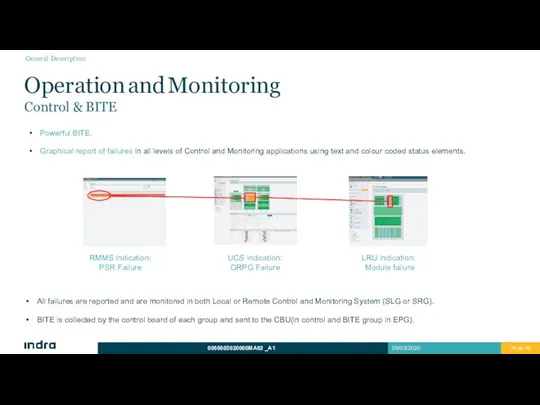
All failures are reported and are monitored in both Local or
All failures are reported and are monitored in both Local or
 Реляционная модель данных
 Классы-оболочки в Java. (Лекция 7)
 Функциональная структура АСУ ТП
 Телеканал ТВ-3
 Введение в информатику
 Хранение, обмен, транспортировка больших объемов информации. Внешние запоминающие устройства. Их технические характеристики
 Криптография 2018. Способы защиты информации
 Язык программирования “Cello”
 ЧАС СУДА. СОТОВЫЙ ТЕЛЕФОН: ЗА И ПРОТИВ
 Проект ученицы 9 класса Кумицкой Анны
 Презентация "Создание компьютерных тестов" - скачать презентации по Информатике
 Создание и использование функций в языке Си
 Поняття робочої групи, домену, користувача й сеансу користувача
 The Kunstkammer
 Коммуникационные технологии
 ИС Аптека
 Профессия программист
 Календарь Тигр
 Использование базы данных в приложениях Tizen
 Подготовка устройств самообслуживания к установке банковского ПО
 Игры на ПК и на айфон
 Создание сайта на WordPress
 Презентация "Информатика 7 класс" - скачать презентации по Информатике
 Малая компьютерная академия Шаг
 Магистраль модульных принципов
 Распределение номеров ГТД на комплект (комплектующие) при сборке (разборке) товаров
 Динамические игры на pascal (TRASHKILLER)
 Поняття моделі. Типи моделей. Урок 5. 5 класс