- Remote Sensing Laboratory

Содержание
- 2. - Reference signal Comparison of Impulse and Holographic Radar Principle Circuits
- 3. Recording a Point Source in Optical Holography and its Hologram Reconstruction Hologram registration Hologram reconstruction
- 4. RASCAN-4/2000 2 GHz RASCAN-5/4000, 4 GHz RASCAN-5/7000, 7 GHz RASCAN-Series Radars
- 5. Comparative Table of RASCAN-Series Radars (*) - Low emitting power guarantees full safety for personnel while
- 6. Detail View of RASCAN-5/4000 Radar The Laboratory's staff members had been rewarded with Russian Federation government's
- 7. Inspection of the Church of San Biagio near Siena, Italy The Church of S. Biagio was
- 8. The aim of this experiments was to search for hidden cavities underneath the floor by using
- 9. Radioimages of the medallion in two polarizations A marble medallion on the floor Searching in archives
- 10. Laboratory Model of the Medallion RASCAN (left) and IRT (RIGHT) images of bricks beneath a stone
- 11. Cracks Detection A 30cm by 30cm piece of marble contains two nearly invisible, hairline cracks; one
- 12. The investigation on the Croce di San Marco with Rascan 4/4000 Description of the cross The
- 13. First scanning area The first scanning area is positioned vertically along the trunk of the image
- 14. Investigation on the Croce di S. Marco Parallel – 3.6GHz Cross – 3.7GHz
- 15. Spurt of blood. One of the peculiarities that emerged during the survey is the presence in
- 16. Inspecting Wooden Structures Three dry pine boards with internal termite damage inferred from visible tunnels on
- 17. Wall mosaic "Dedication of the Church to the Virgin" investigation by RASCAN radar of the University
- 18. In St. Petersburg, the famous Senate building, which was built by Italian architect Carlo di Giovanni
- 19. The survey was performed by holographic subsurface radar RASCAN-4/2000 Holographic subsurface radar RASCAN-4/2000in work. Wells with
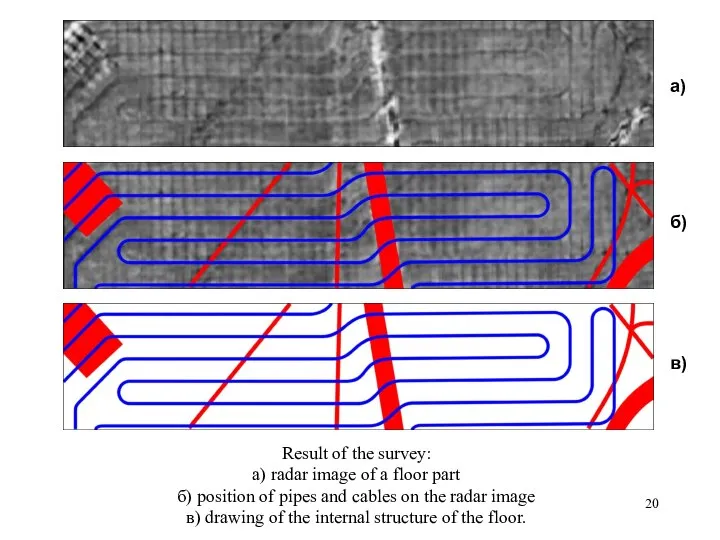
- 20. а) б) в) Result of the survey: а) radar image of a floor part б) position
- 21. The result of surveying was drawn on the floor surface by chalk.
- 22. An Example of Holographic Subsurface Radar Image In this image, it is possible to see how
- 23. Surveying of the Leningradskaya hotel, Moscow
- 25. Surveying of a Concrete Floor Heating plastic pipe Concrete floor inspection
- 27. Examples of RASCAN Diagnostics Radar images of the ferroconcrete walls Radar images of the cinder concrete
- 28. A special experimental setup designed for subsurface radar imaging was applied, it allows sampling at arbitrary
- 29. Dinosaur’s Track Sample A model mold-and-cast dinosaur track was created by making a gypsum plaster cast
- 30. The experiments were conducted in three frequency ranges: 6.4-7.0, 12.8-15.2 and 18.0-21.5 GHz. 6/9 Experimental Results
- 31. Columbia’s Accident Space Shuttle Columbia take off on 16th of January 2003. Columbia’s remains after unfortunate
- 32. Diagnostics of Composite Materials HF holographic radar (22-26 GHz) for composite materials diagnostics
- 33. Diagnostics of Composite Materials Drawing of the sample MW hologram reconstruction
- 34. For the first time for 350 years history of the London Royal Society, the Russian scientists
- 35. CONCLUSION Holographic subsurface radar technology is not universal one. However in some cases it can be
- 36. ACKNOWLEDGMENTS Support for this work was provided by the Russian Science Foundation under project # 21-19-00043
- 38. Скачать презентацию
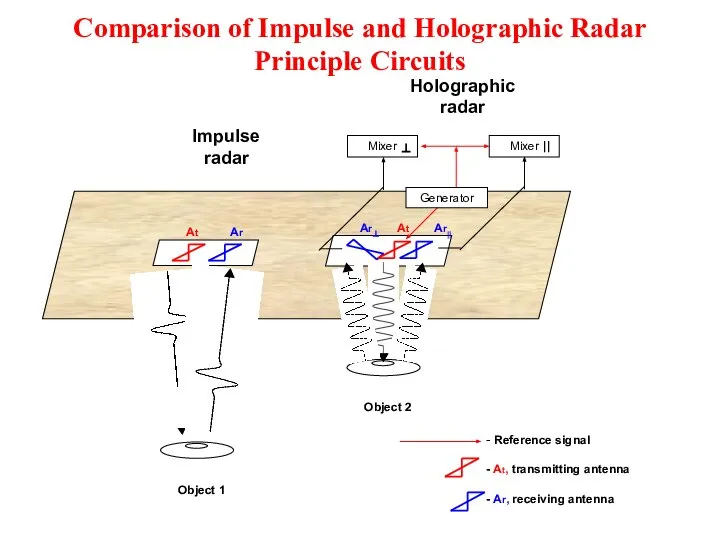
- Reference signal
Comparison of Impulse and Holographic Radar
Principle Circuits
- Reference signal
Comparison of Impulse and Holographic Radar
Principle Circuits
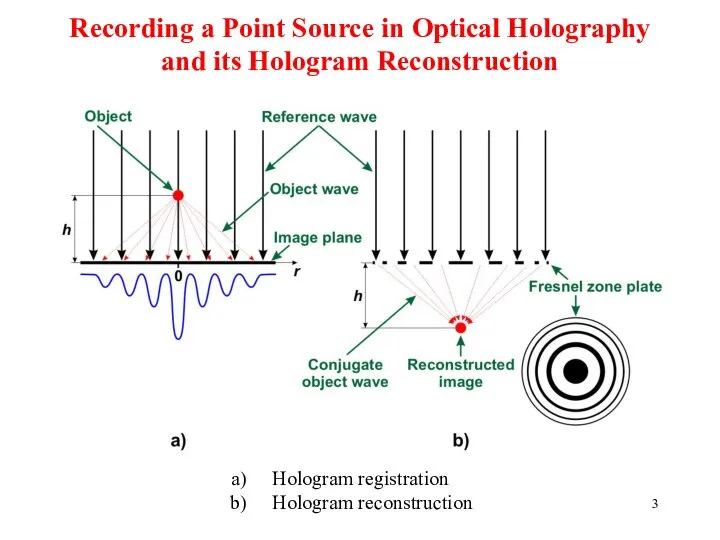
Recording a Point Source in Optical Holography
and its Hologram Reconstruction
Hologram registration
Hologram
Recording a Point Source in Optical Holography
and its Hologram Reconstruction
Hologram registration
Hologram
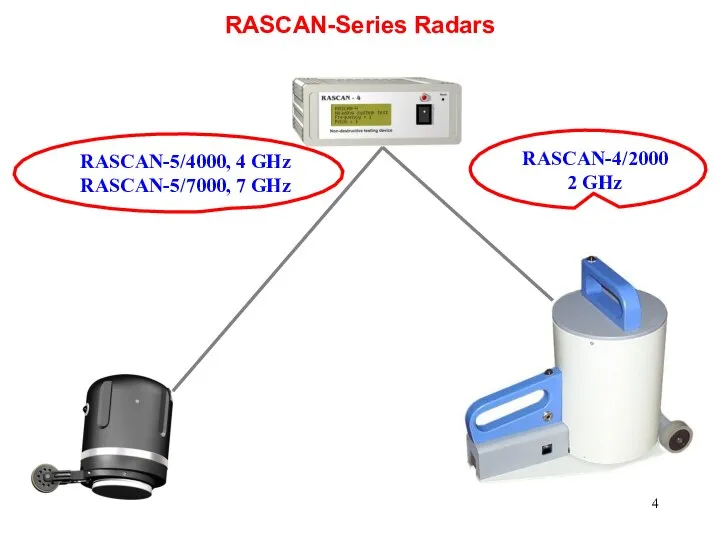
RASCAN-4/2000
2 GHz
RASCAN-5/4000, 4 GHz
RASCAN-5/7000, 7 GHz
RASCAN-Series Radars
RASCAN-4/2000
2 GHz
RASCAN-5/4000, 4 GHz
RASCAN-5/7000, 7 GHz
RASCAN-Series Radars
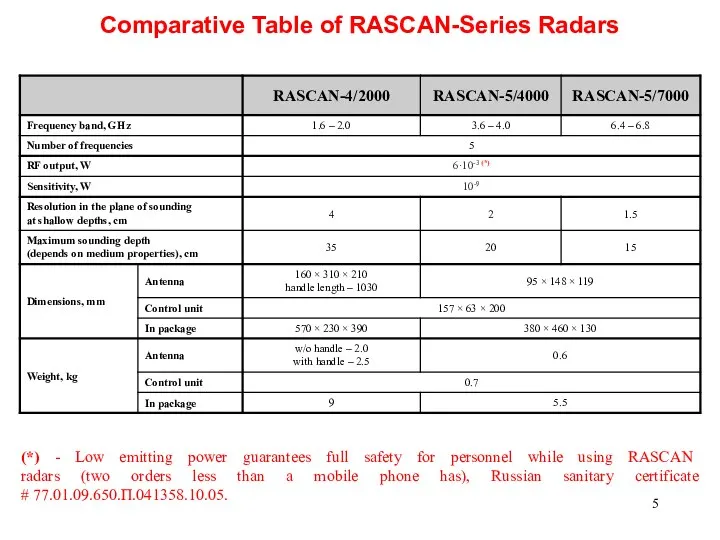
Comparative Table of RASCAN-Series Radars
(*) - Low emitting power guarantees
Comparative Table of RASCAN-Series Radars
(*) - Low emitting power guarantees
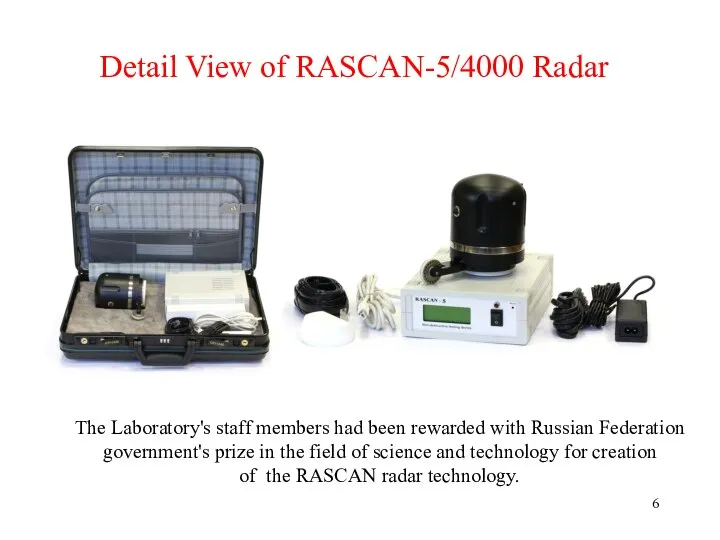
Detail View of RASCAN-5/4000 Radar
The Laboratory's staff members had been rewarded
Detail View of RASCAN-5/4000 Radar
The Laboratory's staff members had been rewarded
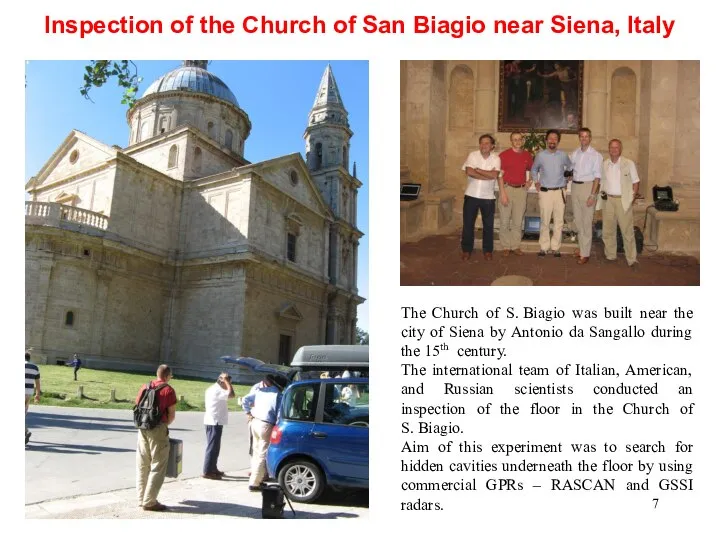
Inspection of the Church of San Biagio near Siena, Italy
The
Inspection of the Church of San Biagio near Siena, Italy
The
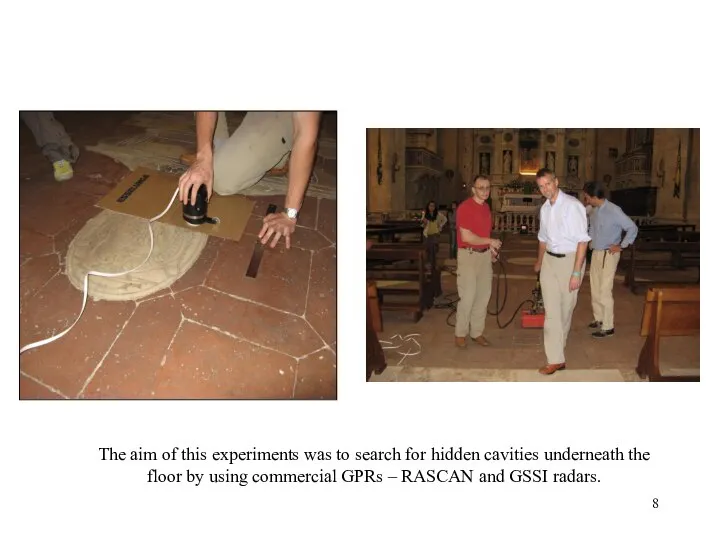
The aim of this experiments was to search for hidden cavities
The aim of this experiments was to search for hidden cavities
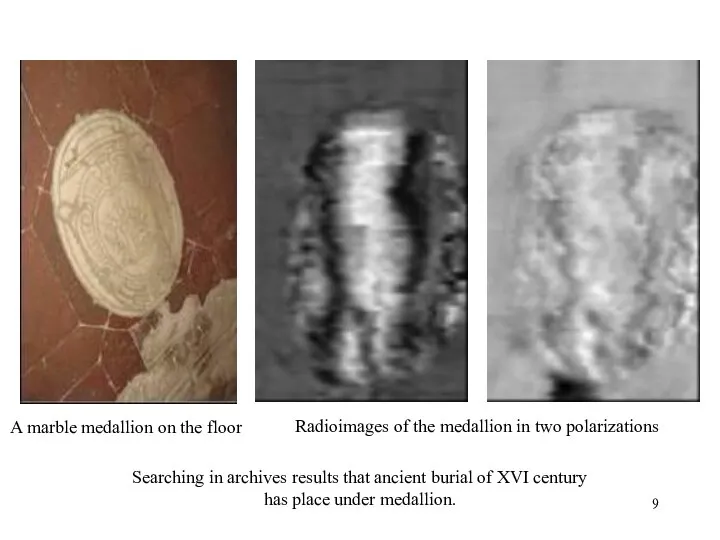
Radioimages of the medallion in two polarizations
A marble medallion on the
Radioimages of the medallion in two polarizations
A marble medallion on the
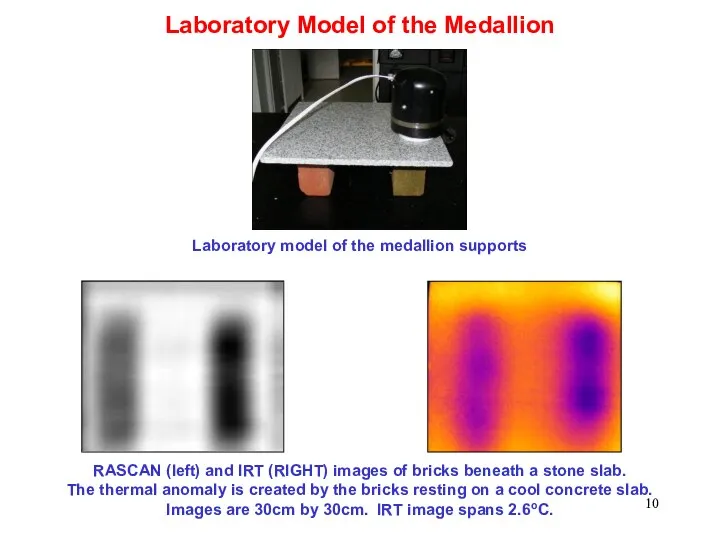
Laboratory Model of the Medallion
RASCAN (left) and IRT (RIGHT) images of
Laboratory Model of the Medallion
RASCAN (left) and IRT (RIGHT) images of
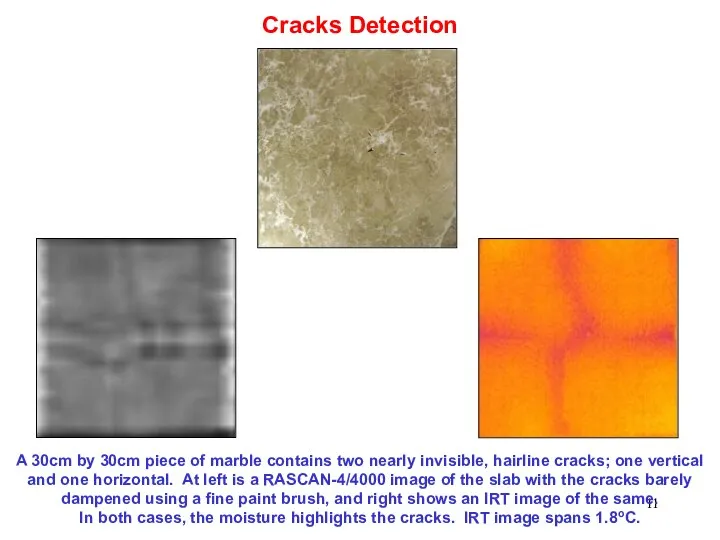
Cracks Detection
A 30cm by 30cm piece of marble contains two nearly
Cracks Detection
A 30cm by 30cm piece of marble contains two nearly
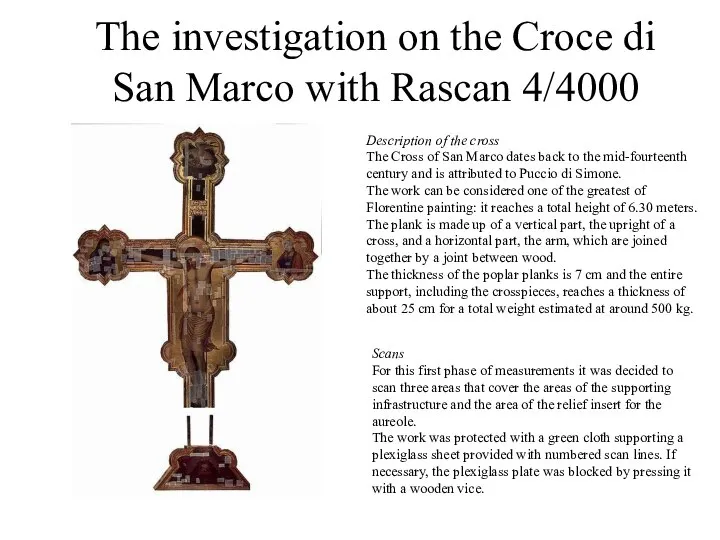
The investigation on the Croce di San Marco with Rascan 4/4000
Description
The investigation on the Croce di San Marco with Rascan 4/4000
Description
First scanning area
The first scanning area is positioned vertically along the
First scanning area
The first scanning area is positioned vertically along the
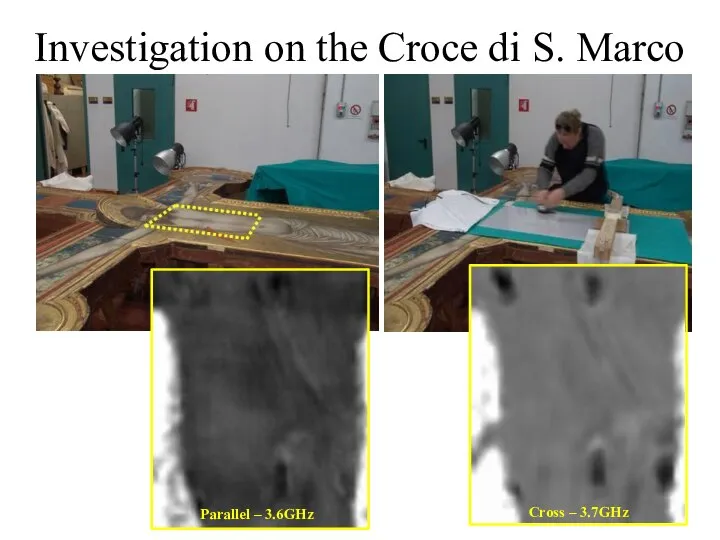
Investigation on the Croce di S. Marco
Parallel – 3.6GHz
Cross – 3.7GHz
Investigation on the Croce di S. Marco
Parallel – 3.6GHz
Cross – 3.7GHz
Spurt of blood.
One of the peculiarities that emerged during the survey
Spurt of blood.
One of the peculiarities that emerged during the survey
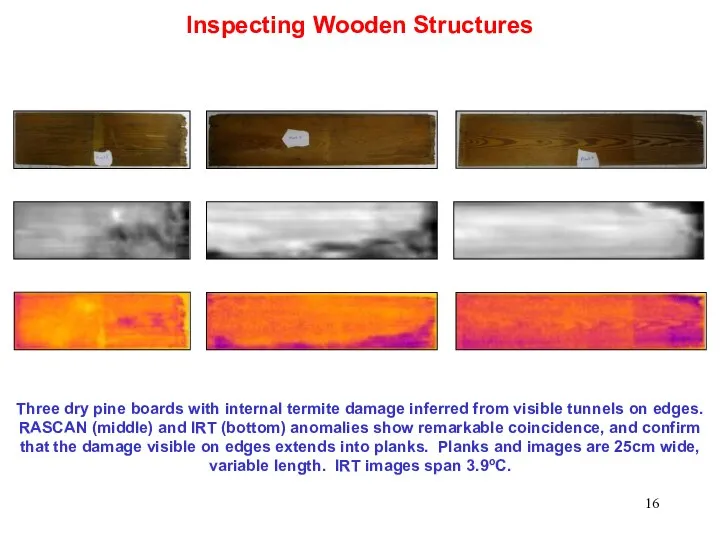
Inspecting Wooden Structures
Three dry pine boards with internal termite damage inferred
Inspecting Wooden Structures
Three dry pine boards with internal termite damage inferred
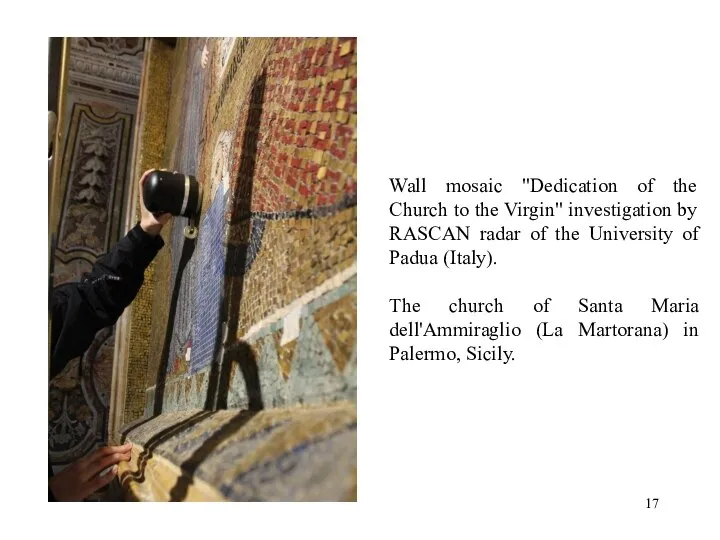
Wall mosaic "Dedication of the Church to the Virgin" investigation by
Wall mosaic "Dedication of the Church to the Virgin" investigation by
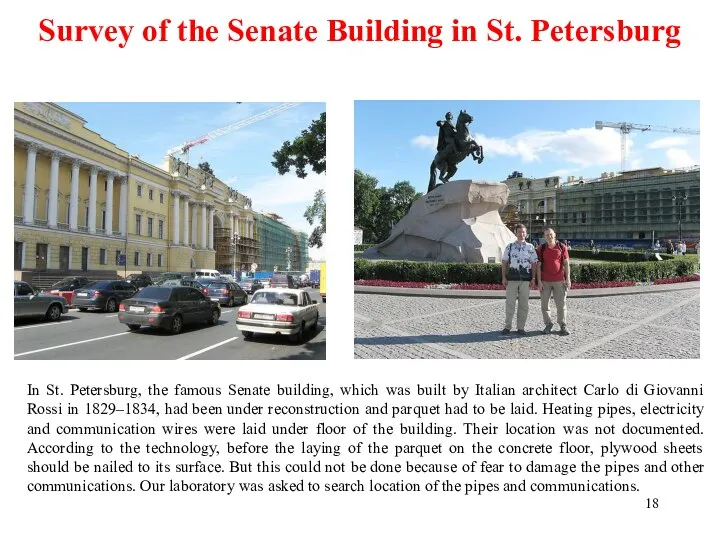
In St. Petersburg, the famous Senate building, which was built by
In St. Petersburg, the famous Senate building, which was built by
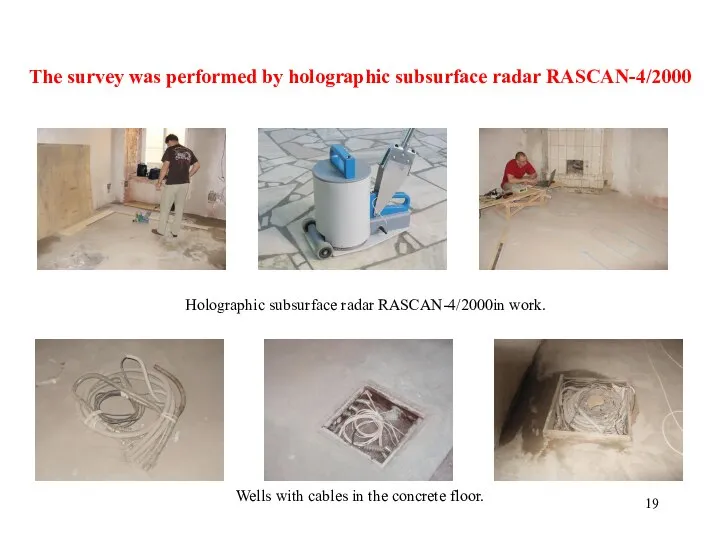
The survey was performed by holographic subsurface radar RASCAN-4/2000
Holographic subsurface radar
The survey was performed by holographic subsurface radar RASCAN-4/2000
Holographic subsurface radar
а)
б)
в)
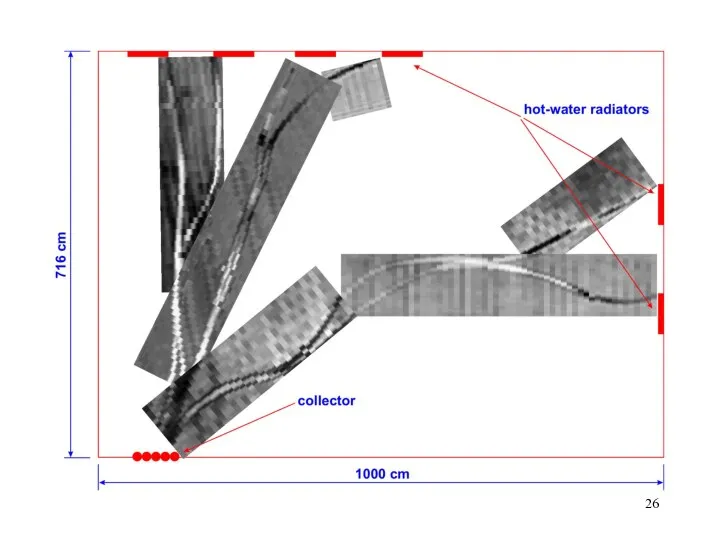
Result of the survey:
а) radar image of a floor part
б)
а)
б)
в)
Result of the survey:
а) radar image of a floor part
б)
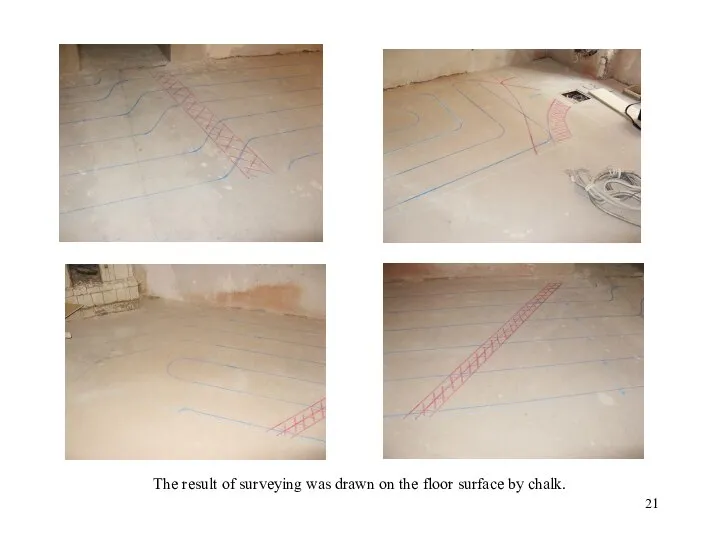
The result of surveying was drawn on the floor surface by
The result of surveying was drawn on the floor surface by
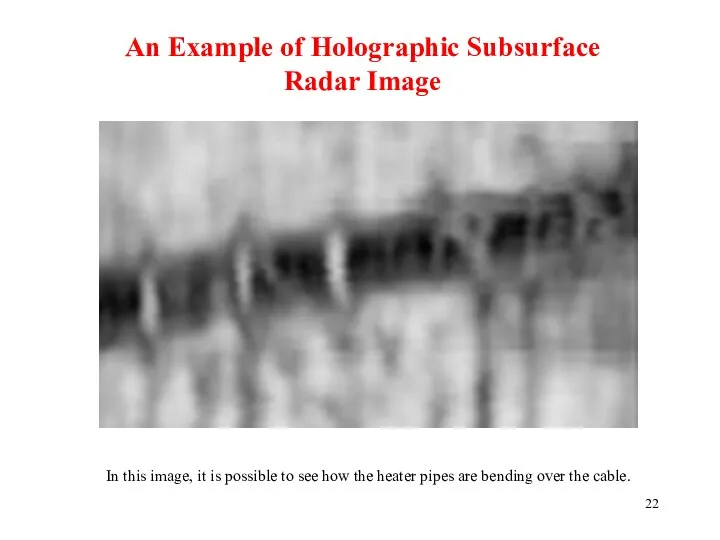
An Example of Holographic Subsurface
Radar Image
In this image, it is possible
An Example of Holographic Subsurface
Radar Image
In this image, it is possible
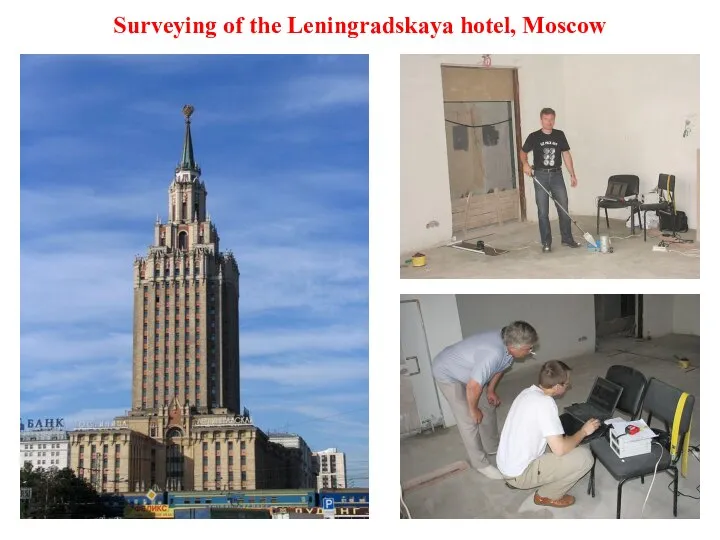
Surveying of the Leningradskaya hotel, Moscow
Surveying of the Leningradskaya hotel, Moscow

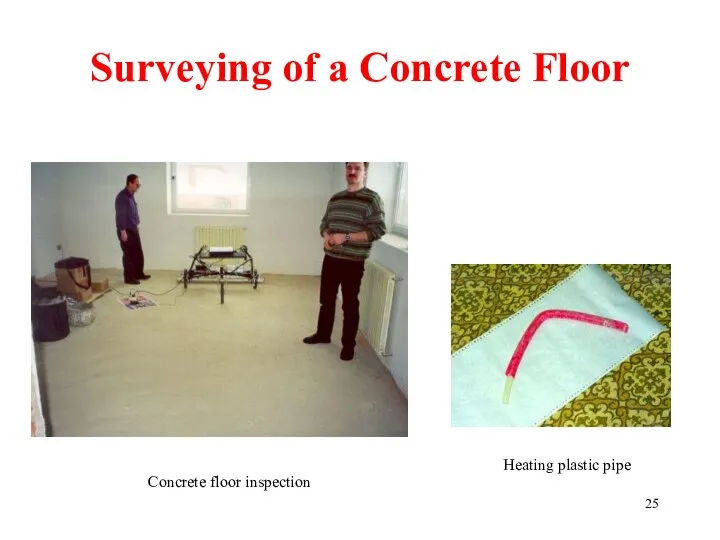
Surveying of a Concrete Floor
Heating plastic pipe
Concrete floor inspection
Surveying of a Concrete Floor
Heating plastic pipe
Concrete floor inspection
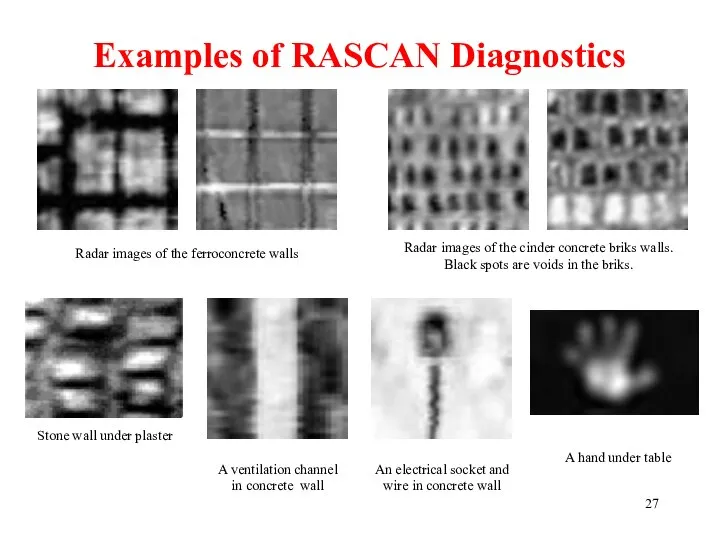
Examples of RASCAN Diagnostics
Radar images of the ferroconcrete walls
Radar images of
Examples of RASCAN Diagnostics
Radar images of the ferroconcrete walls
Radar images of
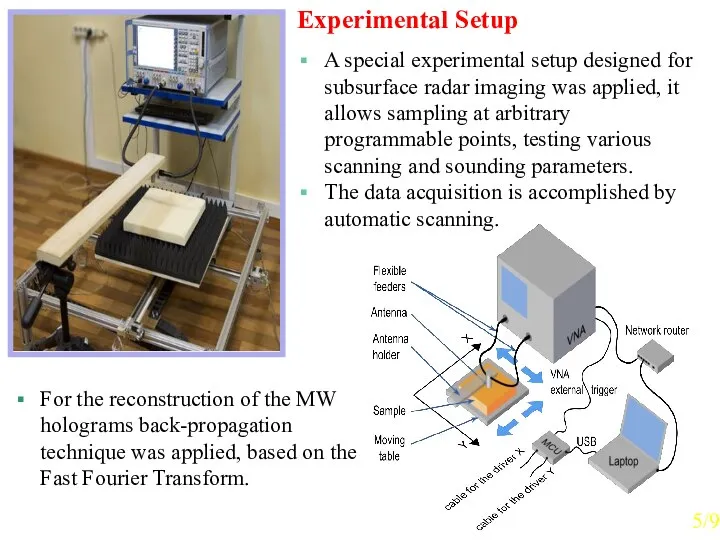
A special experimental setup designed for subsurface radar imaging was applied,
A special experimental setup designed for subsurface radar imaging was applied,
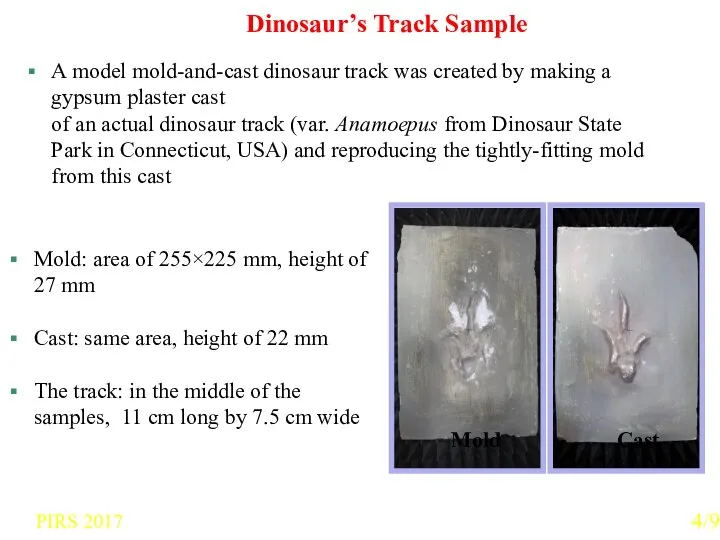
Dinosaur’s Track Sample
A model mold-and-cast dinosaur track was created by making
Dinosaur’s Track Sample
A model mold-and-cast dinosaur track was created by making
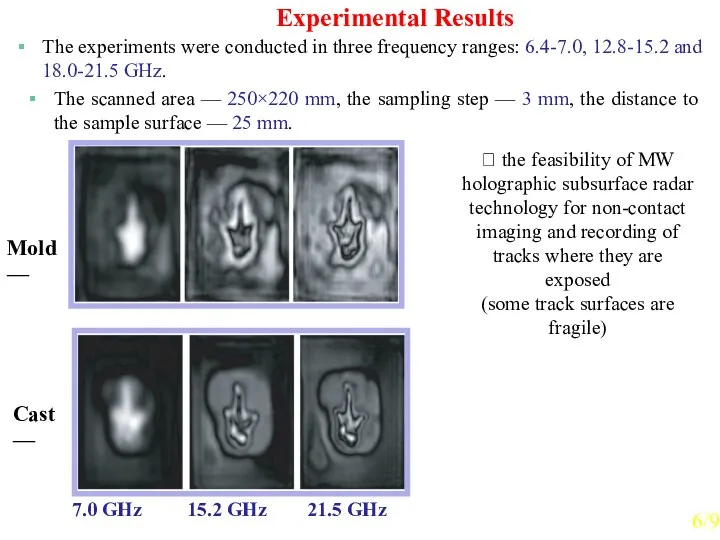
The experiments were conducted in three frequency ranges: 6.4-7.0, 12.8-15.2 and
The experiments were conducted in three frequency ranges: 6.4-7.0, 12.8-15.2 and
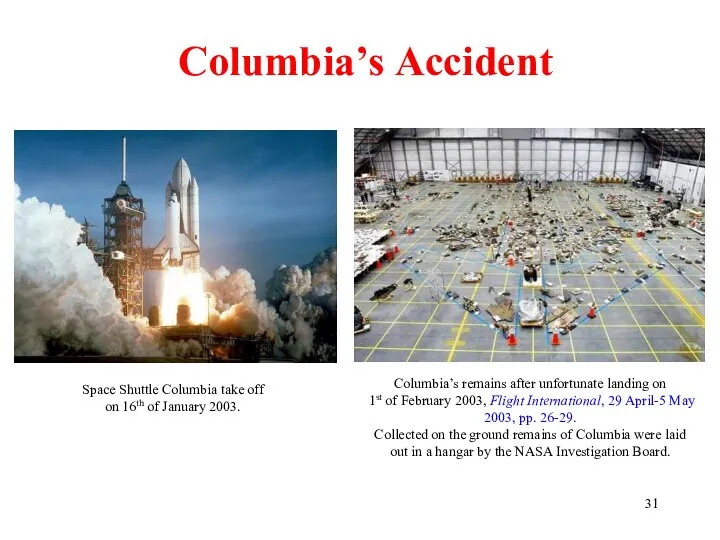
Columbia’s Accident
Space Shuttle Columbia take off
on 16th of January 2003.
Columbia’s Accident
Space Shuttle Columbia take off on 16th of January 2003.
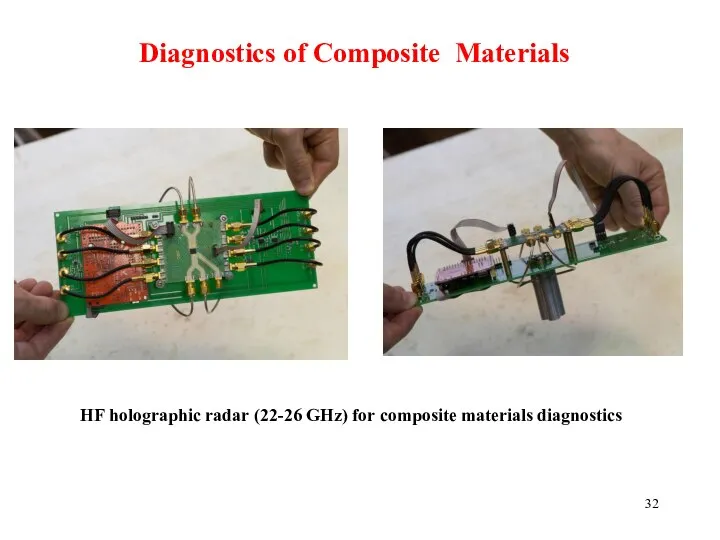
Diagnostics of Composite Materials
HF holographic radar (22-26 GHz) for composite materials
Diagnostics of Composite Materials
HF holographic radar (22-26 GHz) for composite materials
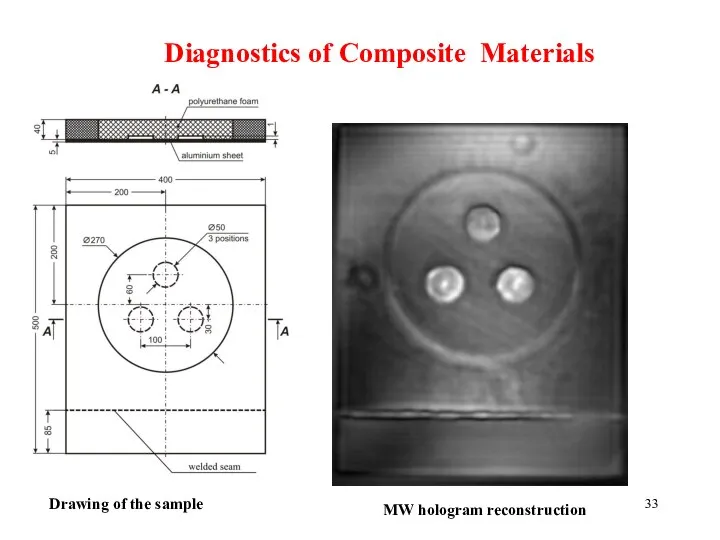
Diagnostics of Composite Materials
Drawing of the sample
MW hologram reconstruction
Diagnostics of Composite Materials
Drawing of the sample
MW hologram reconstruction
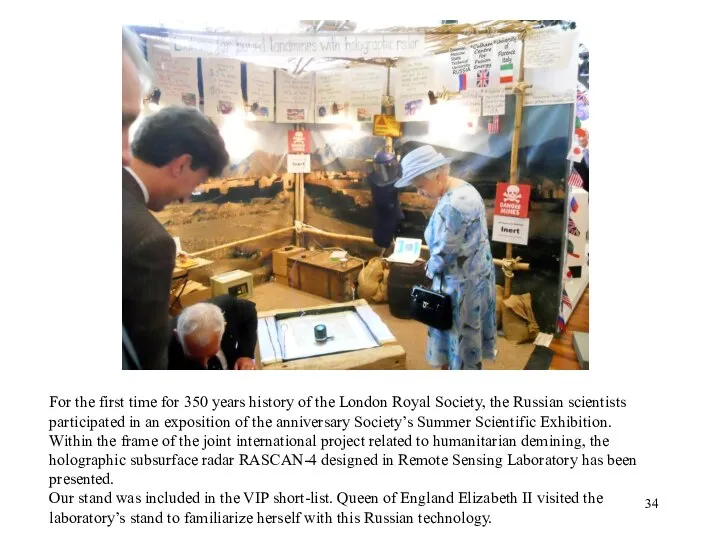
For the first time for 350 years history of the London
For the first time for 350 years history of the London
CONCLUSION
Holographic subsurface radar technology is not universal one. However in some
CONCLUSION
Holographic subsurface radar technology is not universal one. However in some
ACKNOWLEDGMENTS
Support for this work was provided
by the Russian Science Foundation
ACKNOWLEDGMENTS
Support for this work was provided by the Russian Science Foundation
 Государство и право Германии в средние века
 20150224_voyna_1941-1945_1
 Смута
Смута Газета Путь Ильича. Открытие мемориальной доски в комнате Боевой славы
 Периодизация всемирной истории. Первобытная эпоха.
 Методы угадывания при выполнении тестовых заданий по истории
 Наличие эффективных методов борьбы с коррупцией как основа для роста благосостояния граждан Республики Казахстан
 Город Мюнхен
 Дорога мужества Ижевск - Балезино
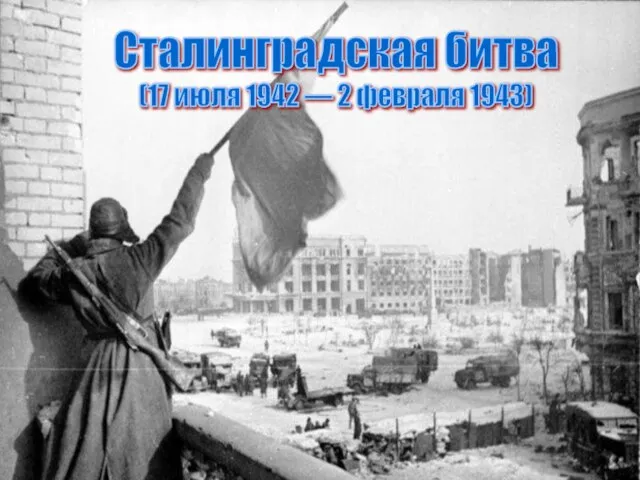 Сталинградская битва 17 июля 1942 года - 2 февраля 1943 года
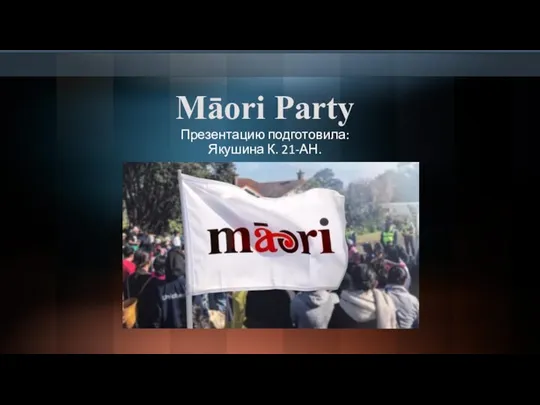 Māori Party
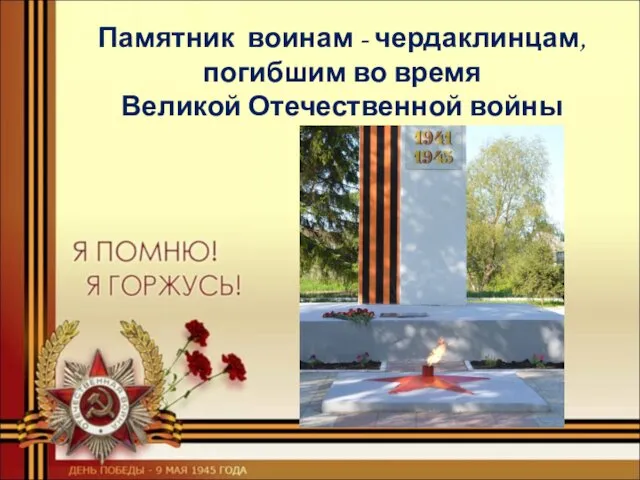 Памятник воинам - чердаклинцам, погибшим во время Великой Отечественной войны
 Древнейшие цивилизации
  Презентация на тему "Переход к новой экономической политике" - презентации по Истории скачать
  Соціально – економічне становище України на початку 20-х років. НЕП
 Идеология и культура периода гражданской войны
 Образовательный проект Весна победы. Оружие победы
 Дана билеуші. Хан Абылай
 Презентация на тему "Все для фронта, все для победы" - презентации по Истории скачать
  Презентация на тему Опричнина
  Индустриализация, коллективизация и культура в СССР
  Английская буржуазная революция и конституционно-правовое строительство Британии в XVIII-XIX веках
 Південна Україна. Ліквідація Запорозької Січі
 Третий период Второй Мировой войны (ноябрь 1942- декабрь 1943 гг.)
 Путешествие в прошлое телефона
 Жизнь первых людей на Земле
  Защитники Донбасса
 Был ли Рюрик на самом деле