Multidimensional analysis, dimension reduction, categorization with statistical approach - stability and reproducibility
- Multidimensional analysis, dimension reduction, categorization with statistical approach - stability and reproducibility

Содержание
- 2. Peculiarities : multiple parameters sparse data sets mosaic data fragmentary data misleading conventions individual cases Medical
- 3. Normal distribution sparse data sets Medical or biological parameters usualy are restricted in values as more
- 4. Schematic picture Example
- 5. Robustness and statweight We can find out that some elements of groups or their parameters could
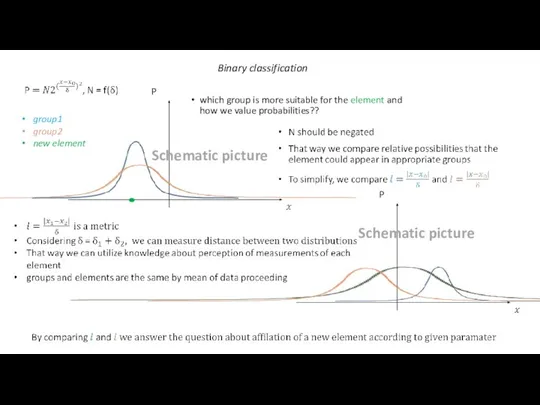
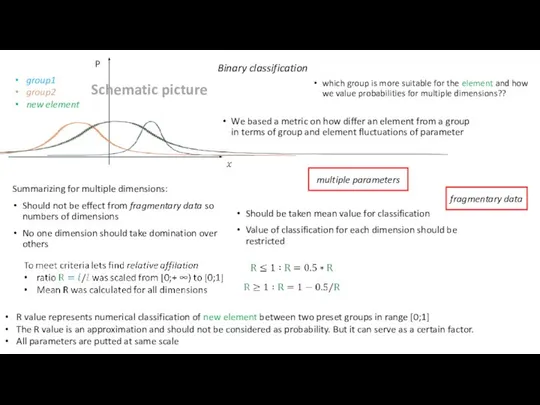
- 6. Binary classification group1 group2 new element which group is more suitable for the element and how
- 7. Binary classification group1 group2 new element which group is more suitable for the element and how
- 8. Non numerical data Discrete data for binary state parameters arbitrary pair numbers(>0) could be given For
- 9. Creating new dependable parameters Certain experimental models and conditions allow to derive definite assumptions that can
- 10. Data representation Each element of each group could be considered as a new element graph for
- 11. Scalar projection to line between centers of two groups, two pairs of groups are considered With
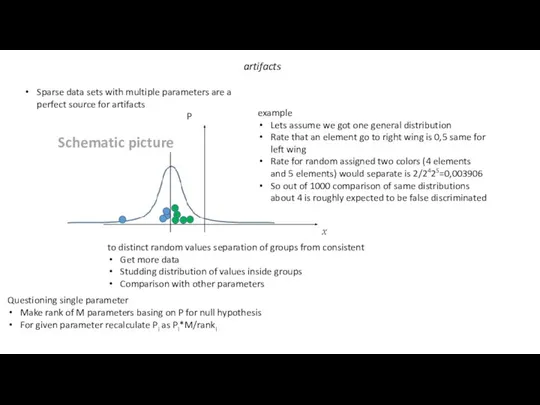
- 12. artifacts Sparse data sets with multiple parameters are a perfect source for artifacts example Lets assume
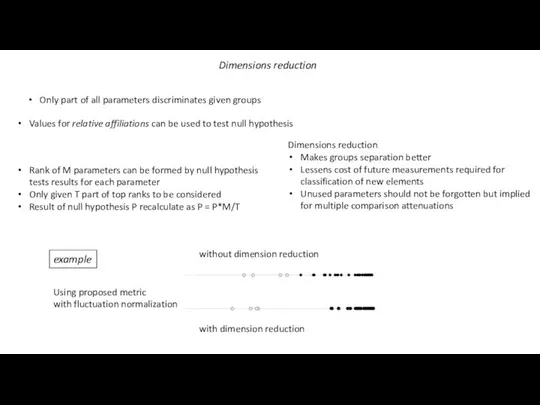
- 13. Dimensions reduction Rank of M parameters can be formed by null hypothesis tests results for each
- 14. Reproducibility Groups rearrangement Take one element out from a group Find all key values for a
- 15. Data representation rearrangements dimension reductions Evaluation of groups separation summarizing relative affiliations on rearranged data For
- 16. example Estimation for probabilities of affiliation to one of two groups for groups elements Summarized relative
- 18. Скачать презентацию
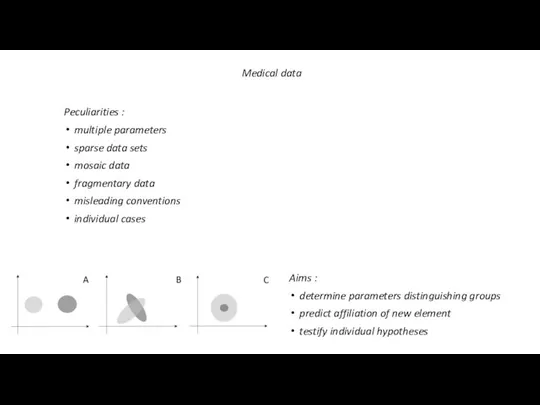
Peculiarities :
multiple parameters
sparse data sets
mosaic data
fragmentary data
misleading conventions
individual cases
Medical data
Aims :
determine
Peculiarities :
multiple parameters
sparse data sets
mosaic data
fragmentary data
misleading conventions
individual cases
Medical data
Aims :
determine
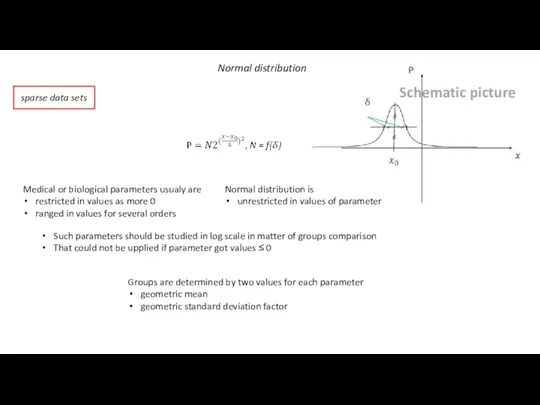
Normal distribution
sparse data sets
Medical or biological parameters usualy are
restricted in values
Normal distribution
sparse data sets
Medical or biological parameters usualy are
restricted in values
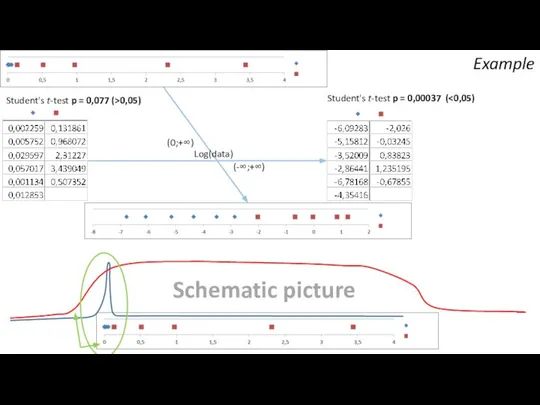
Schematic picture
Example
Schematic picture
Example
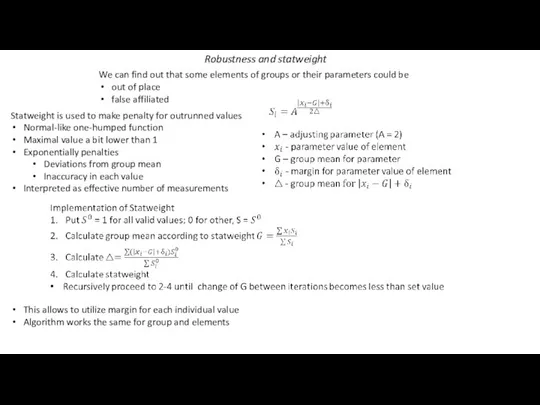
Robustness and statweight
We can find out that some elements of
Robustness and statweight
We can find out that some elements of
Binary classification
group1
group2
new element
which group is more suitable for the element and
Binary classification
group1
group2
new element
which group is more suitable for the element and
Binary classification
group1
group2
new element
which group is more suitable for the element and
Binary classification
group1
group2
new element
which group is more suitable for the element and
Non numerical data
Discrete data
for binary state parameters arbitrary pair numbers(>0) could
Non numerical data
Discrete data
for binary state parameters arbitrary pair numbers(>0) could
Creating new dependable parameters
Certain experimental models and conditions allow to derive
Creating new dependable parameters
Certain experimental models and conditions allow to derive
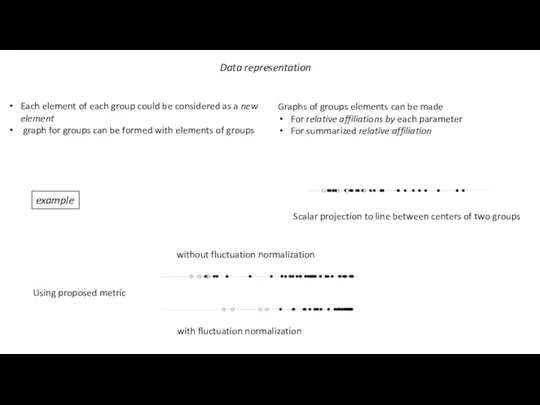
Data representation
Each element of each group could be considered as
Data representation
Each element of each group could be considered as
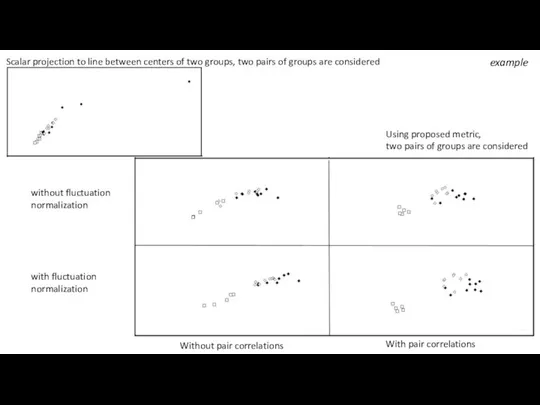
Scalar projection to line between centers of two groups, two pairs
Scalar projection to line between centers of two groups, two pairs
artifacts
Sparse data sets with multiple parameters are a perfect source for
artifacts
Sparse data sets with multiple parameters are a perfect source for
Dimensions reduction
Rank of M parameters can be formed by null hypothesis
Dimensions reduction
Rank of M parameters can be formed by null hypothesis
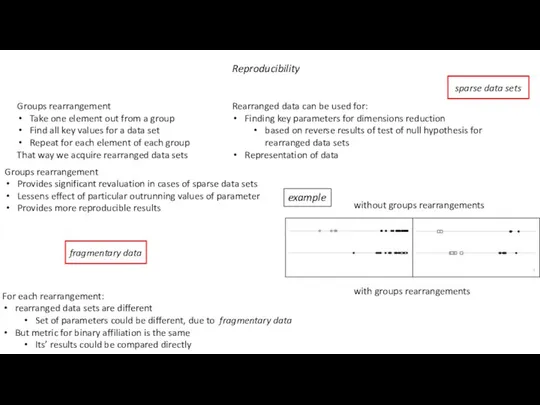
Reproducibility
Groups rearrangement
Take one element out from a group
Find all key
Reproducibility
Groups rearrangement
Take one element out from a group
Find all key
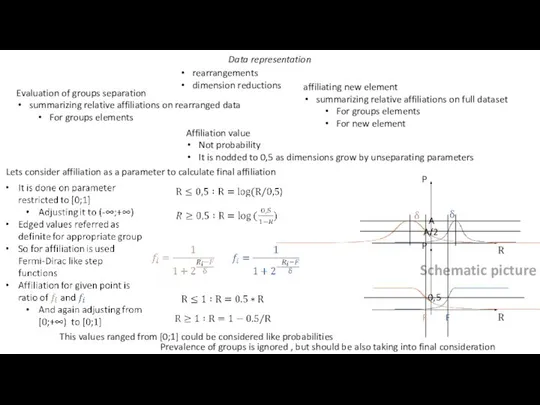
Data representation
rearrangements
dimension reductions
Evaluation of groups separation
summarizing relative affiliations on
Data representation
rearrangements
dimension reductions
Evaluation of groups separation
summarizing relative affiliations on
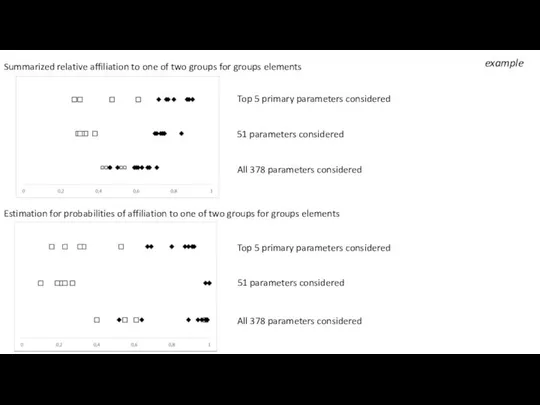
example
Estimation for probabilities of affiliation to one of two groups for
example
Estimation for probabilities of affiliation to one of two groups for
 Система стабилизации и ориентации спутников не требующая разгрузки
 Естественные и искусственные основания
 20110728_4._Les_Chudes._Volshebnyy_Sunduchok
 f_556630f379411b19
 Национальные особенности делового и речевого этикета
 Основы медицинской информатики
 Религия и мораль. Нравственные заповеди в религиях ислама и буддизма. Урок 26
 Способы изготовления фотошаблонов
 Новогодний конкурс: Угадай что?
 ПГ 2014
 20170131_obrazovanie_i_samoobrazovanie
 20140830_paragraf_no22
 Правители России
 Как нарисовать танк поэтапно
 USB
USB 应聘面试 第二周. Китайский язык
 Техническое обслуживание средств вычислительной техники
 лишний
 20180118_18_urok_literatura
 Модель, описывающая зависимости между величинами
 Великая Пасха
 What should be a professional?
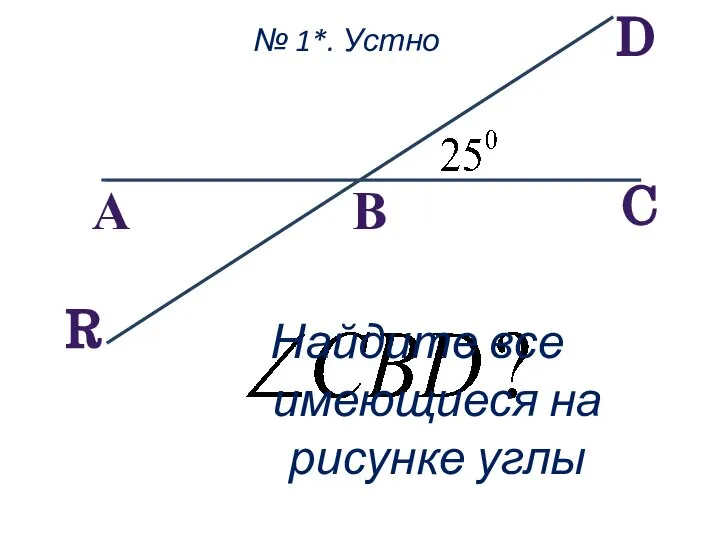 Перпендикулярные прямые
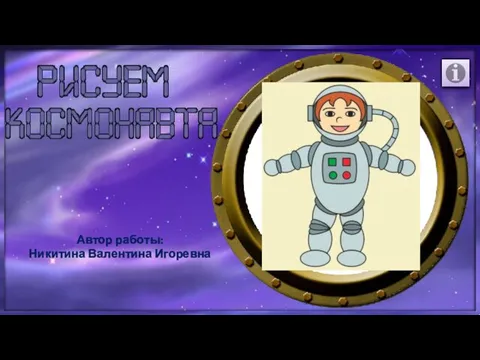 Рисуем космонавта
 20150307_3_na_zashchitu_mezhdunarodnyy_terrorizm_-_kopiya5
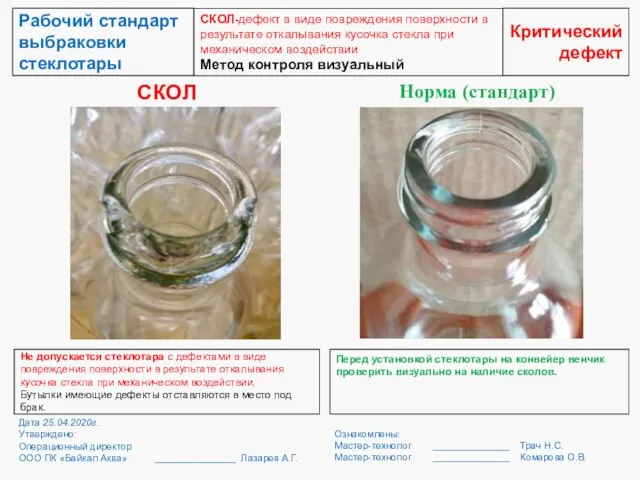 Рабочий стандарт выбраковки стеклотары
 Celebrity presentation
 Маленькие лучики А. Чугайкиной исп. М. Мельник