- Обзор докладов геофизической сессии на 11й конференции по мерзлотоведению Потсдам, июнь 2016

Содержание
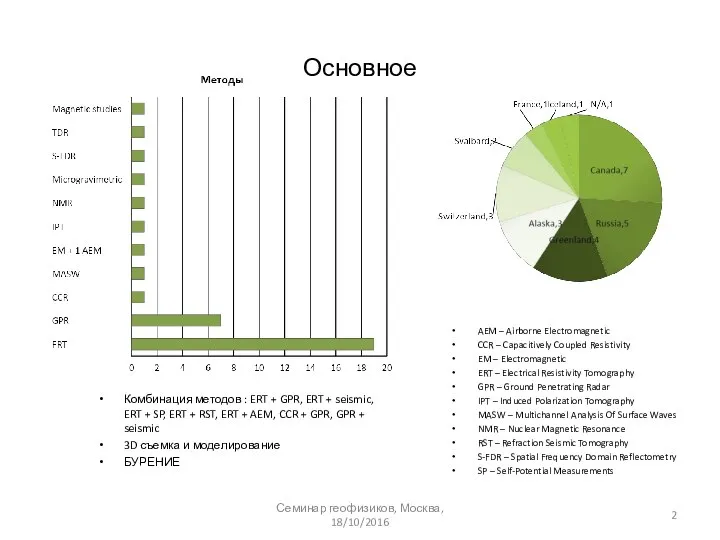
- 2. Основное Комбинация методов : ERT + GPR, ERT + seismic, ERT + SP, ERT + RST,
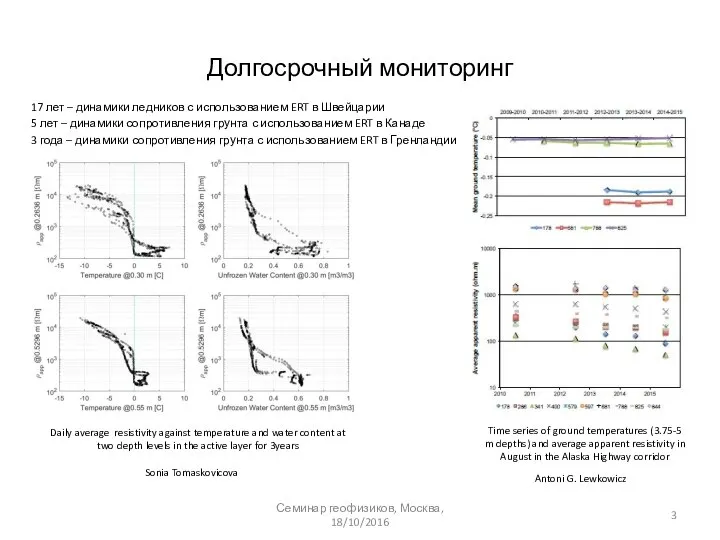
- 3. Долгосрочный мониторинг 17 лет – динамики ледников с использованием ERT в Швейцарии 5 лет – динамики
- 4. Example of CCR and GPR on the Dempster HIghway over possible ice-wedge polygons Jane Dawson Семинар
- 5. A Google Earth image (top) and airborne LiDAR and an electrical resistivity tomography cross section (bottom)
- 6. A) Tasiapik valley near Umiujaq B) 3D сryohydrogeological model of the studied watershed C) Resistivity and
- 7. Burn severity, frost table measurements (gaps in data indicates measurements greater than 120cm probe), and resistivity
- 8. Electrical resistivity survey area and results. A) Delineation of surveys and boreholes (WPD15-1, 2, 3, 4)
- 9. 1D surface nuclear magnetic resonance soundings of talik thaw Andrew Parsekian Семинар геофизиков, Москва, 18/10/2016
- 10. GPR cross section Marat Sadurtdinov Семинар геофизиков, Москва, 18/10/2016
- 11. Ice wedge in Chara outcrop and GPR profile over it. The average velocity of the electromagnetic
- 13. Скачать презентацию
Основное
Комбинация методов : ERT + GPR, ERT + seismic, ERT +
Основное
Комбинация методов : ERT + GPR, ERT + seismic, ERT +
Долгосрочный мониторинг
17 лет – динамики ледников с использованием ERT в Швейцарии
5
Долгосрочный мониторинг
17 лет – динамики ледников с использованием ERT в Швейцарии
5
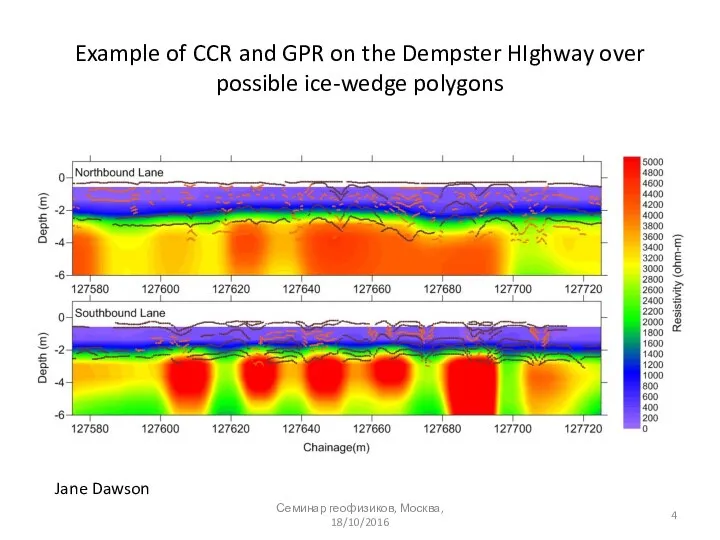
Example of CCR and GPR on the Dempster HIghway over possible
Example of CCR and GPR on the Dempster HIghway over possible
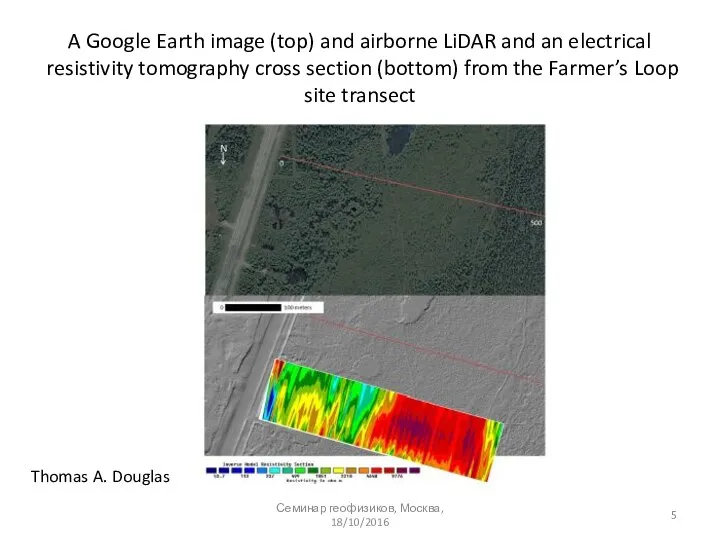
A Google Earth image (top) and airborne LiDAR and an electrical
A Google Earth image (top) and airborne LiDAR and an electrical
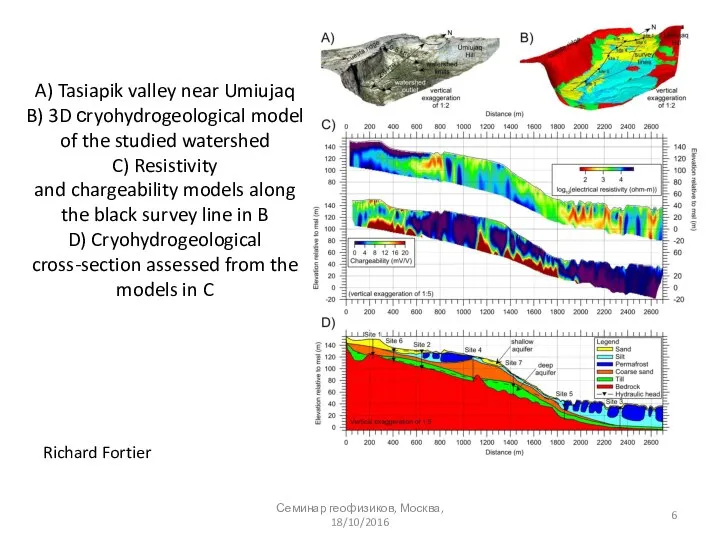
A) Tasiapik valley near Umiujaq
B) 3D сryohydrogeological model of the studied
A) Tasiapik valley near Umiujaq B) 3D сryohydrogeological model of the studied
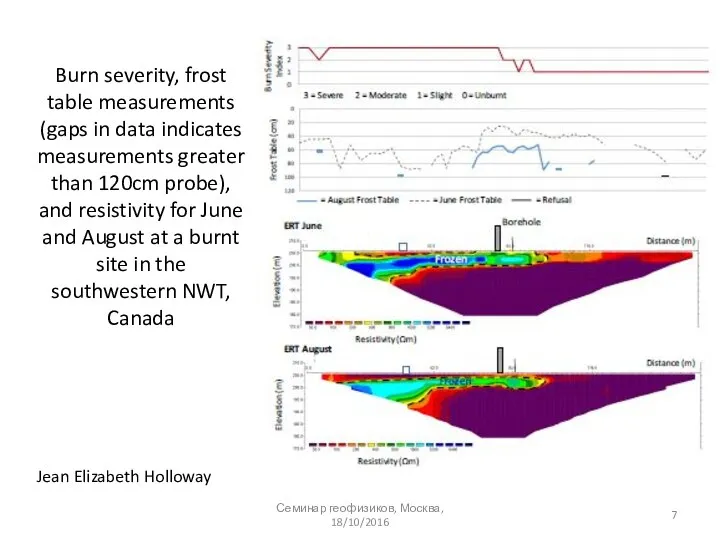
Burn severity, frost table measurements (gaps in data indicates measurements greater
Burn severity, frost table measurements (gaps in data indicates measurements greater
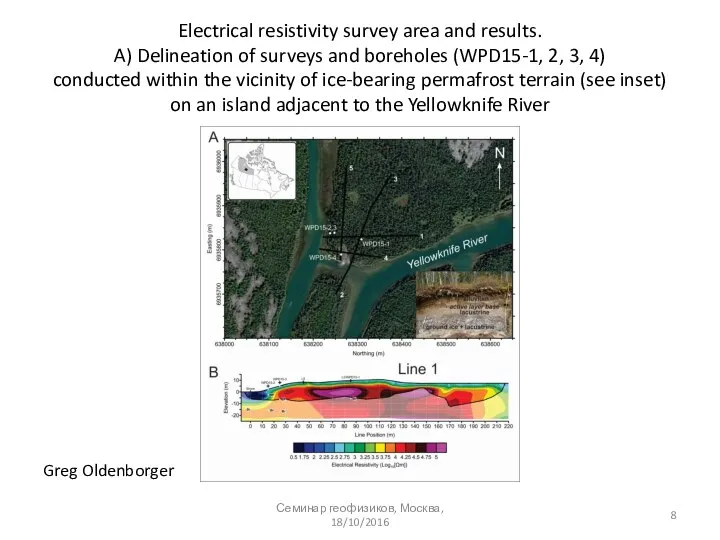
Electrical resistivity survey area and results.
A) Delineation of surveys and
Electrical resistivity survey area and results. A) Delineation of surveys and
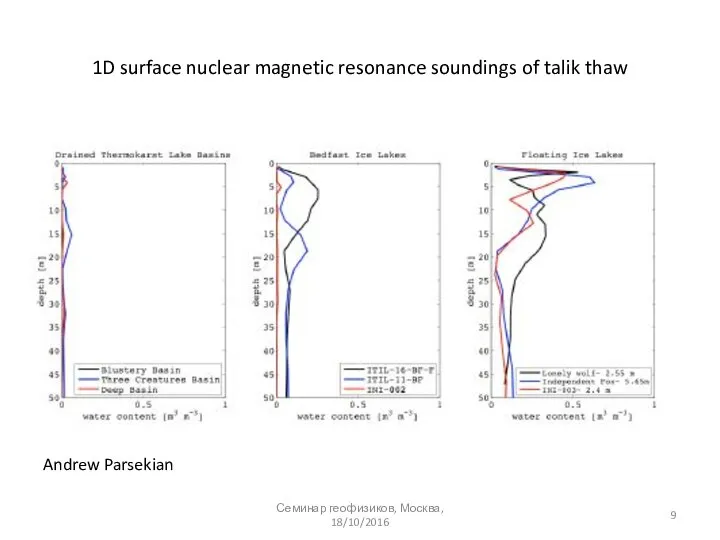
1D surface nuclear magnetic resonance soundings of talik thaw
Andrew Parsekian
Семинар геофизиков,
1D surface nuclear magnetic resonance soundings of talik thaw
Andrew Parsekian
Семинар геофизиков,
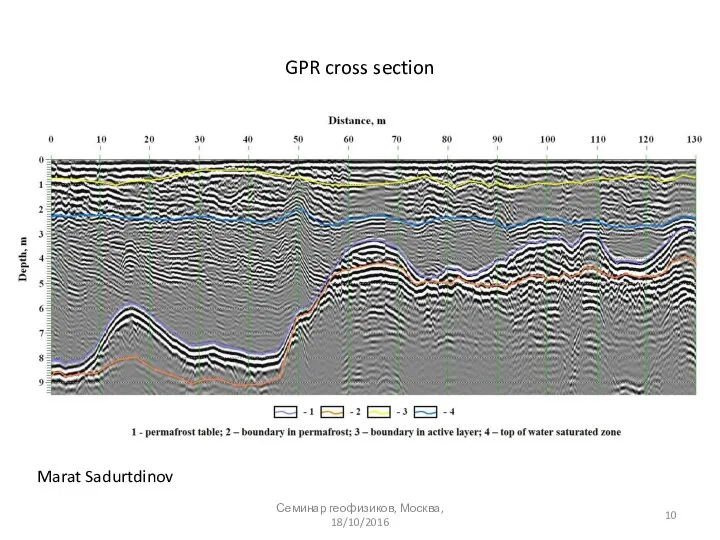
GPR cross section
Marat Sadurtdinov
Семинар геофизиков, Москва, 18/10/2016
GPR cross section
Marat Sadurtdinov
Семинар геофизиков, Москва, 18/10/2016
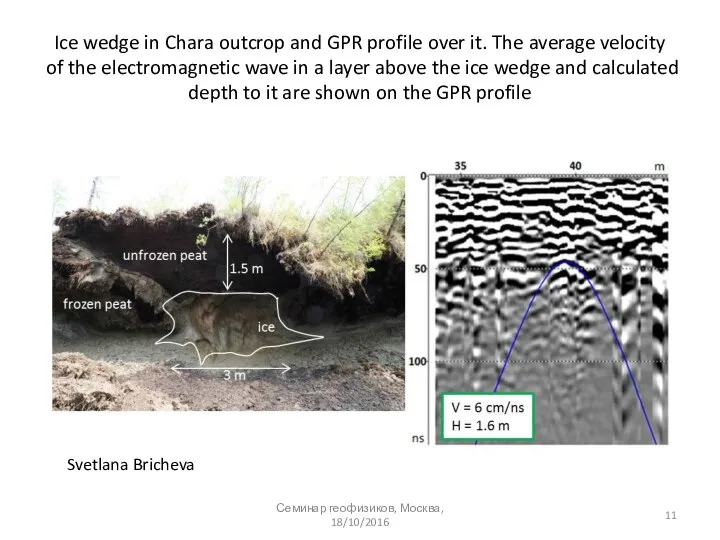
Ice wedge in Chara outcrop and GPR profile over it. The
Ice wedge in Chara outcrop and GPR profile over it. The
 Путешествие в страну синтаксиса и пунктуации (2 класс)
 Лекция 2 Учебник и среда
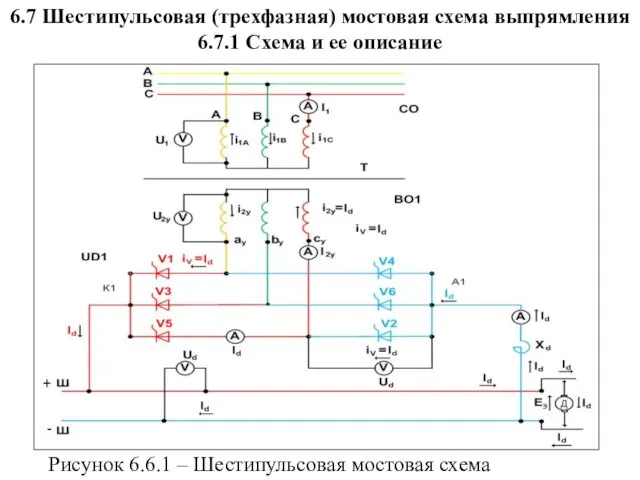 Шестипульсовая (трехфазная) мостовая схема управляемого выпрямителя
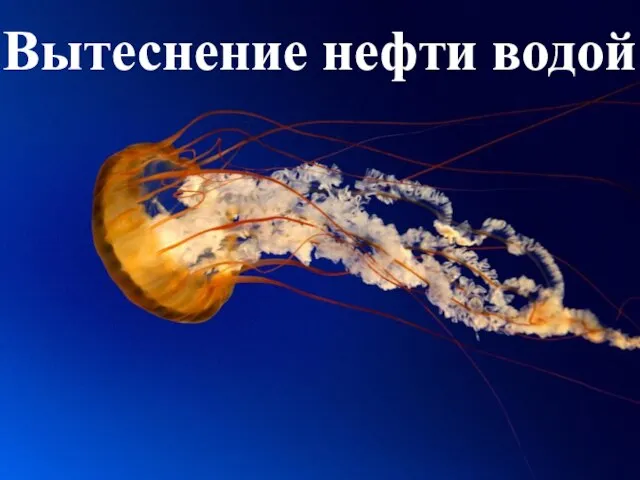 Вытеснение нефти водой. Виды и модели заводнения нефтяных залежей
 Жизненный цикл месторождения. Лекция 2
 Презентація_Обстеження_обєктів_Михайло_Жужа_Віктор_Носенко_09_06
 Будова слова. Словотвір. Орфографія. Елементи стилістики
 Планы миссионерского служения в 2016 году
 Интерфейсы семейства “Стык С2”
 Плюсы и минусы системы Умный дом
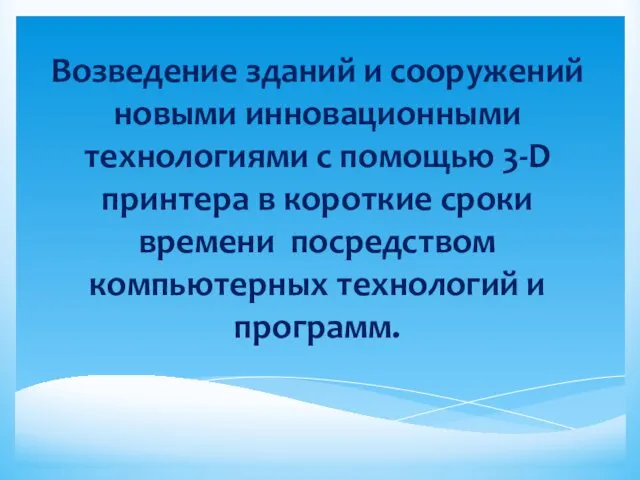 Возведение зданий и сооружений новыми инновационными технологиями
 Крещение Господне
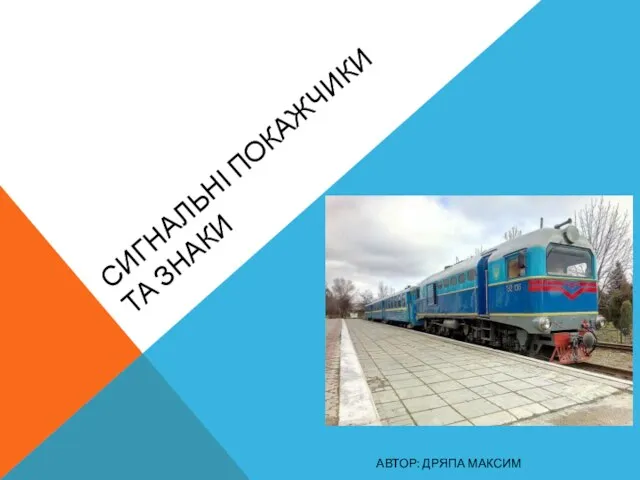 Сигнальні покажчики та знаки
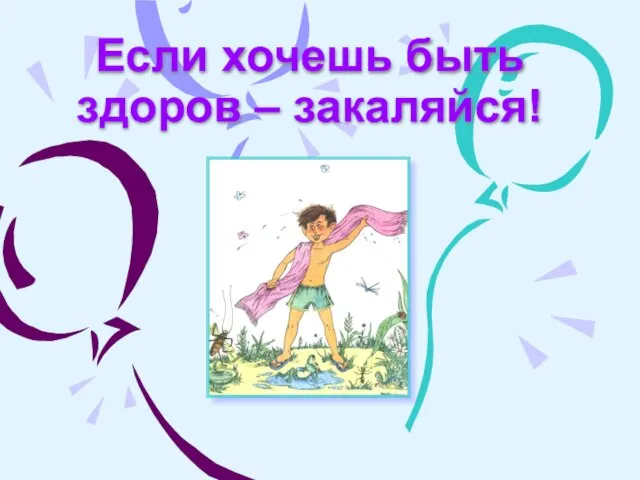 Если хочешь быть здоров – закаляйся!
 Зона арктических пустынь
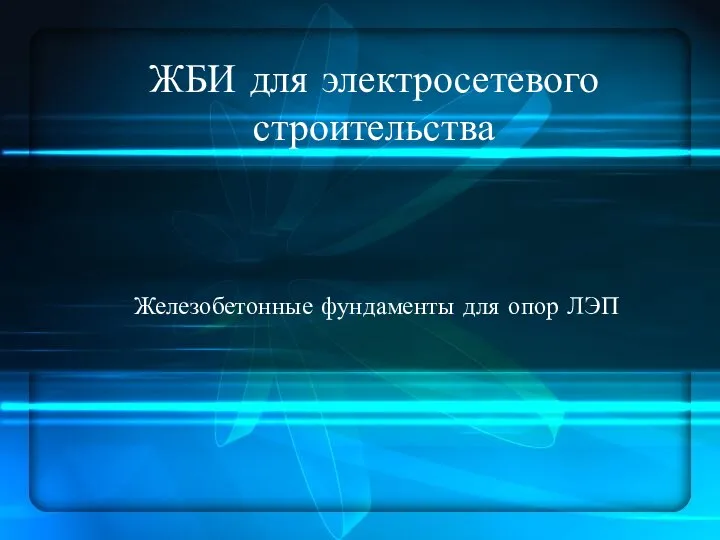 Железобетонные фундаменты для опор ЛЭП
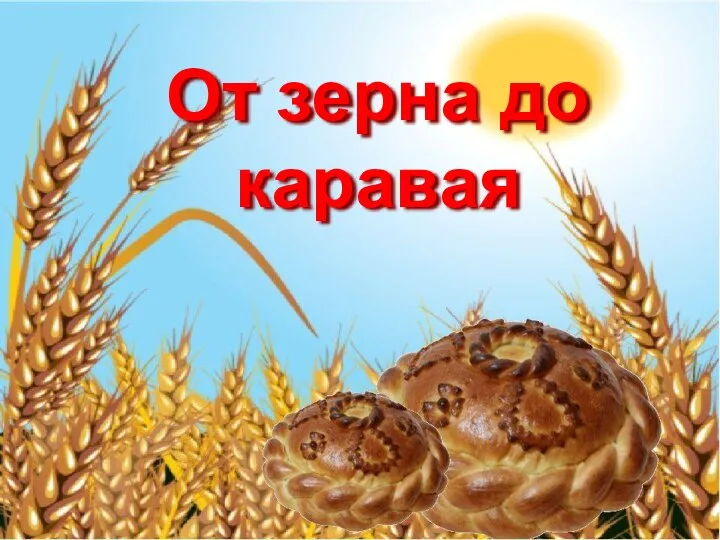 От зерна до каравая
 Технические средства контроля
 Плавкие предохранители
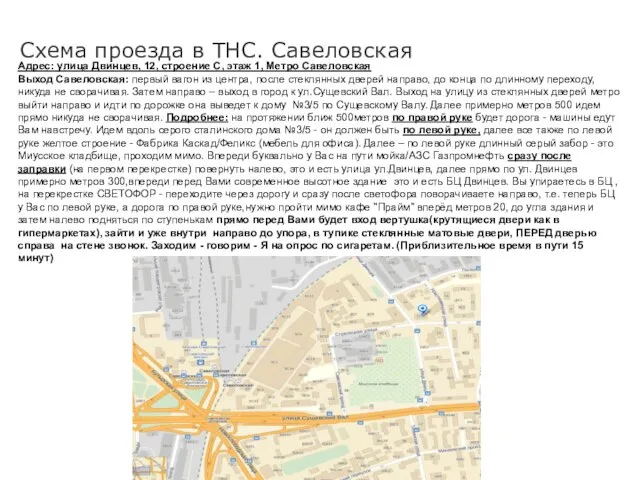 Схема проезда в ТНС. Савеловская
 Pravidla silničního provozu
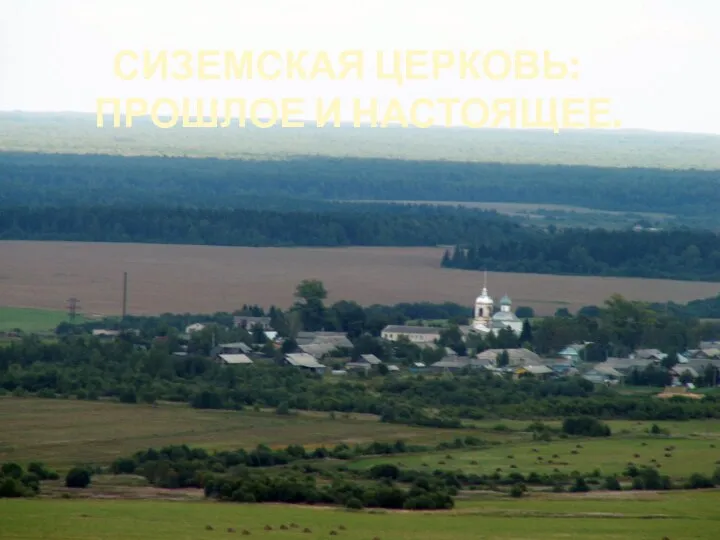 Сиземская церковь: прошлое и настоящее
 Типовые меры по инженерно-технической защите информации. (Лекция 38)
 Магнитный метод обогащения
 Вера, Надежда, Любовь и София
 Выпускная квалификационная работа. Проектирование локальной вычислительной сети для швейной фабрики
 Задачи приводящие к понятию производной
 Эмоции и психические состояния личности