- LNG Market

Содержание
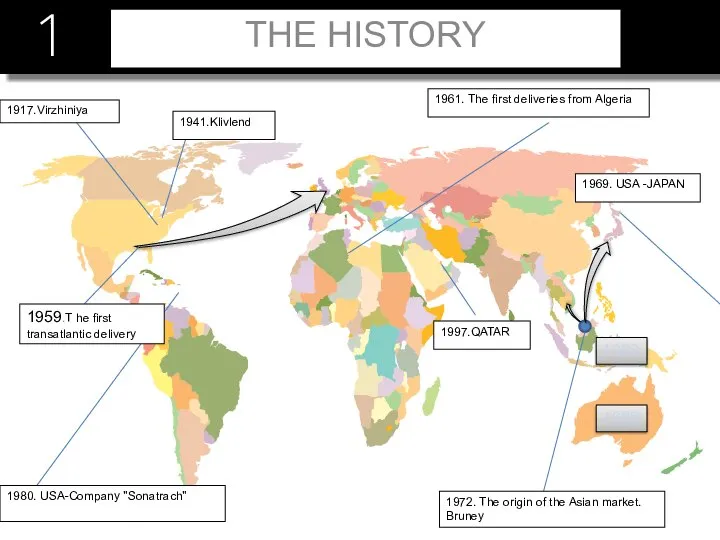
- 2. 1 1989 1983 1941.Klivlend 1997.QATAR 1961. The first deliveries from Algeria 1917.Virzhiniya 1959.T he first transatlantic
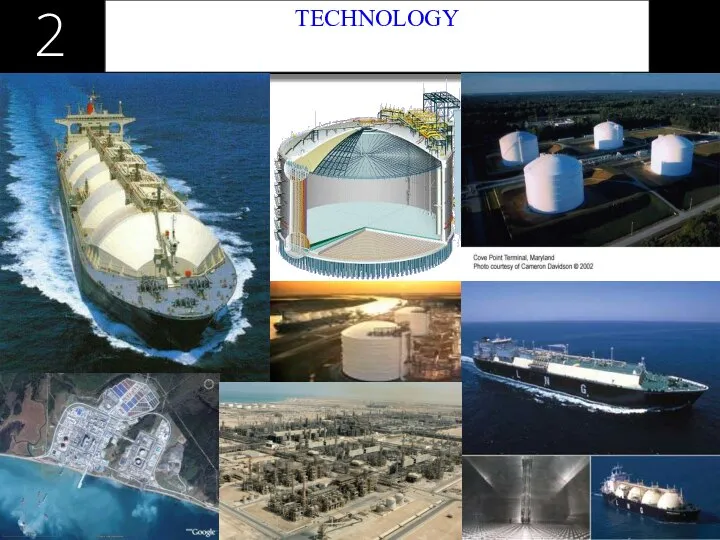
- 3. 2 TECHNOLOGY
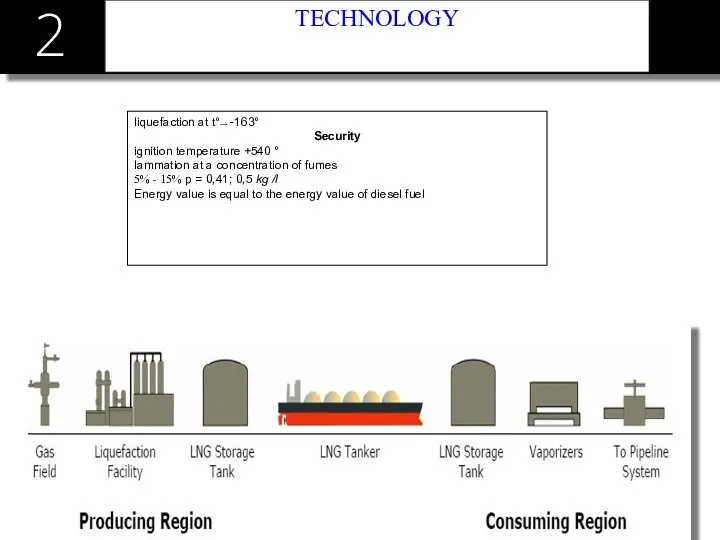
- 4. 2 TECHNOLOGY liquefaction at t°→ -163° Security ignition temperature +540 ° lammation at a concentration of
- 5. Сжижение 2 liquefaction
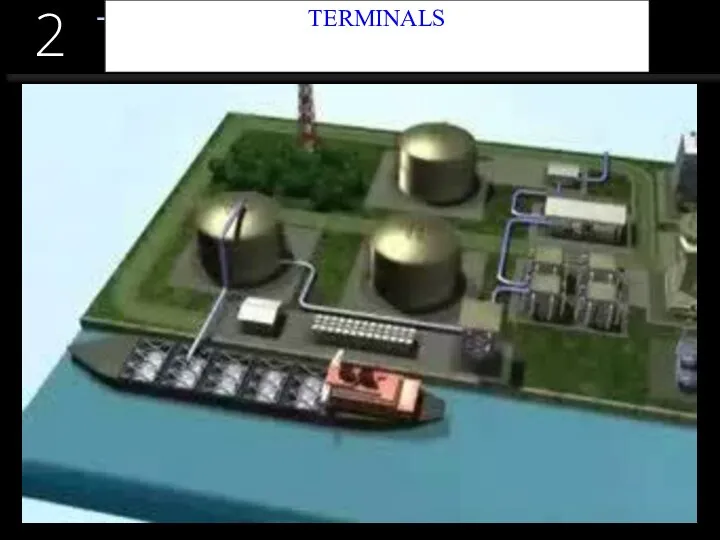
- 6. Терминалы 2 TERMINALS
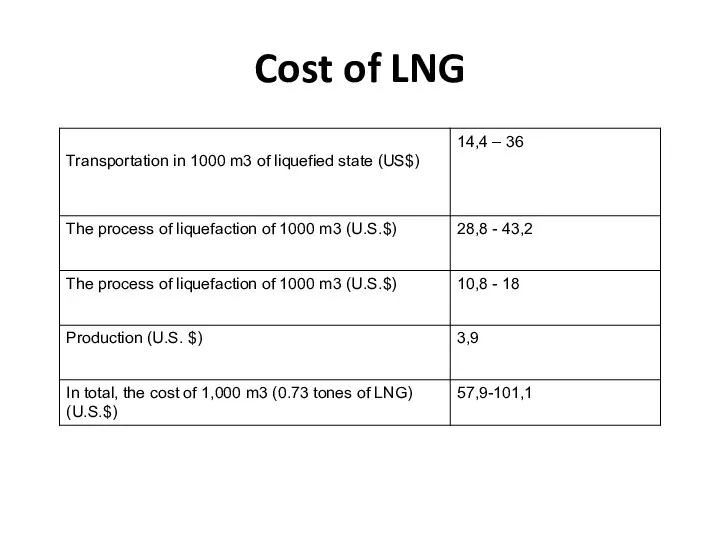
- 7. Cost of LNG
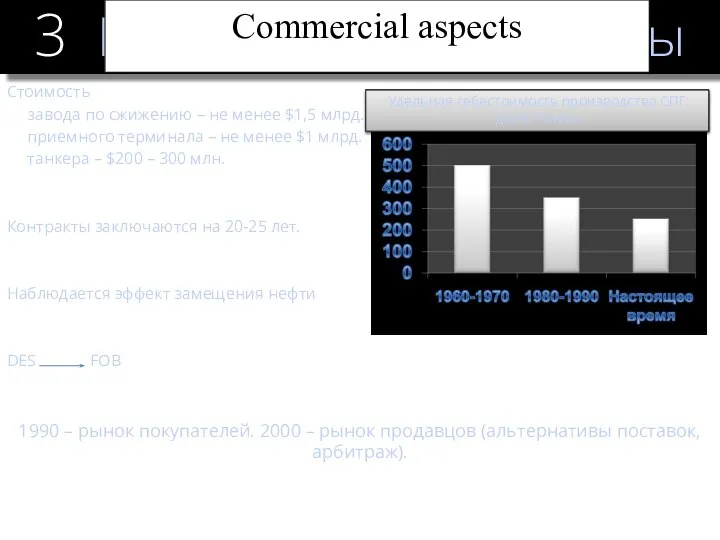
- 8. Стоимость завода по сжижению – не менее $1,5 млрд. приемного терминала – не менее $1 млрд.
- 9. Basic characteristics of markets major markets volumes exports imports trade flows Price
- 10. Основные рынки СПГ 2 4 THE MAJOR MARKETS OF LNG The North American market The European
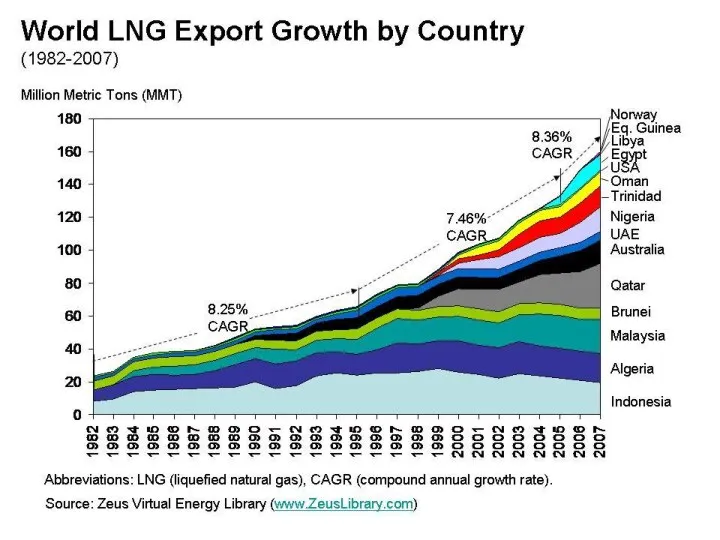
- 11. 5 Volumes of supplies, and participants 2005-2012
- 14. 5 Short-term trading 1992-2007
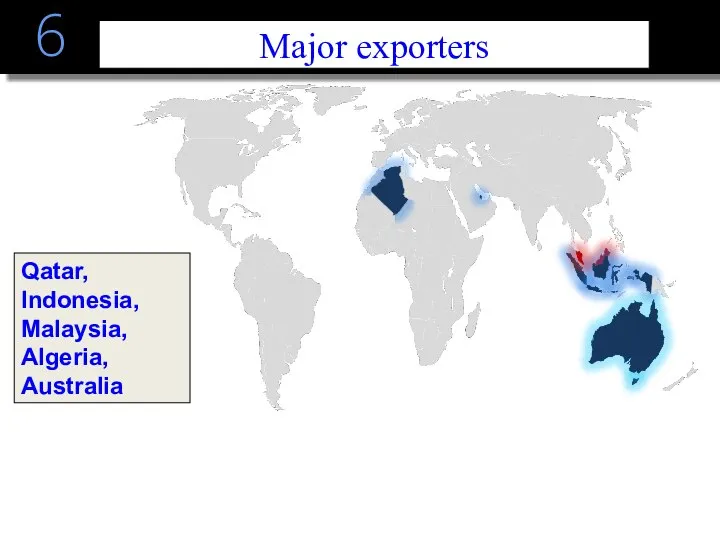
- 15. 6 MAJOR EXPORTERS
- 16. 6 Major exporters Qatar, Indonesia, Malaysia, Algeria, Australia
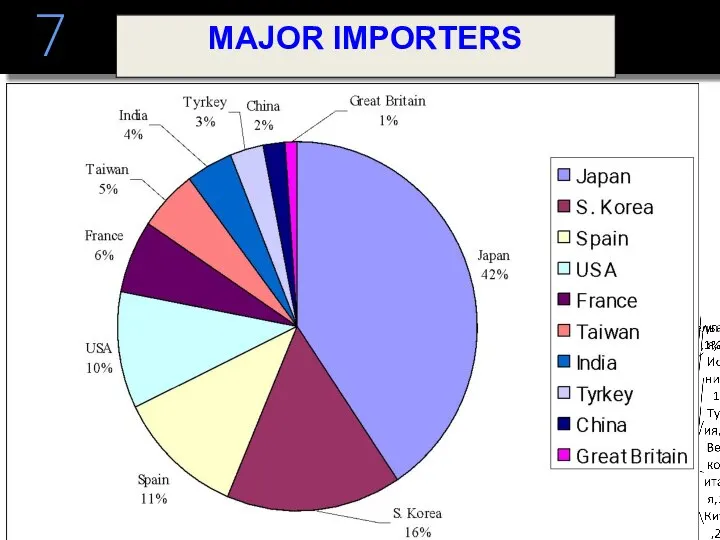
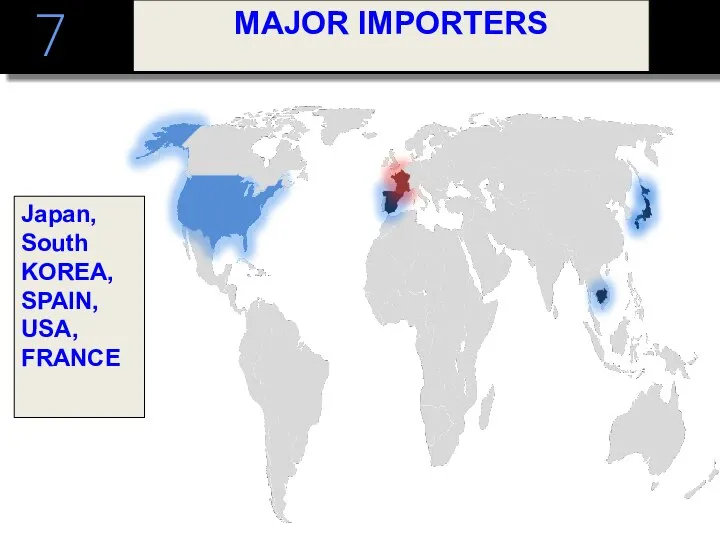
- 17. 7 MAJOR IMPORTERS
- 18. 7 MAJOR IMPORTERS Japan, South KOREA, SPAIN, USA, FRANCE
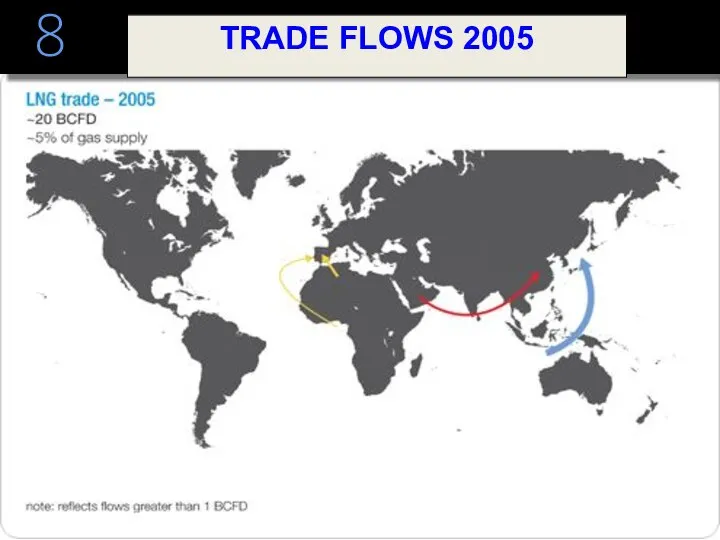
- 20. 8 TRADE FLOWS 2005
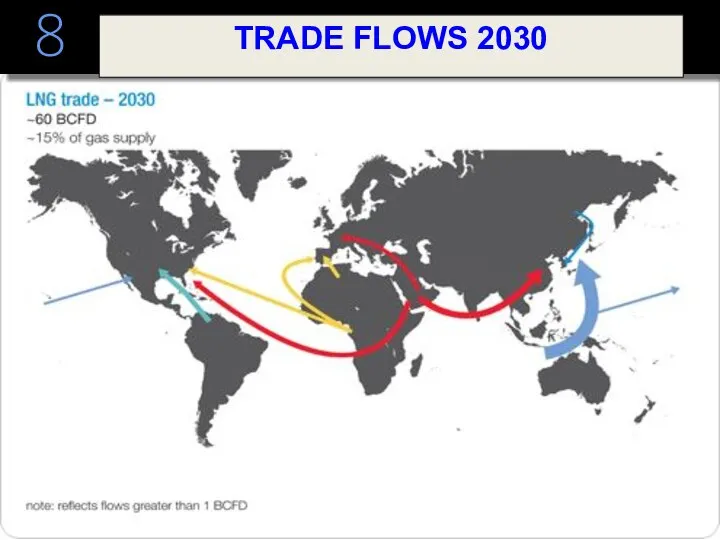
- 21. 8 TRADE FLOWS 2030
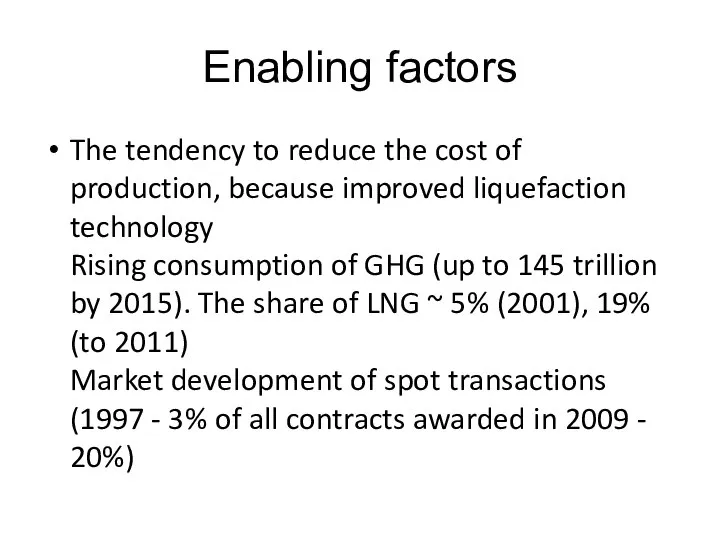
- 22. Enabling factors The tendency to reduce the cost of production, because improved liquefaction technology Rising consumption
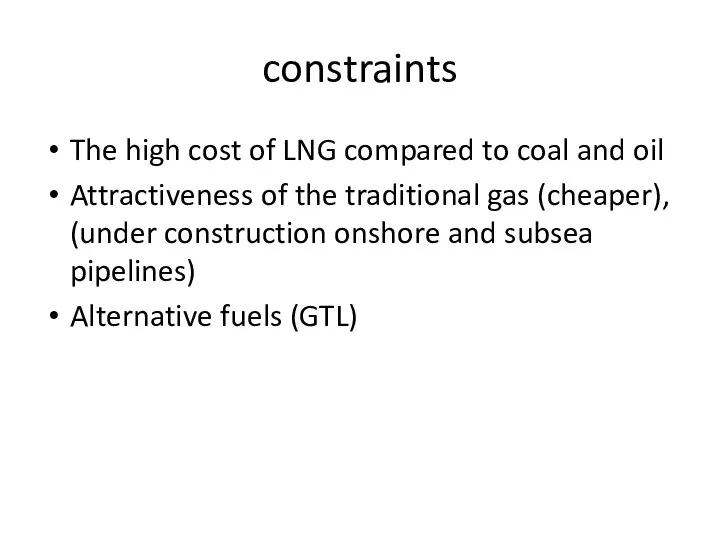
- 23. constraints The high cost of LNG compared to coal and oil Attractiveness of the traditional gas
- 24. The share of LNG - 97% The main supplier - Indonesia, as well: Australia, Brunei, Malaysia,
- 25. Dynamic of LNG COST of PRODUCTION
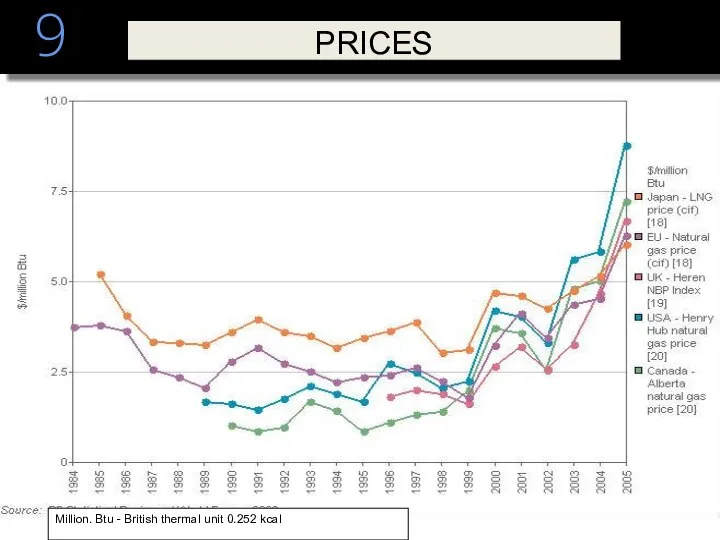
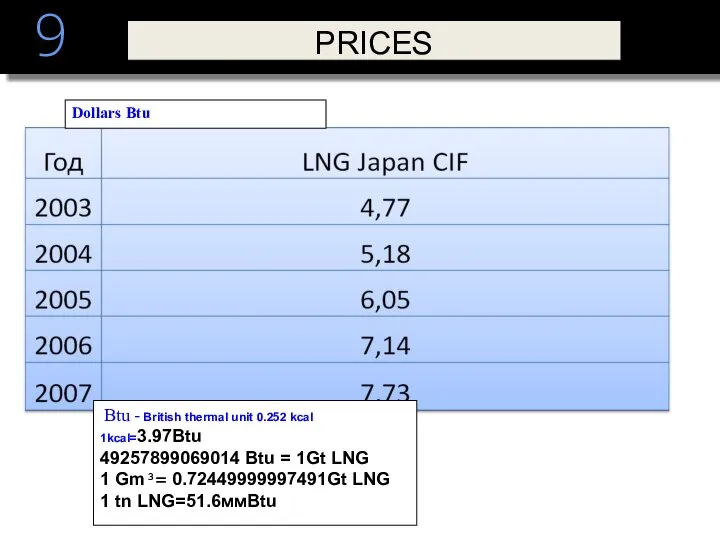
- 26. 9 PRICES Million. Btu - British thermal unit 0.252 kcal
- 27. 9 Btu - British thermal unit 0.252 kcal 1kcal=3.97Btu 49257899069014 Btu = 1Gt LNG 1 Gm³=
- 29. Скачать презентацию
1
1989
1983
1941.Klivlend
1997.QATAR
1961. The first deliveries from Algeria
1917.Virzhiniya
1959.T he first transatlantic delivery
1969.
1
1989
1983
1941.Klivlend
1997.QATAR
1961. The first deliveries from Algeria
1917.Virzhiniya
1959.T he first transatlantic delivery
1969.
2
TECHNOLOGY
2
TECHNOLOGY
2
TECHNOLOGY
liquefaction at t°→ -163°
Security
ignition temperature +540 °
lammation at a concentration of
2
TECHNOLOGY
liquefaction at t°→ -163°
Security
ignition temperature +540 °
lammation at a concentration of
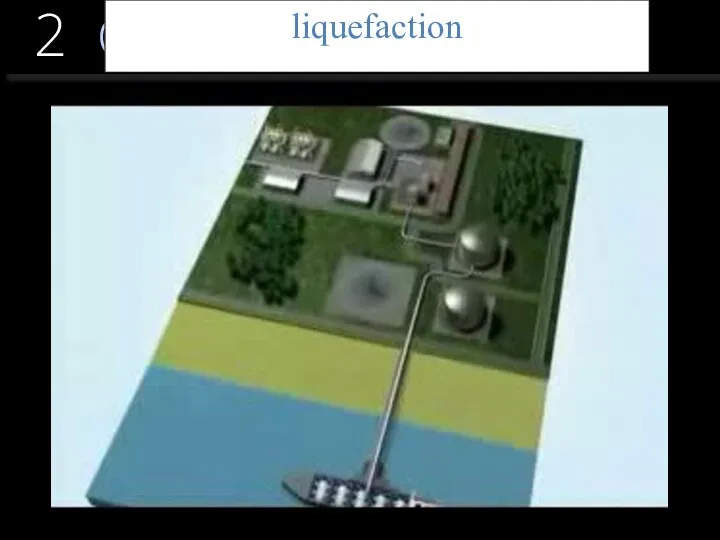
Сжижение
2
liquefaction
Сжижение
2
liquefaction
Терминалы
2
TERMINALS
Терминалы
2
TERMINALS
Cost of LNG
Cost of LNG
Стоимость
завода по сжижению – не менее $1,5 млрд.
приемного
Стоимость
завода по сжижению – не менее $1,5 млрд.
приемного
Basic characteristics of markets
major markets
volumes
exports
imports
trade flows
Price
Basic characteristics of markets
major markets
volumes
exports
imports
trade flows
Price
Основные рынки СПГ
2
4
THE MAJOR MARKETS OF LNG
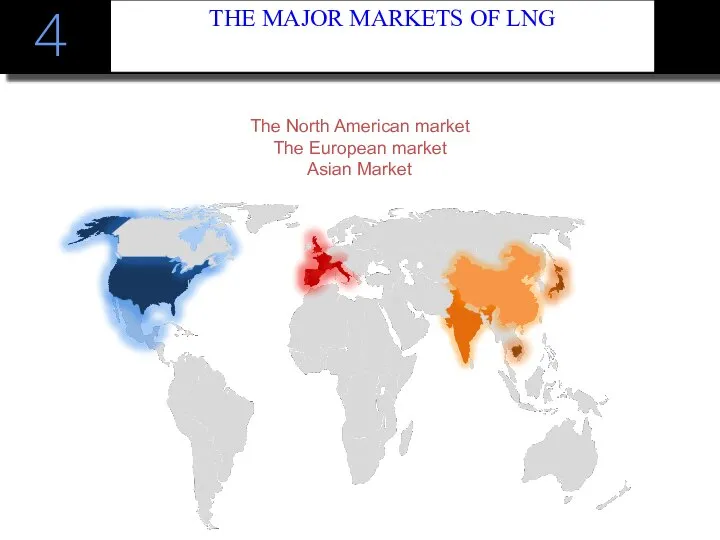
The North American market
The European
Основные рынки СПГ
2
4
THE MAJOR MARKETS OF LNG
The North American market The European

5
Volumes of supplies, and participants 2005-2012
5
Volumes of supplies, and participants 2005-2012

5
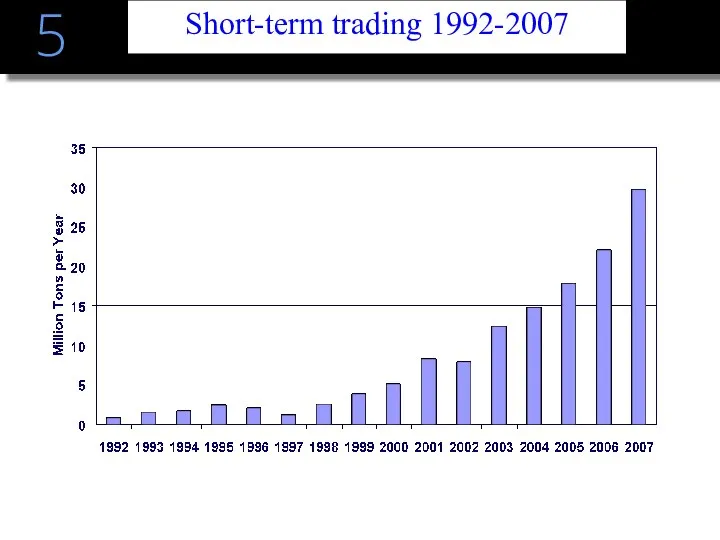
Short-term trading 1992-2007
5
Short-term trading 1992-2007
6
MAJOR EXPORTERS
6
MAJOR EXPORTERS
6
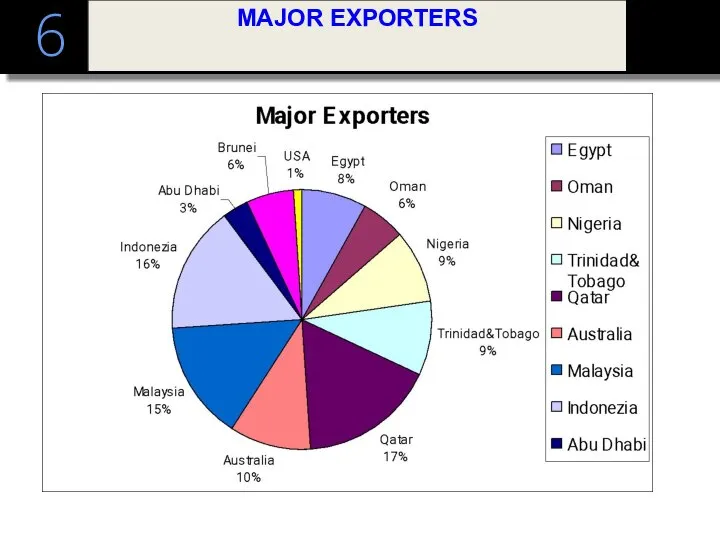
Major exporters
Qatar, Indonesia, Malaysia, Algeria, Australia
6
Major exporters
Qatar, Indonesia, Malaysia, Algeria, Australia
7
MAJOR IMPORTERS
7
MAJOR IMPORTERS
7
MAJOR IMPORTERS
Japan, South KOREA, SPAIN, USA, FRANCE
7
MAJOR IMPORTERS
Japan, South KOREA, SPAIN, USA, FRANCE
8
TRADE FLOWS 2005
8
TRADE FLOWS 2005
8
TRADE FLOWS 2030
8
TRADE FLOWS 2030
Enabling factors
The tendency to reduce the cost of production, because
Enabling factors
The tendency to reduce the cost of production, because
constraints
The high cost of LNG compared to coal and oil
Attractiveness of
constraints
The high cost of LNG compared to coal and oil
Attractiveness of
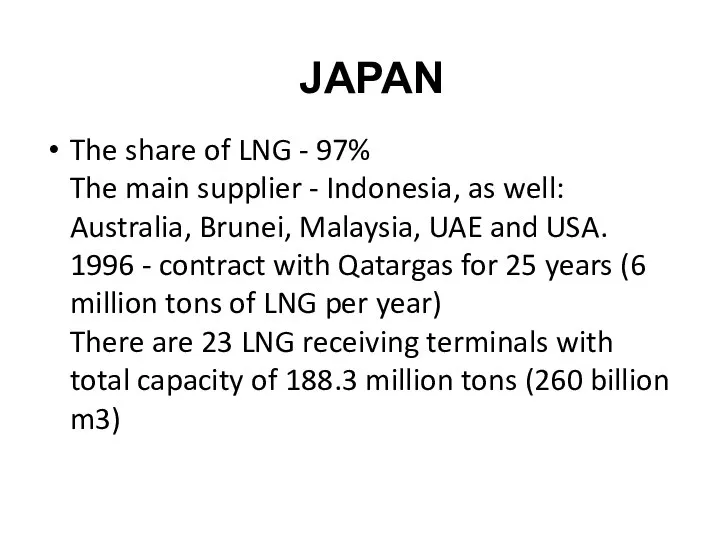
The share of LNG - 97%
The main supplier - Indonesia, as
The share of LNG - 97% The main supplier - Indonesia, as
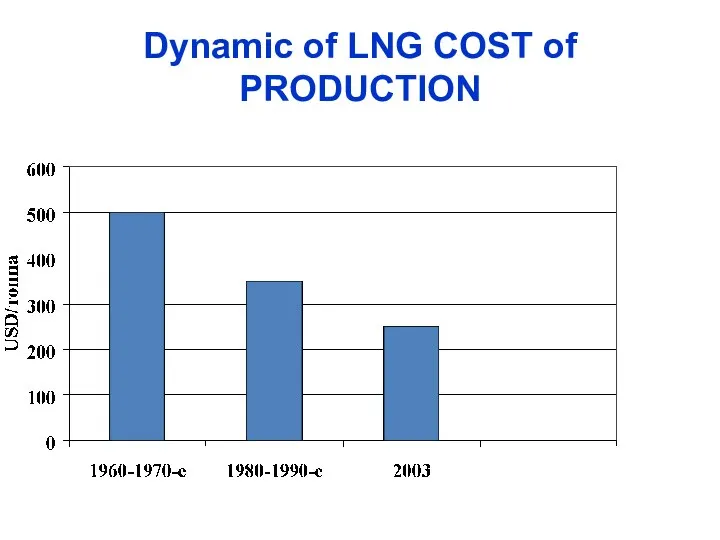
Dynamic of LNG COST of PRODUCTION
Dynamic of LNG COST of PRODUCTION
9
PRICES
Million. Btu - British thermal unit 0.252 kcal
9
PRICES
Million. Btu - British thermal unit 0.252 kcal
9
Btu - British thermal unit 0.252 kcal 1kcal=3.97Btu
49257899069014 Btu =
9
Btu - British thermal unit 0.252 kcal 1kcal=3.97Btu
49257899069014 Btu =
 The particularity of cosplayers identity with different motivation
 Презентация на тему "Как научить детей сотрудничать?" - скачать презентации по Педагогике
 Обеспечение безопасной эксплуатации жилых зданий Фрунзенского района Санкт-Петербурга
 Гражданско-правовая ответственность медицинских работников
 Презентация на тему "Социальный комикс" - скачать презентации по Педагогике
 Аттестационная работа. Традиционная культура кубанских казаков
 4_5877587462389236442
 Федеральное собрание
  Организация питания в походе
 Рабочие чертежи (с актуализированными изменениями 2015 года)
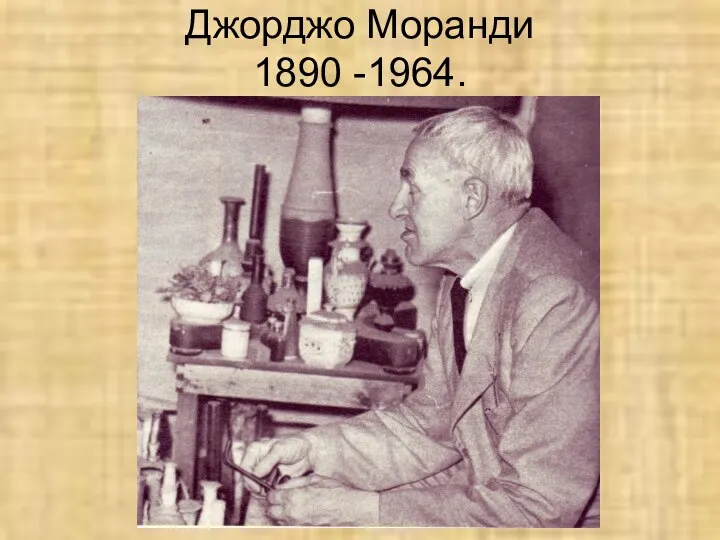 Джорджо Моранди
 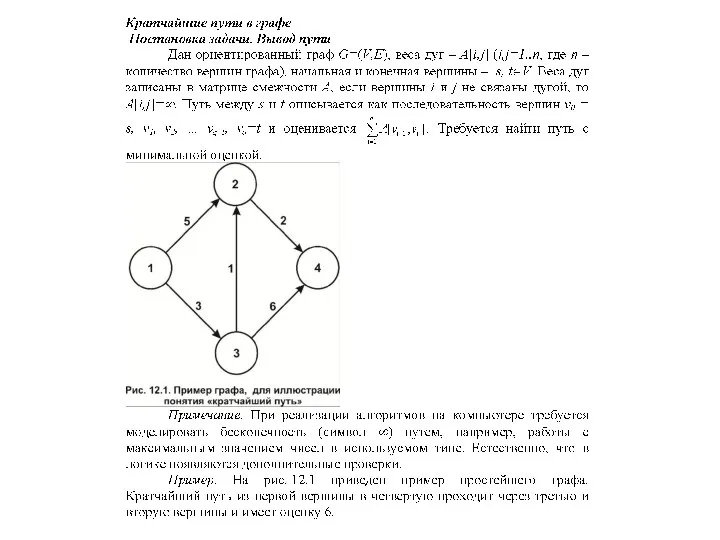 Кратчайшие пути
 Функциональная организация головного мозга
 Самураи
 Современные подходы к целеполаганию
 Особенности современного этапа развития мирового хозяйства Выполнил: студент 1-го курса очной формы обучения факультета тамо
 Проект-РСО
 Технология сборки и сварки корпуса и днища резервуара РВС 2000 куб.м
 Опыт использования бизнес-моделей в процессе обучения предпринимательству в магистратуре Екатерина Бузулукова к.э.н., ст.преп
 Гостиница “Метрополь”
  Задача Диофанта
 Matka Boska Pajęczańska
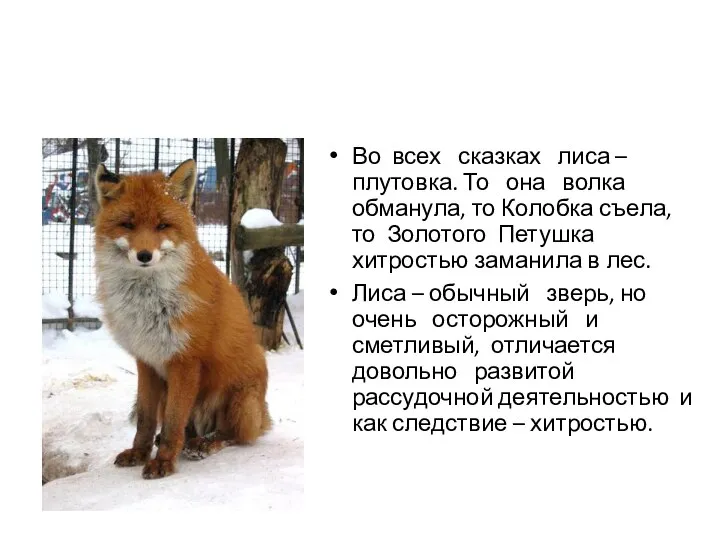 Царство Животные
  Вычисление линейной скорости и ускорения
 РЕЧЕВОЕ ПОВЕДЕНИЕ СПОРЯЩИХ
  ПСИХОЛОГИЧЕСКОЕ ОБЕСПЕЧЕНИЕ ПРОФЕССИОНАЛЬНОГО ЗДОРОВЬЯ ПЕДАГОГОВ САНКТ-ПЕТЕРБУРГ 2010
 С масленицей
 Шувалова Н. С., заместитель директора по УВР МУ СОШ № 66 г. Иваново