- Chapter Eighteen. Externalities, Open Access, and Public Goods

Содержание
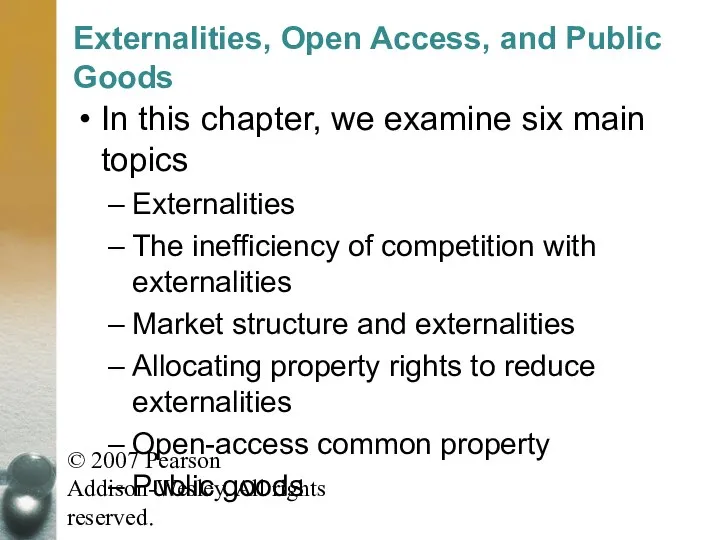
- 2. © 2007 Pearson Addison-Wesley. All rights reserved. Externalities, Open Access, and Public Goods In this chapter,
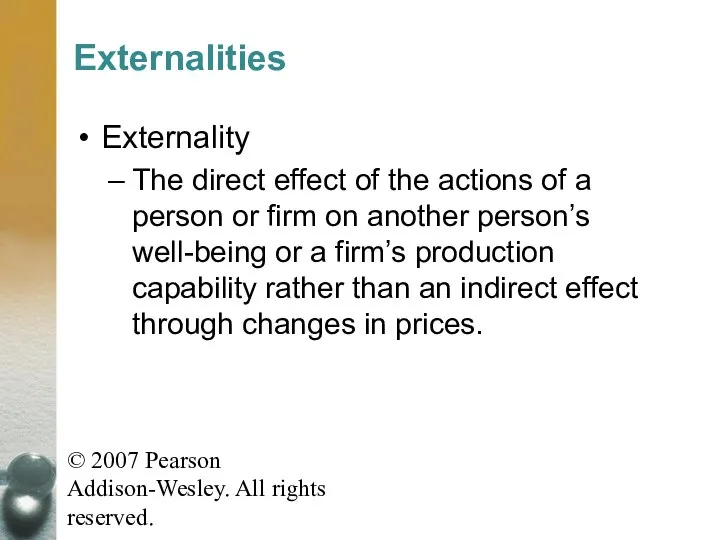
- 3. © 2007 Pearson Addison-Wesley. All rights reserved. Externalities Externality The direct effect of the actions of
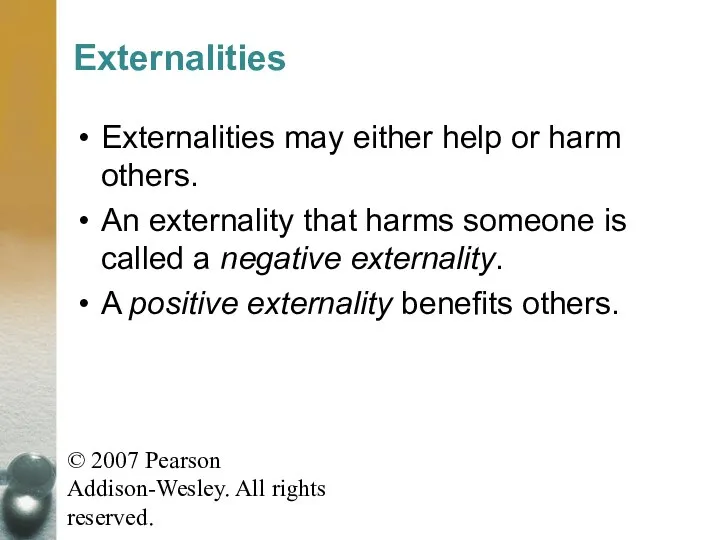
- 4. © 2007 Pearson Addison-Wesley. All rights reserved. Externalities Externalities may either help or harm others. An
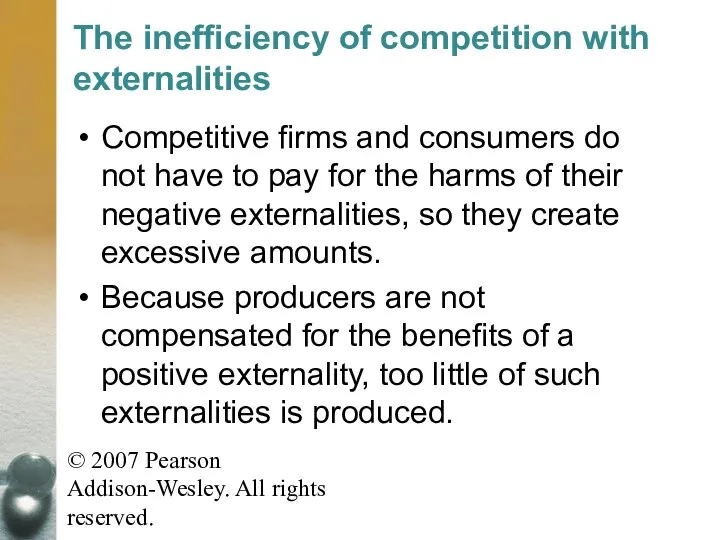
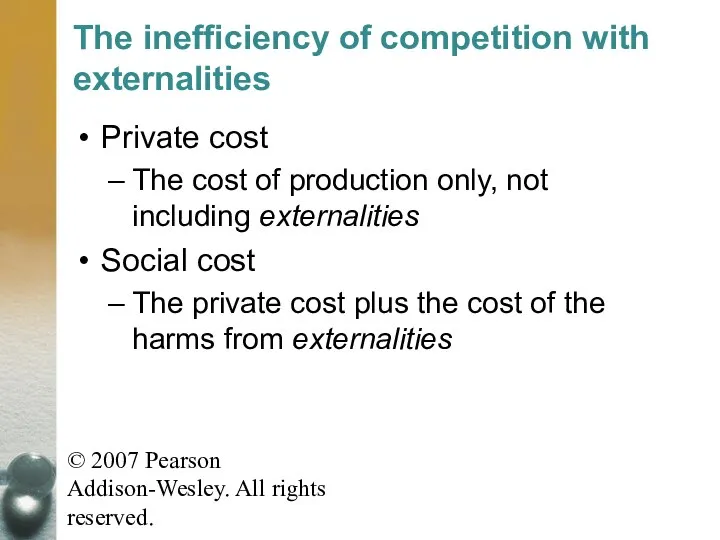
- 5. © 2007 Pearson Addison-Wesley. All rights reserved. The inefficiency of competition with externalities Competitive firms and
- 6. © 2007 Pearson Addison-Wesley. All rights reserved. The inefficiency of competition with externalities Private cost The
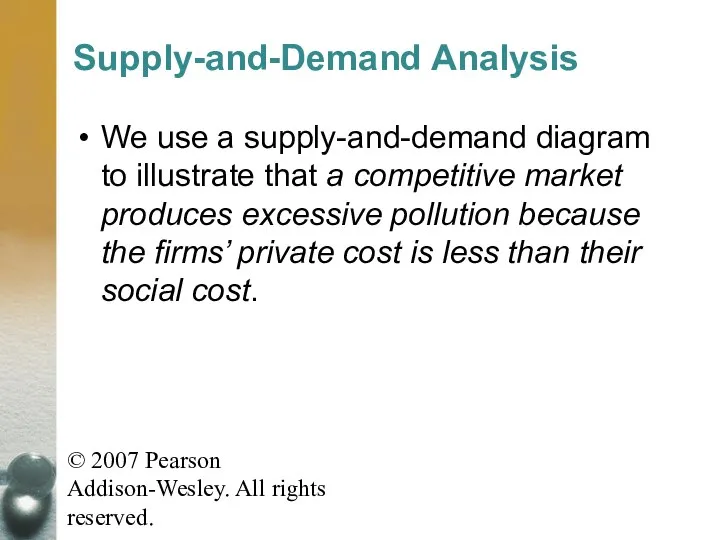
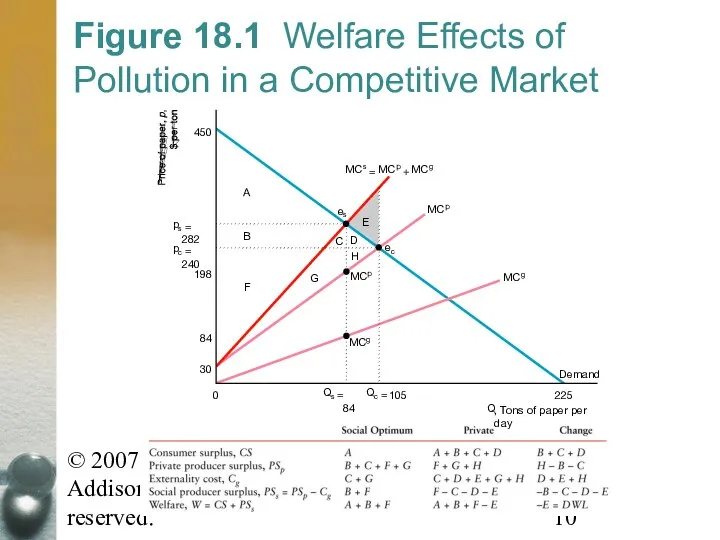
- 7. © 2007 Pearson Addison-Wesley. All rights reserved. Supply-and-Demand Analysis We use a supply-and-demand diagram to illustrate
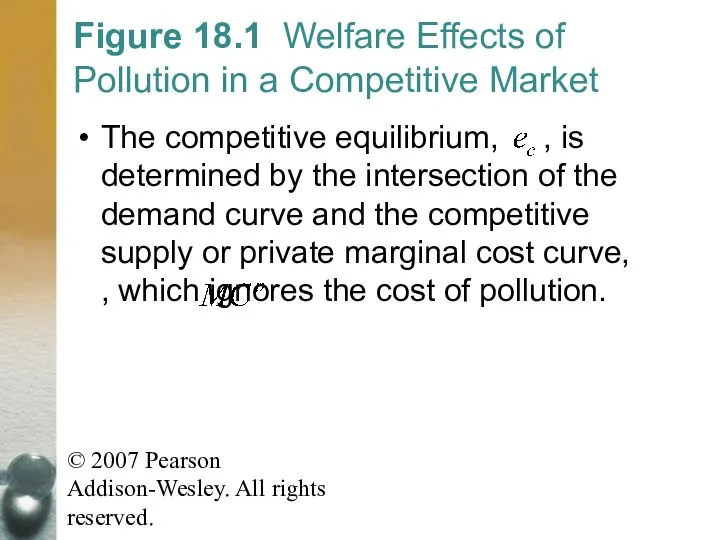
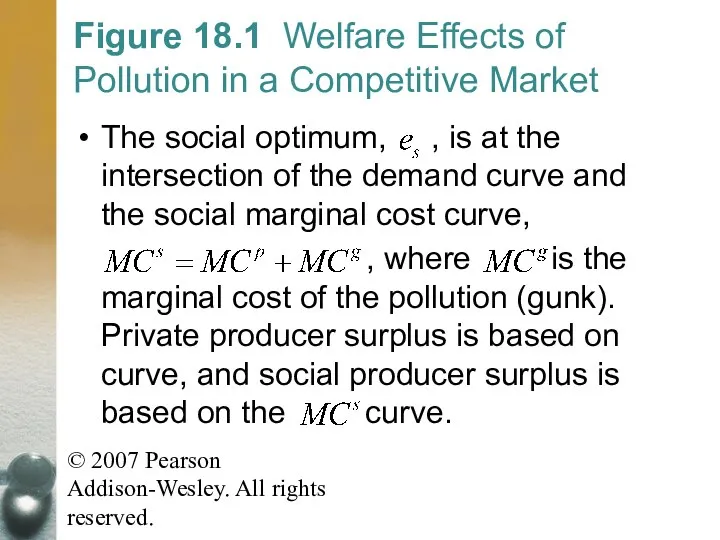
- 8. © 2007 Pearson Addison-Wesley. All rights reserved. Figure 18.1 Welfare Effects of Pollution in a Competitive
- 9. © 2007 Pearson Addison-Wesley. All rights reserved. Figure 18.1 Welfare Effects of Pollution in a Competitive
- 10. © 2007 Pearson Addison-Wesley. All rights reserved. Figure 18.1 Welfare Effects of Pollution in a Competitive
- 11. © 2007 Pearson Addison-Wesley. All rights reserved. Supply-and-Demand Analysis The figure illustrates two main results with
- 12. © 2007 Pearson Addison-Wesley. All rights reserved. Reducing Externalities Because competitive markets produce too many negative
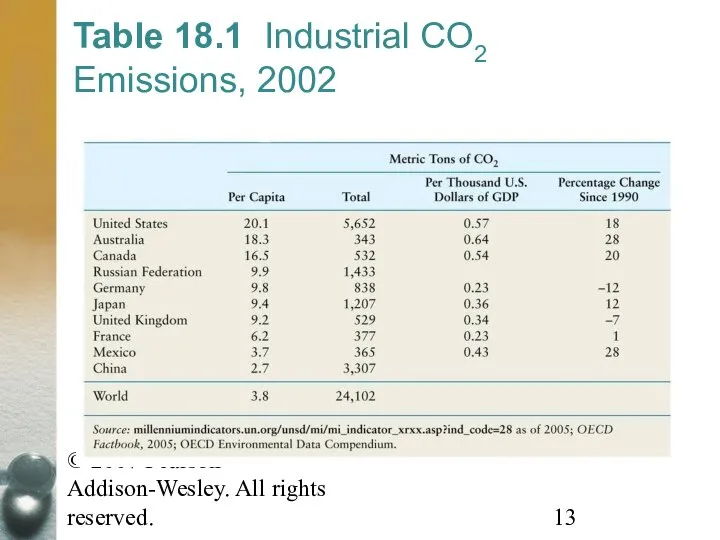
- 13. © 2007 Pearson Addison-Wesley. All rights reserved. Table 18.1 Industrial CO2 Emissions, 2002
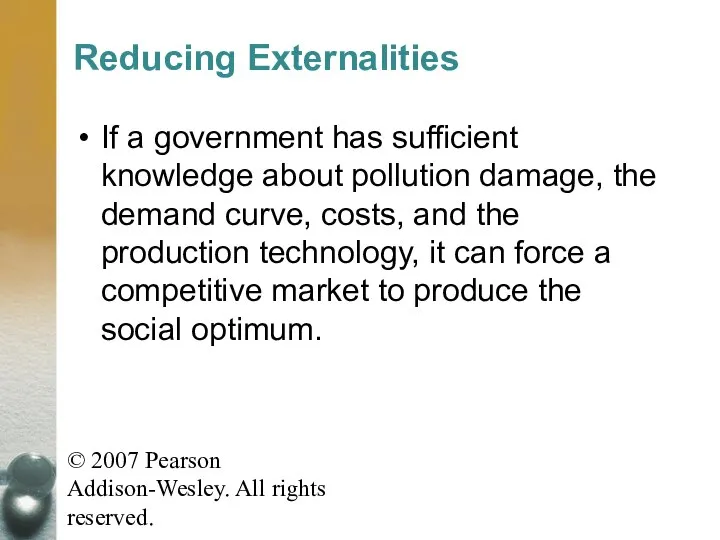
- 14. © 2007 Pearson Addison-Wesley. All rights reserved. Reducing Externalities If a government has sufficient knowledge about
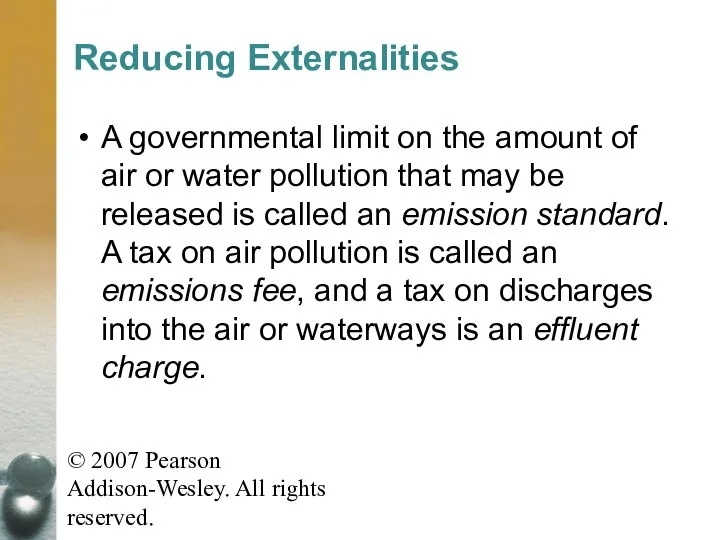
- 15. © 2007 Pearson Addison-Wesley. All rights reserved. Reducing Externalities A governmental limit on the amount of
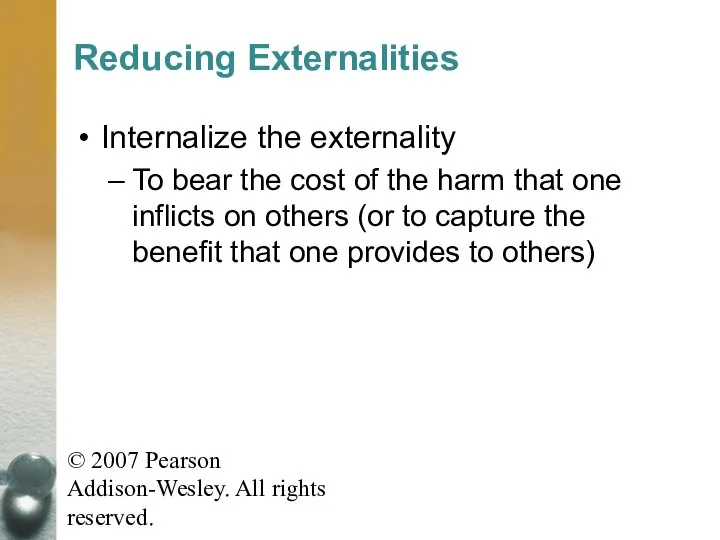
- 16. © 2007 Pearson Addison-Wesley. All rights reserved. Reducing Externalities Internalize the externality To bear the cost
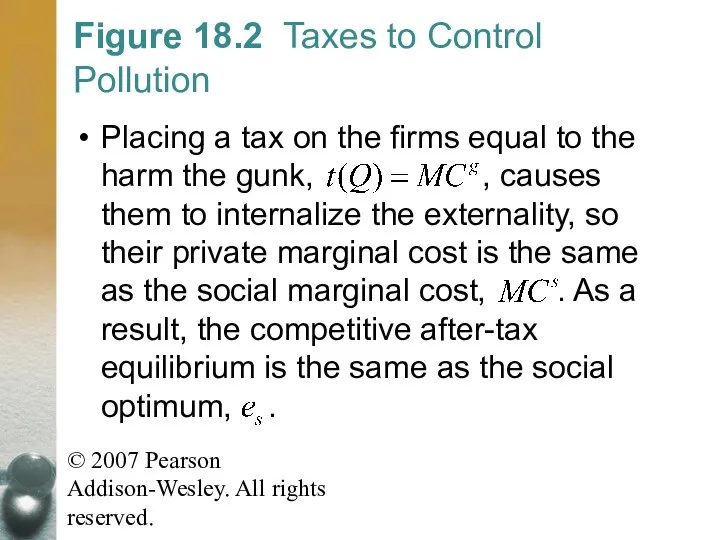
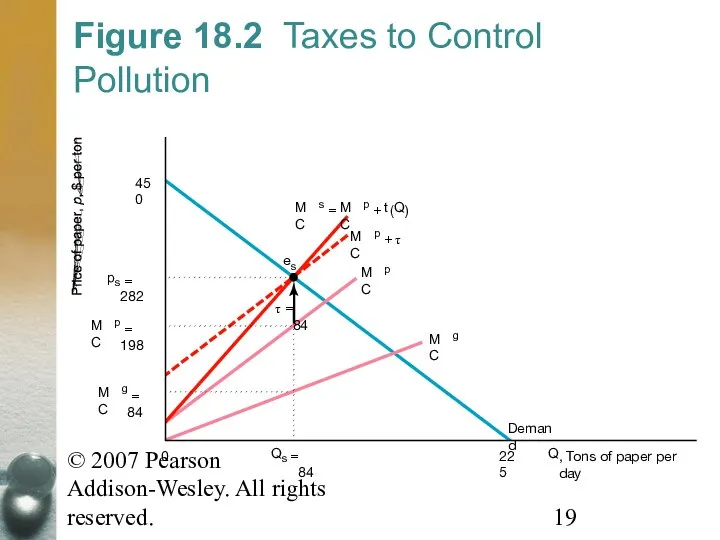
- 17. © 2007 Pearson Addison-Wesley. All rights reserved. Figure 18.2 Taxes to Control Pollution Placing a tax
- 18. © 2007 Pearson Addison-Wesley. All rights reserved. Figure 18.2 Taxes to Control Pollution Alternatively, applying a
- 19. © 2007 Pearson Addison-Wesley. All rights reserved. Figure 18.2 Taxes to Control Pollution Demand MC p
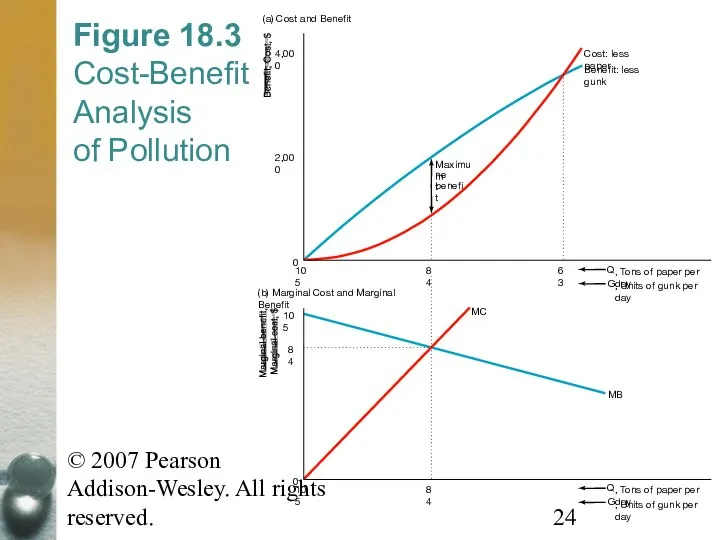
- 20. © 2007 Pearson Addison-Wesley. All rights reserved. Cost-Benefit Analysis By using a cost-benefit analysis, we obtain
- 21. © 2007 Pearson Addison-Wesley. All rights reserved. Cost-Benefit Analysis Welfare is maximized by reducing output and
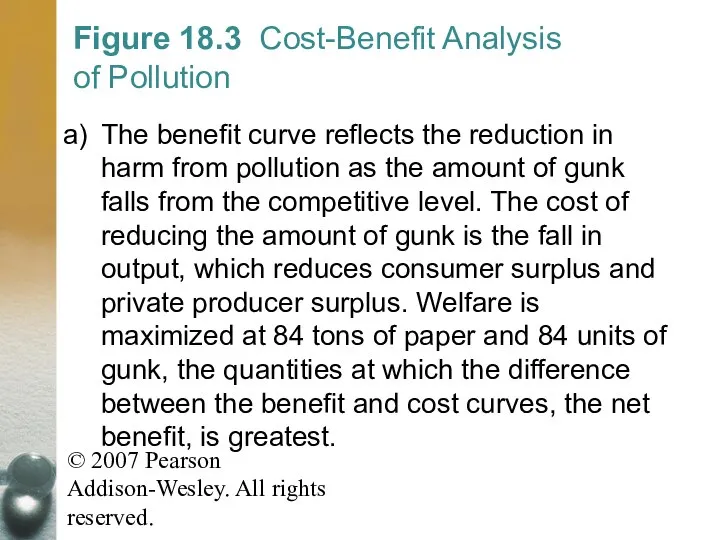
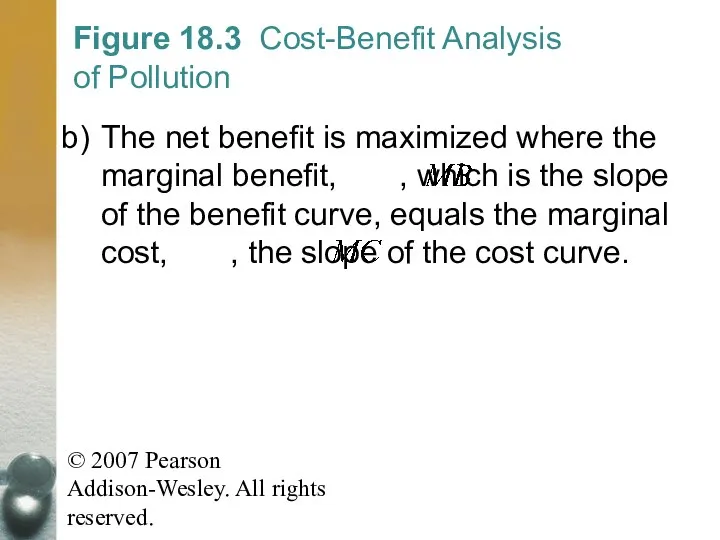
- 22. © 2007 Pearson Addison-Wesley. All rights reserved. Figure 18.3 Cost-Benefit Analysis of Pollution The benefit curve
- 23. © 2007 Pearson Addison-Wesley. All rights reserved. Figure 18.3 Cost-Benefit Analysis of Pollution The net benefit
- 24. © 2007 Pearson Addison-Wesley. All rights reserved. Figure 18.3 Cost-Benefit Analysis of Pollution Cost: less paper
- 25. © 2007 Pearson Addison-Wesley. All rights reserved. Market Structure and Externalities Two of our main results
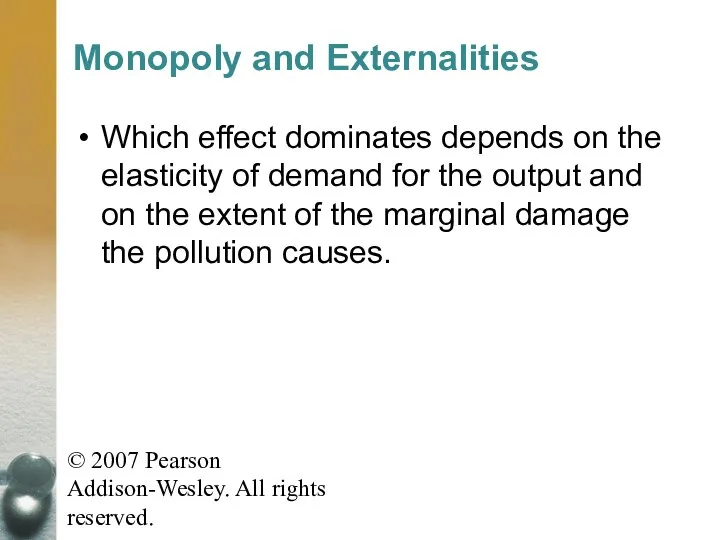
- 26. © 2007 Pearson Addison-Wesley. All rights reserved. Monopoly and Externalities Although the competitive market with an
- 27. © 2007 Pearson Addison-Wesley. All rights reserved. Monopoly and Externalities Which effect dominates depends on the
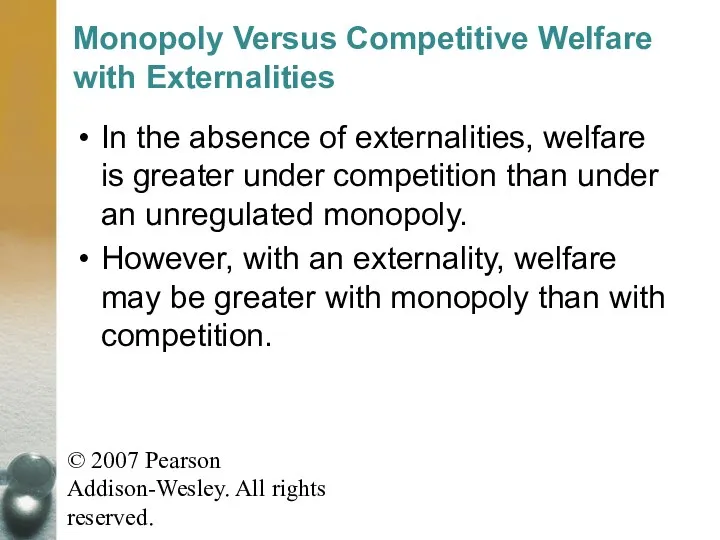
- 28. © 2007 Pearson Addison-Wesley. All rights reserved. Monopoly Versus Competitive Welfare with Externalities In the absence
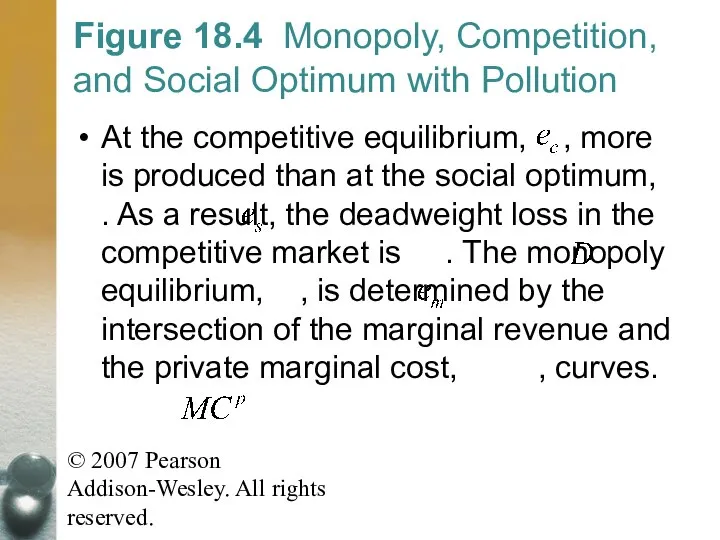
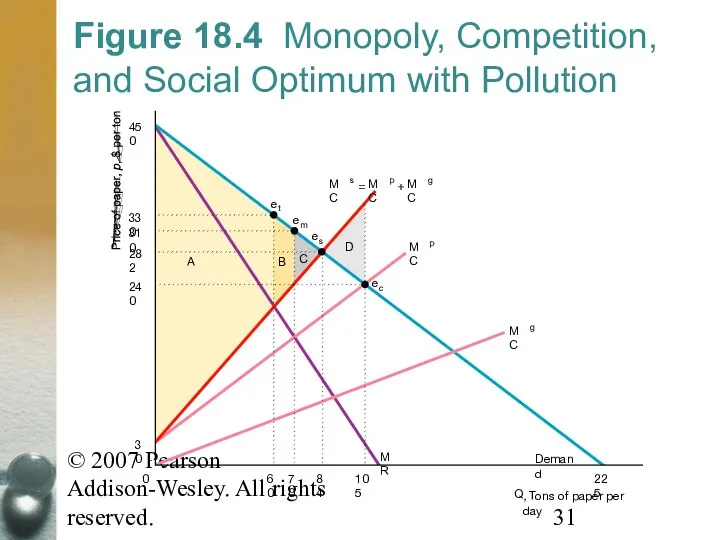
- 29. © 2007 Pearson Addison-Wesley. All rights reserved. Figure 18.4 Monopoly, Competition, and Social Optimum with Pollution
- 30. © 2007 Pearson Addison-Wesley. All rights reserved. Figure 18.4 Monopoly, Competition, and Social Optimum with Pollution
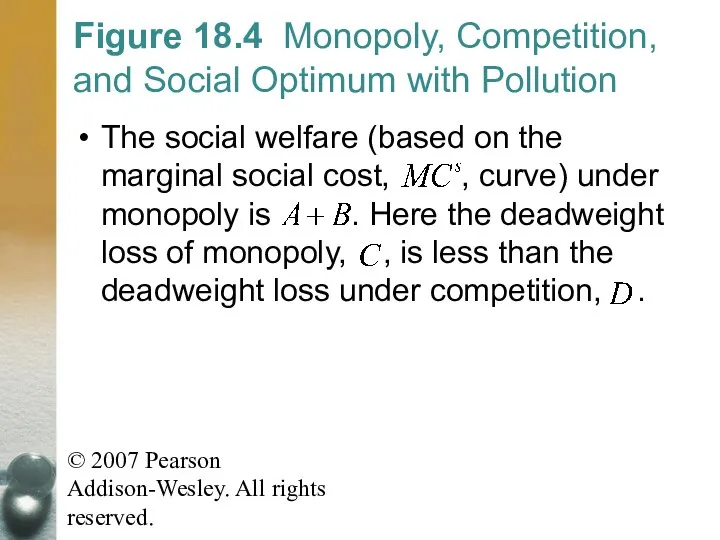
- 31. © 2007 Pearson Addison-Wesley. All rights reserved. Figure 18.4 Monopoly, Competition, and Social Optimum with Pollution
- 32. © 2007 Pearson Addison-Wesley. All rights reserved. Taxing Externalities in Noncompetitive Markets Trying to solve a
- 33. © 2007 Pearson Addison-Wesley. All rights reserved. Taxing Externalities in Noncompetitive Markets To achieve a social
- 34. © 2007 Pearson Addison-Wesley. All rights reserved. Allocating Property Rights to Reduce Externalities Instead of controlling
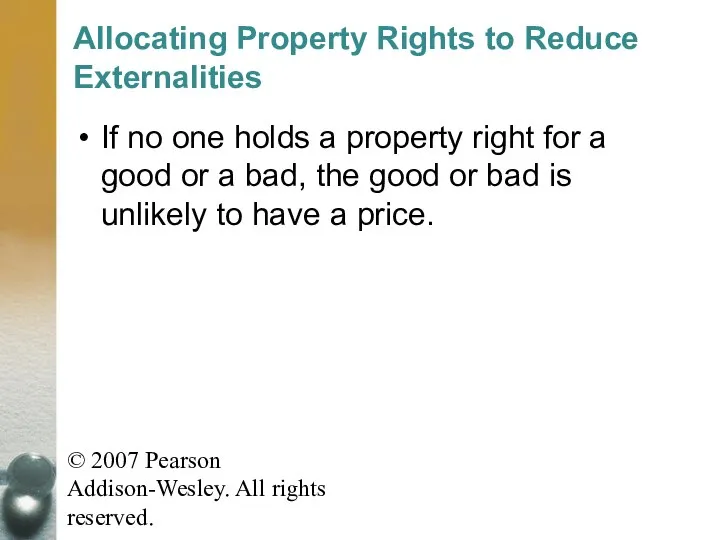
- 35. © 2007 Pearson Addison-Wesley. All rights reserved. Allocating Property Rights to Reduce Externalities If no one
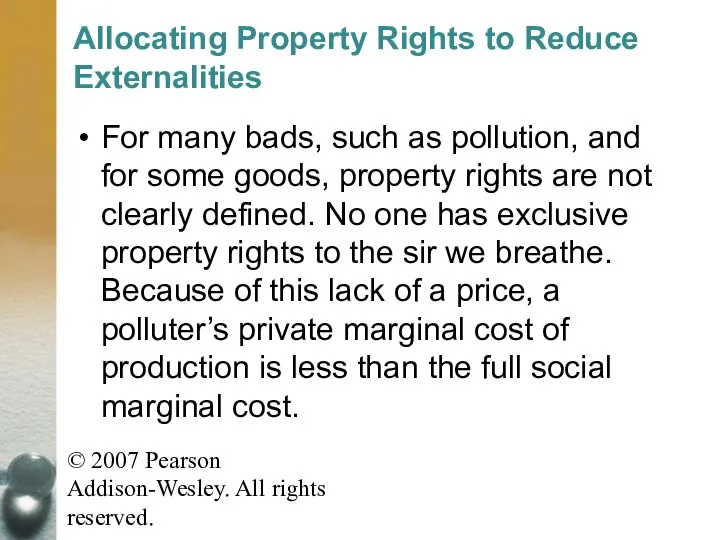
- 36. © 2007 Pearson Addison-Wesley. All rights reserved. Allocating Property Rights to Reduce Externalities For many bads,
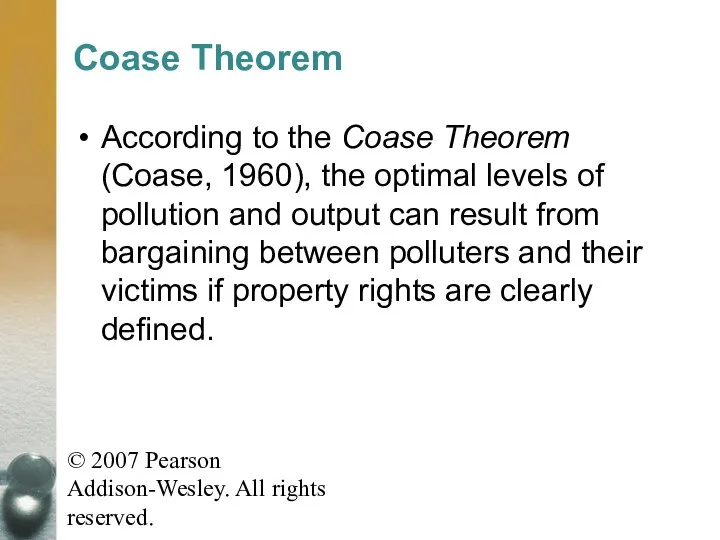
- 37. © 2007 Pearson Addison-Wesley. All rights reserved. Coase Theorem According to the Coase Theorem (Coase, 1960),
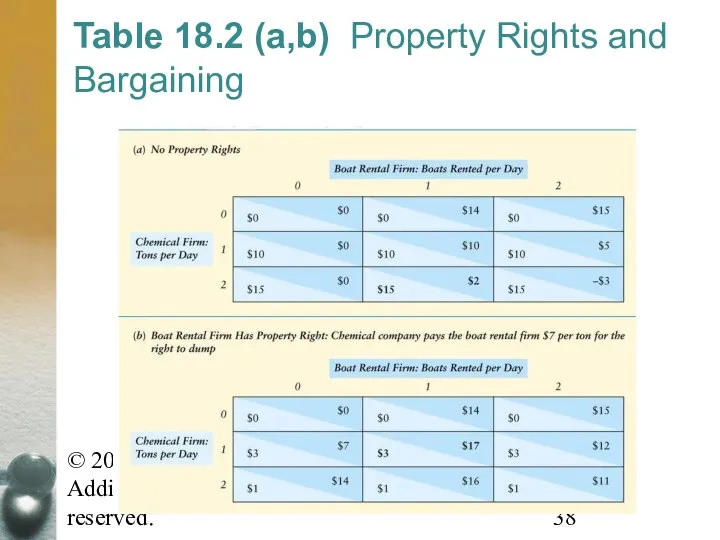
- 38. © 2007 Pearson Addison-Wesley. All rights reserved. Table 18.2 (a,b) Property Rights and Bargaining
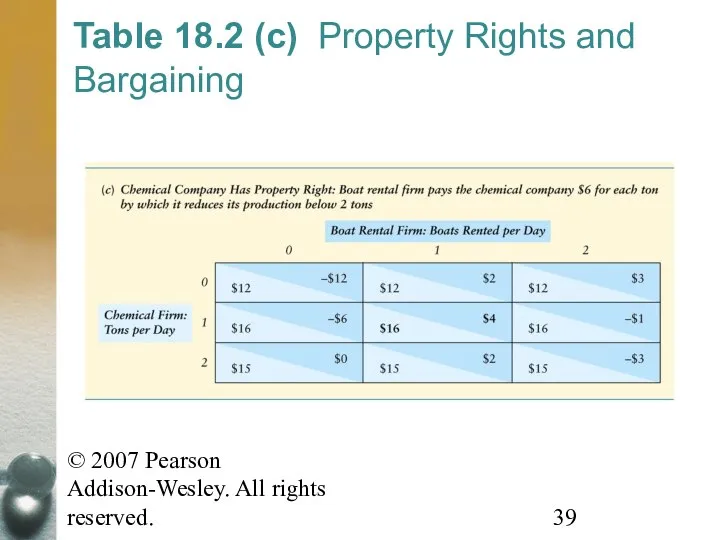
- 39. © 2007 Pearson Addison-Wesley. All rights reserved. Table 18.2 (c) Property Rights and Bargaining
- 40. © 2007 Pearson Addison-Wesley. All rights reserved. Coase Theorem If there are no impediments to bargaining,
- 41. © 2007 Pearson Addison-Wesley. All rights reserved. Coase Theorem Who gets the property rights affects the
- 42. © 2007 Pearson Addison-Wesley. All rights reserved. Problems with the Coase Approach First, if transaction costs
- 43. © 2007 Pearson Addison-Wesley. All rights reserved. Markets for Pollution If high transaction costs preclude bargaining,
- 44. © 2007 Pearson Addison-Wesley. All rights reserved. Markets for Pollution Under this cap and trade system,
- 45. © 2007 Pearson Addison-Wesley. All rights reserved. Markets for Pollution Bu using a market, the government
- 46. © 2007 Pearson Addison-Wesley. All rights reserved. Open-Access Common Property Open-Access Common Property Resources to which
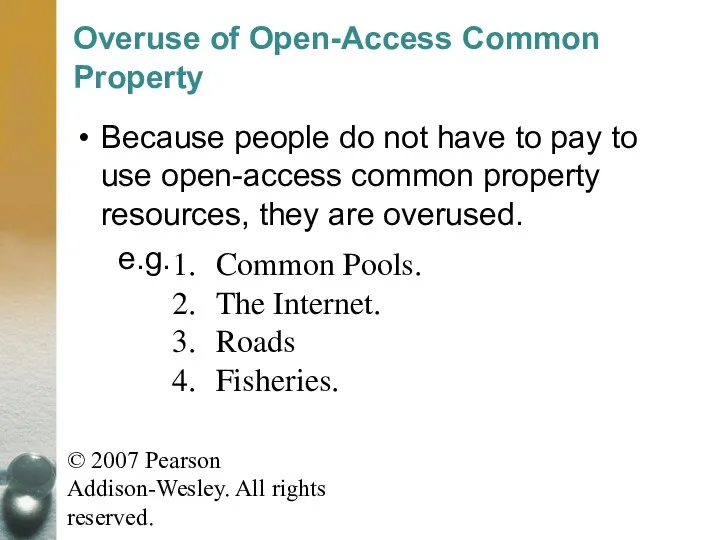
- 47. © 2007 Pearson Addison-Wesley. All rights reserved. Overuse of Open-Access Common Property Because people do not
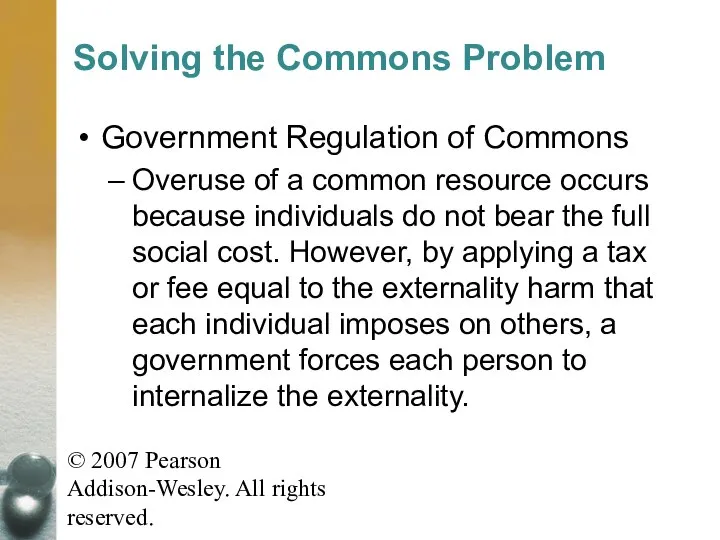
- 48. © 2007 Pearson Addison-Wesley. All rights reserved. Solving the Commons Problem Government Regulation of Commons Overuse
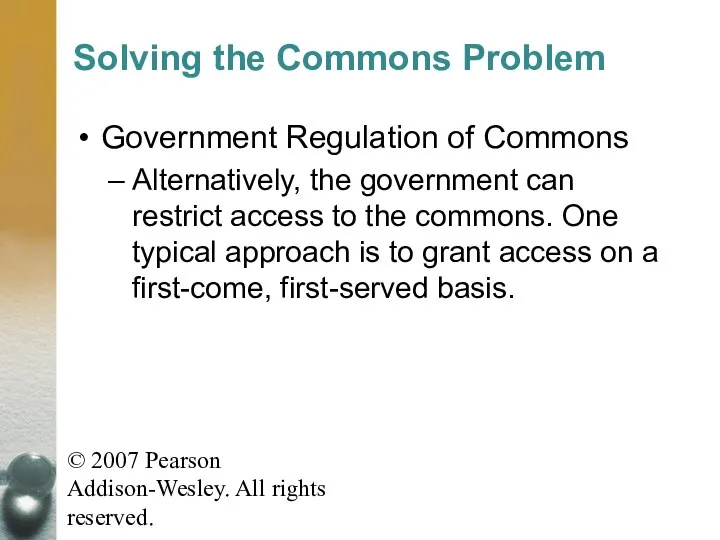
- 49. © 2007 Pearson Addison-Wesley. All rights reserved. Solving the Commons Problem Government Regulation of Commons Alternatively,
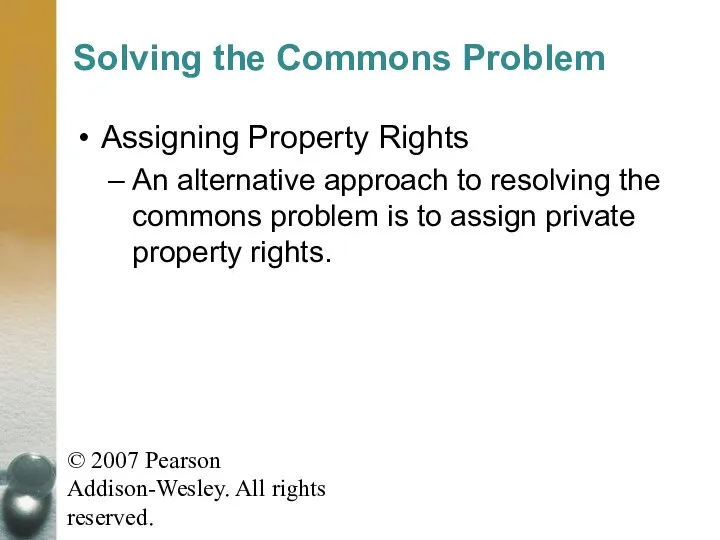
- 50. © 2007 Pearson Addison-Wesley. All rights reserved. Solving the Commons Problem Assigning Property Rights An alternative
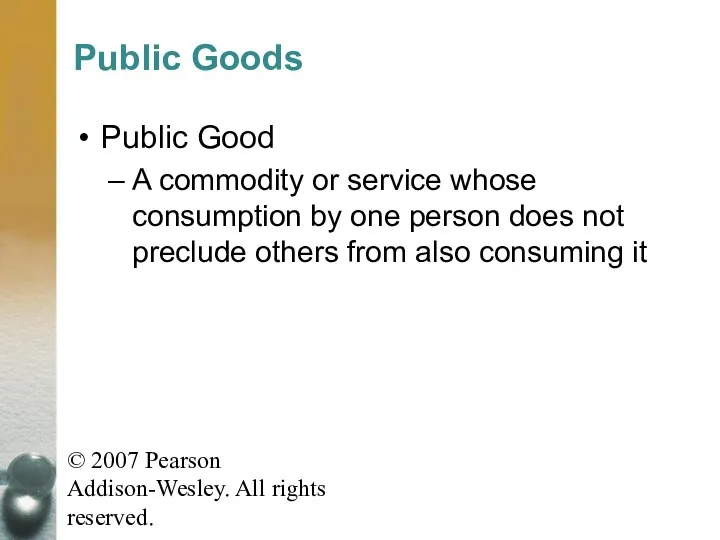
- 51. © 2007 Pearson Addison-Wesley. All rights reserved. Public Goods Public Good A commodity or service whose
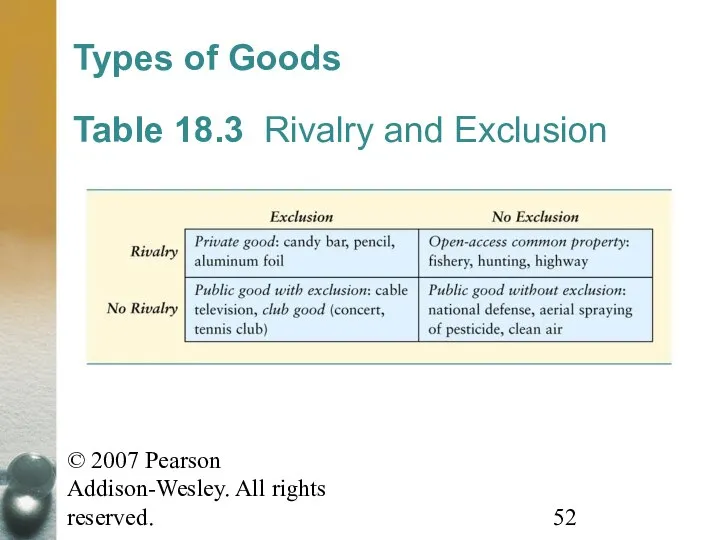
- 52. © 2007 Pearson Addison-Wesley. All rights reserved. Table 18.3 Rivalry and Exclusion Types of Goods
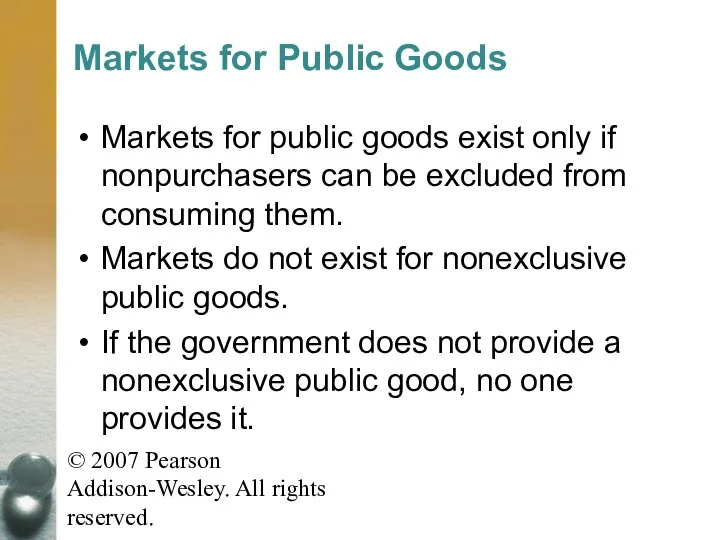
- 53. © 2007 Pearson Addison-Wesley. All rights reserved. Markets for public goods exist only if nonpurchasers can
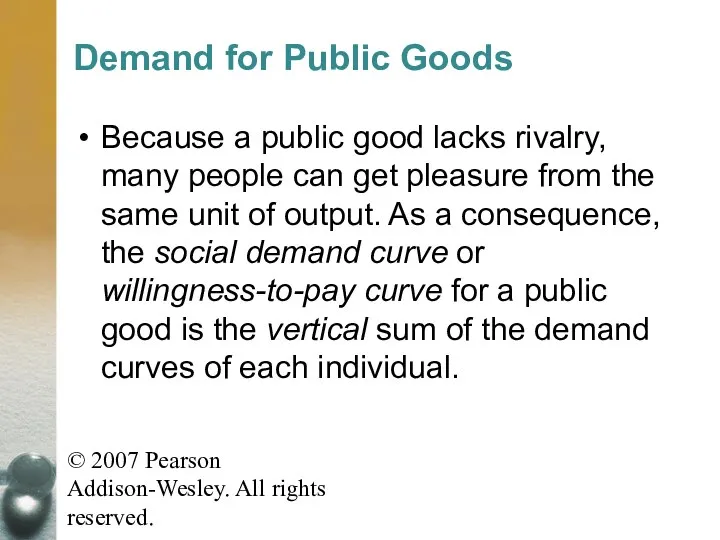
- 54. © 2007 Pearson Addison-Wesley. All rights reserved. Demand for Public Goods Because a public good lacks
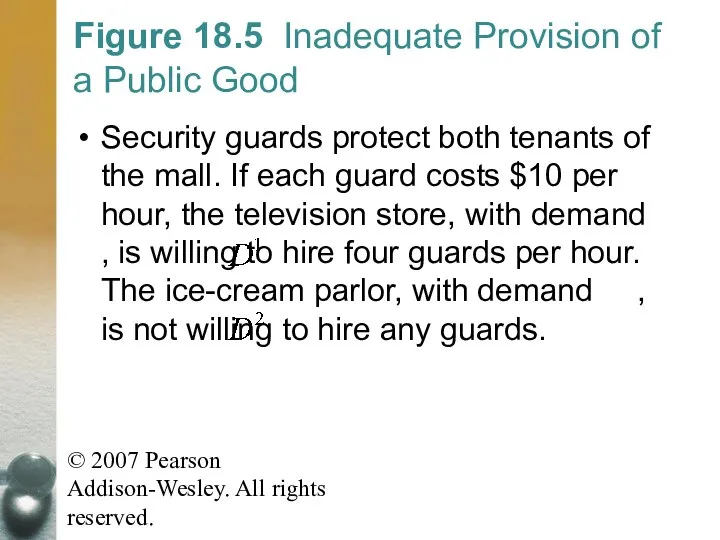
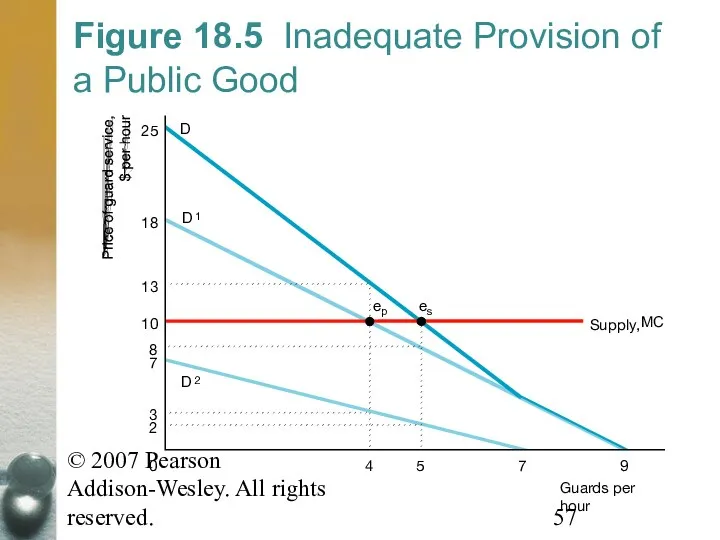
- 55. © 2007 Pearson Addison-Wesley. All rights reserved. Figure 18.5 Inadequate Provision of a Public Good Security
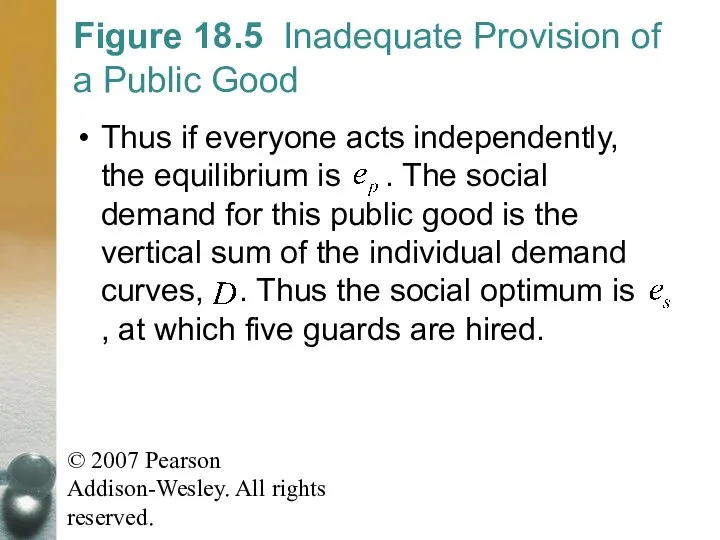
- 56. © 2007 Pearson Addison-Wesley. All rights reserved. Figure 18.5 Inadequate Provision of a Public Good Thus
- 57. © 2007 Pearson Addison-Wesley. All rights reserved. Figure 18.5 Inadequate Provision of a Public Good Guards
- 58. © 2007 Pearson Addison-Wesley. All rights reserved. Free Riding Many people are unwilling to pay for
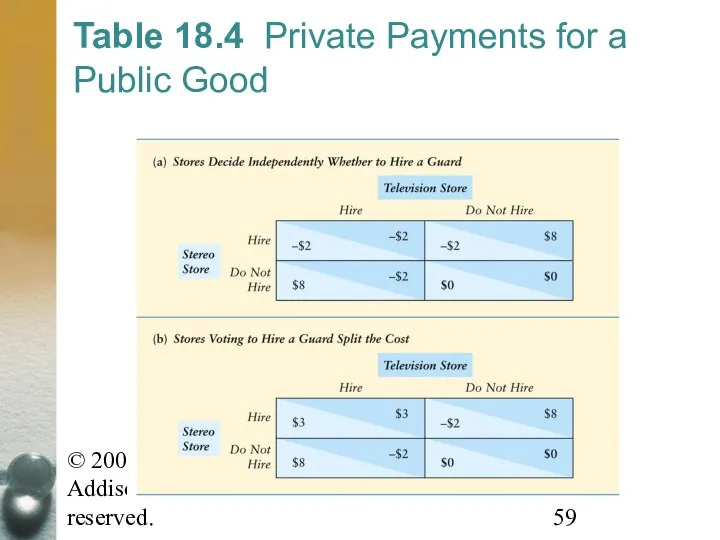
- 59. © 2007 Pearson Addison-Wesley. All rights reserved. Table 18.4 Private Payments for a Public Good
- 60. © 2007 Pearson Addison-Wesley. All rights reserved. Free Riding In each of these games, the Nash
- 61. © 2007 Pearson Addison-Wesley. All rights reserved. Reducing Free Riding Governmental or other collective actions can
- 62. © 2007 Pearson Addison-Wesley. All rights reserved. Valuing Public Goods To ensure that a nonexclusive public
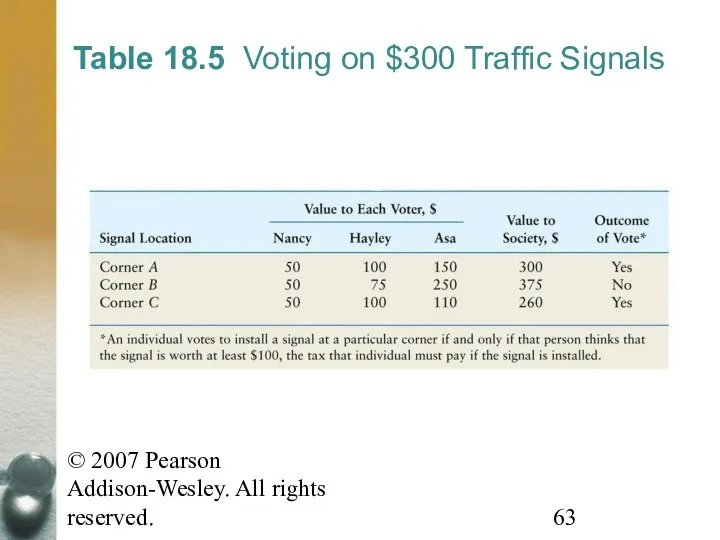
- 63. © 2007 Pearson Addison-Wesley. All rights reserved. Table 18.5 Voting on $300 Traffic Signals
- 65. Скачать презентацию
© 2007 Pearson Addison-Wesley. All rights reserved.
Externalities, Open Access, and
© 2007 Pearson Addison-Wesley. All rights reserved.
Externalities, Open Access, and
© 2007 Pearson Addison-Wesley. All rights reserved.
Externalities
Externality
The direct effect of
© 2007 Pearson Addison-Wesley. All rights reserved.
Externalities
Externality
The direct effect of
© 2007 Pearson Addison-Wesley. All rights reserved.
Externalities
Externalities may either help
© 2007 Pearson Addison-Wesley. All rights reserved.
Externalities
Externalities may either help
© 2007 Pearson Addison-Wesley. All rights reserved.
The inefficiency of competition
© 2007 Pearson Addison-Wesley. All rights reserved.
The inefficiency of competition
© 2007 Pearson Addison-Wesley. All rights reserved.
The inefficiency of competition
© 2007 Pearson Addison-Wesley. All rights reserved.
The inefficiency of competition
© 2007 Pearson Addison-Wesley. All rights reserved.
Supply-and-Demand Analysis
We use a
© 2007 Pearson Addison-Wesley. All rights reserved.
Supply-and-Demand Analysis
We use a
© 2007 Pearson Addison-Wesley. All rights reserved.
Figure 18.1 Welfare Effects
© 2007 Pearson Addison-Wesley. All rights reserved.
Figure 18.1 Welfare Effects
© 2007 Pearson Addison-Wesley. All rights reserved.
Figure 18.1 Welfare Effects
© 2007 Pearson Addison-Wesley. All rights reserved.
Figure 18.1 Welfare Effects
© 2007 Pearson Addison-Wesley. All rights reserved.
Figure 18.1 Welfare Effects
© 2007 Pearson Addison-Wesley. All rights reserved.
Figure 18.1 Welfare Effects
© 2007 Pearson Addison-Wesley. All rights reserved.
Supply-and-Demand Analysis
The figure illustrates
© 2007 Pearson Addison-Wesley. All rights reserved.
Supply-and-Demand Analysis
The figure illustrates
© 2007 Pearson Addison-Wesley. All rights reserved.
Reducing Externalities
Because competitive markets
© 2007 Pearson Addison-Wesley. All rights reserved.
Reducing Externalities
Because competitive markets
© 2007 Pearson Addison-Wesley. All rights reserved.
Table 18.1 Industrial CO2
© 2007 Pearson Addison-Wesley. All rights reserved.
Table 18.1 Industrial CO2
© 2007 Pearson Addison-Wesley. All rights reserved.
Reducing Externalities
If a government
© 2007 Pearson Addison-Wesley. All rights reserved.
Reducing Externalities
If a government
© 2007 Pearson Addison-Wesley. All rights reserved.
Reducing Externalities
A governmental limit
© 2007 Pearson Addison-Wesley. All rights reserved.
Reducing Externalities
A governmental limit
© 2007 Pearson Addison-Wesley. All rights reserved.
Reducing Externalities
Internalize the externality
To
© 2007 Pearson Addison-Wesley. All rights reserved.
Reducing Externalities
Internalize the externality
To
© 2007 Pearson Addison-Wesley. All rights reserved.
Figure 18.2 Taxes to
© 2007 Pearson Addison-Wesley. All rights reserved.
Figure 18.2 Taxes to

© 2007 Pearson Addison-Wesley. All rights reserved.
Figure 18.2 Taxes to
© 2007 Pearson Addison-Wesley. All rights reserved.
Figure 18.2 Taxes to
© 2007 Pearson Addison-Wesley. All rights reserved.
Figure 18.2 Taxes to
© 2007 Pearson Addison-Wesley. All rights reserved.
Figure 18.2 Taxes to
© 2007 Pearson Addison-Wesley. All rights reserved.
Cost-Benefit Analysis
By using a
© 2007 Pearson Addison-Wesley. All rights reserved.
Cost-Benefit Analysis
By using a
© 2007 Pearson Addison-Wesley. All rights reserved.
Cost-Benefit Analysis
Welfare is maximized
© 2007 Pearson Addison-Wesley. All rights reserved.
Cost-Benefit Analysis
Welfare is maximized
© 2007 Pearson Addison-Wesley. All rights reserved.
Figure 18.3 Cost-Benefit Analysis
© 2007 Pearson Addison-Wesley. All rights reserved.
Figure 18.3 Cost-Benefit Analysis
© 2007 Pearson Addison-Wesley. All rights reserved.
Figure 18.3 Cost-Benefit Analysis
© 2007 Pearson Addison-Wesley. All rights reserved.
Figure 18.3 Cost-Benefit Analysis
© 2007 Pearson Addison-Wesley. All rights reserved.
Figure 18.3 Cost-Benefit Analysis
© 2007 Pearson Addison-Wesley. All rights reserved.
Figure 18.3 Cost-Benefit Analysis
© 2007 Pearson Addison-Wesley. All rights reserved.
Market Structure and Externalities
Two
© 2007 Pearson Addison-Wesley. All rights reserved.
Market Structure and Externalities
Two
© 2007 Pearson Addison-Wesley. All rights reserved.
Monopoly and Externalities
Although the
© 2007 Pearson Addison-Wesley. All rights reserved.
Monopoly and Externalities
Although the
© 2007 Pearson Addison-Wesley. All rights reserved.
Monopoly and Externalities
Which effect
© 2007 Pearson Addison-Wesley. All rights reserved.
Monopoly and Externalities
Which effect
© 2007 Pearson Addison-Wesley. All rights reserved.
Monopoly Versus Competitive Welfare
© 2007 Pearson Addison-Wesley. All rights reserved.
Monopoly Versus Competitive Welfare
© 2007 Pearson Addison-Wesley. All rights reserved.
Figure 18.4 Monopoly, Competition,
© 2007 Pearson Addison-Wesley. All rights reserved.
Figure 18.4 Monopoly, Competition,
© 2007 Pearson Addison-Wesley. All rights reserved.
Figure 18.4 Monopoly, Competition,
© 2007 Pearson Addison-Wesley. All rights reserved.
Figure 18.4 Monopoly, Competition,
© 2007 Pearson Addison-Wesley. All rights reserved.
Figure 18.4 Monopoly, Competition,
© 2007 Pearson Addison-Wesley. All rights reserved.
Figure 18.4 Monopoly, Competition,
© 2007 Pearson Addison-Wesley. All rights reserved.
Taxing Externalities in Noncompetitive
© 2007 Pearson Addison-Wesley. All rights reserved.
Taxing Externalities in Noncompetitive
© 2007 Pearson Addison-Wesley. All rights reserved.
Taxing Externalities in Noncompetitive
© 2007 Pearson Addison-Wesley. All rights reserved.
Taxing Externalities in Noncompetitive
© 2007 Pearson Addison-Wesley. All rights reserved.
Allocating Property Rights to
© 2007 Pearson Addison-Wesley. All rights reserved.
Allocating Property Rights to
© 2007 Pearson Addison-Wesley. All rights reserved.
Allocating Property Rights to
© 2007 Pearson Addison-Wesley. All rights reserved.
Allocating Property Rights to
© 2007 Pearson Addison-Wesley. All rights reserved.
Allocating Property Rights to
© 2007 Pearson Addison-Wesley. All rights reserved.
Allocating Property Rights to
© 2007 Pearson Addison-Wesley. All rights reserved.
Coase Theorem
According to the
© 2007 Pearson Addison-Wesley. All rights reserved.
Coase Theorem
According to the
© 2007 Pearson Addison-Wesley. All rights reserved.
Table 18.2 (a,b) Property
© 2007 Pearson Addison-Wesley. All rights reserved.
Table 18.2 (a,b) Property
© 2007 Pearson Addison-Wesley. All rights reserved.
Table 18.2 (c) Property
© 2007 Pearson Addison-Wesley. All rights reserved.
Table 18.2 (c) Property
© 2007 Pearson Addison-Wesley. All rights reserved.
Coase Theorem
If there are
© 2007 Pearson Addison-Wesley. All rights reserved.
Coase Theorem
If there are
© 2007 Pearson Addison-Wesley. All rights reserved.
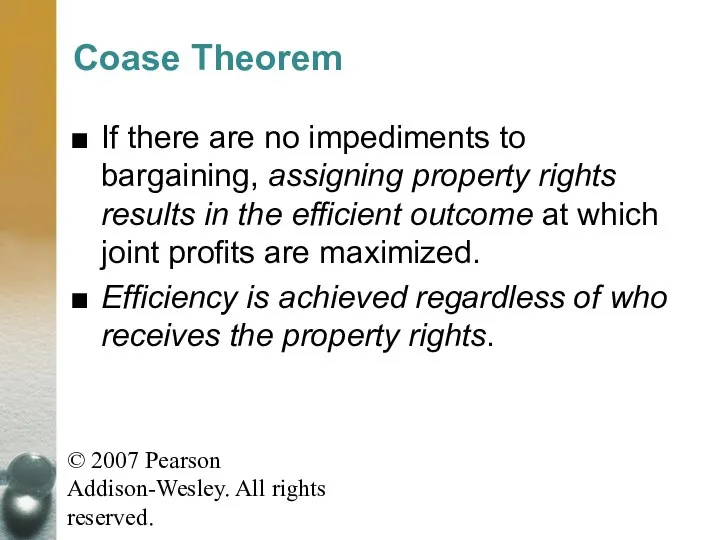
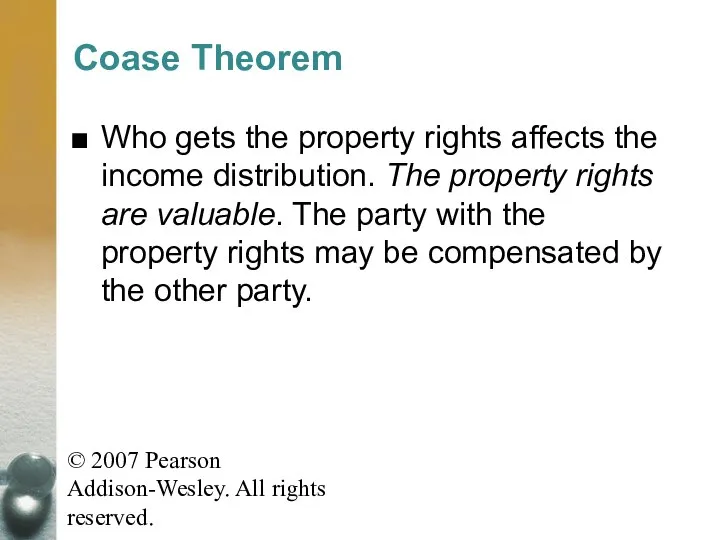
Coase Theorem
Who gets the
© 2007 Pearson Addison-Wesley. All rights reserved.
Coase Theorem
Who gets the
© 2007 Pearson Addison-Wesley. All rights reserved.
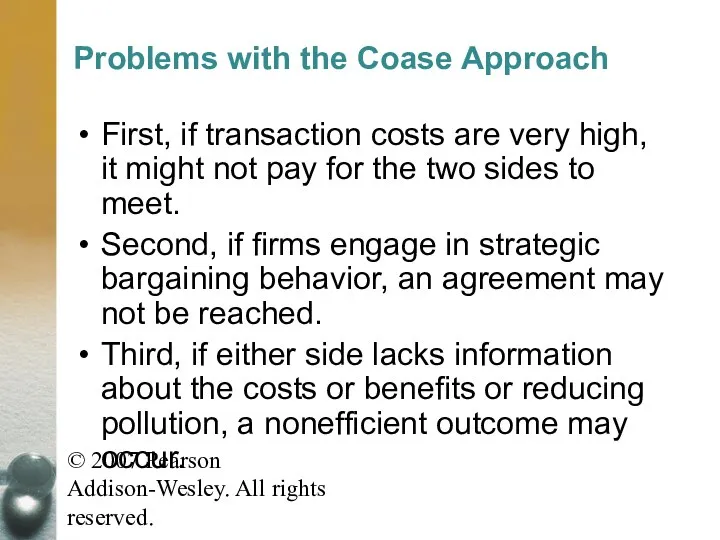
Problems with the Coase
© 2007 Pearson Addison-Wesley. All rights reserved.
Problems with the Coase
© 2007 Pearson Addison-Wesley. All rights reserved.
Markets for Pollution
If high
© 2007 Pearson Addison-Wesley. All rights reserved.
Markets for Pollution
If high
© 2007 Pearson Addison-Wesley. All rights reserved.
Markets for Pollution
Under this
© 2007 Pearson Addison-Wesley. All rights reserved.
Markets for Pollution
Under this
© 2007 Pearson Addison-Wesley. All rights reserved.
Markets for Pollution
Bu using
© 2007 Pearson Addison-Wesley. All rights reserved.
Markets for Pollution
Bu using
© 2007 Pearson Addison-Wesley. All rights reserved.
Open-Access Common Property
Open-Access Common
© 2007 Pearson Addison-Wesley. All rights reserved.
Open-Access Common Property
Open-Access Common
© 2007 Pearson Addison-Wesley. All rights reserved.
Overuse of Open-Access Common
© 2007 Pearson Addison-Wesley. All rights reserved.
Overuse of Open-Access Common
© 2007 Pearson Addison-Wesley. All rights reserved.
Solving the Commons Problem
Government
© 2007 Pearson Addison-Wesley. All rights reserved.
Solving the Commons Problem
Government
© 2007 Pearson Addison-Wesley. All rights reserved.
Solving the Commons Problem
Government
© 2007 Pearson Addison-Wesley. All rights reserved.
Solving the Commons Problem
Government
© 2007 Pearson Addison-Wesley. All rights reserved.
Solving the Commons Problem
Assigning
© 2007 Pearson Addison-Wesley. All rights reserved.
Solving the Commons Problem
Assigning
© 2007 Pearson Addison-Wesley. All rights reserved.
Public Goods
Public Good
A commodity
© 2007 Pearson Addison-Wesley. All rights reserved.
Public Goods
Public Good
A commodity
© 2007 Pearson Addison-Wesley. All rights reserved.
Table 18.3 Rivalry and
© 2007 Pearson Addison-Wesley. All rights reserved.
Table 18.3 Rivalry and
© 2007 Pearson Addison-Wesley. All rights reserved.
Markets for public goods
© 2007 Pearson Addison-Wesley. All rights reserved.
Markets for public goods
© 2007 Pearson Addison-Wesley. All rights reserved.
Demand for Public Goods
Because
© 2007 Pearson Addison-Wesley. All rights reserved.
Demand for Public Goods
Because
© 2007 Pearson Addison-Wesley. All rights reserved.
Figure 18.5 Inadequate Provision
© 2007 Pearson Addison-Wesley. All rights reserved.
Figure 18.5 Inadequate Provision
© 2007 Pearson Addison-Wesley. All rights reserved.
Figure 18.5 Inadequate Provision
© 2007 Pearson Addison-Wesley. All rights reserved.
Figure 18.5 Inadequate Provision
© 2007 Pearson Addison-Wesley. All rights reserved.
Figure 18.5 Inadequate Provision
© 2007 Pearson Addison-Wesley. All rights reserved.
Figure 18.5 Inadequate Provision
© 2007 Pearson Addison-Wesley. All rights reserved.
Free Riding
Many people are
© 2007 Pearson Addison-Wesley. All rights reserved.
Free Riding
Many people are
© 2007 Pearson Addison-Wesley. All rights reserved.
Table 18.4 Private Payments
© 2007 Pearson Addison-Wesley. All rights reserved.
Table 18.4 Private Payments
© 2007 Pearson Addison-Wesley. All rights reserved.
Free Riding
In each of
© 2007 Pearson Addison-Wesley. All rights reserved.
Free Riding
In each of
© 2007 Pearson Addison-Wesley. All rights reserved.
Reducing Free Riding
Governmental or
© 2007 Pearson Addison-Wesley. All rights reserved.
Reducing Free Riding
Governmental or
© 2007 Pearson Addison-Wesley. All rights reserved.
Valuing Public Goods
To ensure
© 2007 Pearson Addison-Wesley. All rights reserved.
Valuing Public Goods
To ensure
© 2007 Pearson Addison-Wesley. All rights reserved.
Table 18.5 Voting on
© 2007 Pearson Addison-Wesley. All rights reserved.
Table 18.5 Voting on
 Внешнеторговая политика и роль государства в ее регулировании
 Человек и техника. Проблемы и перспективы взаимодействия
 Теория предельных предельных продуктов и микроэкономическая модель предприятия. Издержки производства и прибыль
 Производственная и организационная структуры предприятия. (Тема 2)
 Теория прав собственности
 Обмен, торговля, реклама
 Российская империя
 Информационное обеспечение комплексного экономического анализа
 Глобальные проблемы человечества и геополитические процессы
 Занятость и безработица
 Человек и экономика. Ограниченность и выбор как основные понятия экономической науки
 Экономика. Теория отраслевых рынков
 Разработка и внедрение системы учета количественно-качественных характеристик продукции ЗАО «Содружество-Соя»
 Теория организации
 Территориальный орган Федеральной службы государственной статистики по Курской области
 Конвент. Роль учёта, анализа и аудита в защите Public Interest
 Экономика России в ситеме международного разделения труда
 Собственность и ее место в экономической системе. Модели экономических систем. Рыночная экономика
 Anticrisis organization
 Экономическая социализация молодежи
 Управление государственными финансами и регулирование финансовых рынков
 Tasks Forcasting methods. The rule of min costs
 Объединенное народнохозяйственное товарищество
 Анализ персонала, заработной платы и производительности труда на предприятии
 Анализ национальной и конфессиональной политики в Республике Коми
 Рыночная экономика. Рыночные отношения в экономике
 მენეჯერული სტატისტიკა. შერჩევა და შერჩევის განაწილება. თავი 7
 Экономика отрасли