- Economics. Principles and applications by

Содержание
- 2. Chapter 1 What is Economics ?
- 3. Overview What is economics? Definition, scarcity, and choice The world of economics Micro vs. Macro Positive
- 4. Economics, Scarcity, and Choice Economics Study of choice under conditions of scarcity Scarcity Situation in which
- 5. Scarcity and Individual Choice Unlimited variety of scarcities, based on two basic limitations: Scarce time Limited
- 6. Scarcity and Individual Choice Limitations force each of us to make choices Economists study Choices Consequences
- 7. Scarcity and Social Choice Society faces a scarcity of resources Categories of resources: Labor Capital Human
- 8. Scarcity and Economics Problems studied in economics: the scarcity of resources—and the choices it forces us
- 9. Scarcity and Economics Economists study the decisions made by households, firms, and governments to Explain how
- 10. Microeconomics Micro comes from the Greek word mikros, meaning “small” Studies the behavior of individual households,
- 11. Macroeconomics Macro comes from the Greek word makros, meaning “large” Studies the behavior of the overall
- 12. Positive and Normative Economics Positive economics: how the economy works Can be true or false Can
- 13. Why Economists Disagree The difference of opinion may be positive in nature Facts are being disputed
- 14. Why Study Economics To understand the world better Global events and personal phenomena To achieve social
- 15. Why Study Economics To help prepare for other careers A wide range of careers deal with
- 16. The Methods of Economics Use economic models to develop economic theories Economic models are built with
- 17. Economic Models: Assumptions and Conclusions Two types of assumptions: Simplifying assumptions Essential features can stand out
- 18. The Three Step Process Economists follow the same three-step process to analyze almost any economic problem:
- 19. Math, Jargon, and Other Concerns… Economic jargon Special words that allow economists to more precisely express
- 20. How to Study Economics Economics must be studied actively, not passively Active study Reproduce what you
- 21. Math Review Tables and graphs Tables Straight-line graphs Curved lines Linear equations Lines and curves shift
- 22. Tables and Graphs TABLE A.1 Advertising and Sales at Len & Harry’s
- 23. Straight-line Graphs FIGURE A.1 A Graph of Advertising and Sales Advertising ($1,000 per month) Sales ($1,000
- 24. Straight-line Graphs Slope of a straight line = Change in vertical variable / Change in horizontal
- 25. Curved Lines FIGURE A.2 Measuring the Slope of a Curve 1. The slope of this curve
- 26. Linear Equations Y = a+bX a: vertical intercept b: slope Exercise: what is the linear equation
- 27. Linear Equations Remember : Y= 18+3X For example, how much expenses are necessary to secure a
- 28. Linear Equations 0 a b > 0 0 a > 0 FIGURE A.3 Straight Lines with
- 29. Linear Equations 0 a b = 0 0 a = 0 FIGURE A.3 Straight Lines with
- 30. Linear Equations 0 a b 0 a FIGURE A.3 Straight Lines with Different Slopes and Vertical
- 31. 6 36 C'' C' C July September June 44 Line Shift FIGURE A.4 Shifts in the
- 32. Curves Shift FIGURE A.5 Shifts of Curved Lines An increase in Z causes an increase in
- 33. Shifts vs. Movements Along a Line Suppose Y is the dependent variable, which is measured on
- 34. Practice Question 1
- 35. Practice Question 2
- 37. Скачать презентацию

Chapter 1
What is Economics ?
Chapter 1
What is Economics ?
Overview
What is economics?
Definition, scarcity, and choice
The world of economics
Micro vs. Macro
Positive
Overview
What is economics?
Definition, scarcity, and choice
The world of economics
Micro vs. Macro
Positive
Economics, Scarcity, and Choice
Economics
Study of choice under conditions of scarcity
Scarcity
Situation in
Economics, Scarcity, and Choice
Economics
Study of choice under conditions of scarcity
Scarcity
Situation in
Scarcity and Individual Choice
Unlimited variety of scarcities, based on two basic
Scarcity and Individual Choice
Unlimited variety of scarcities, based on two basic
Scarcity and Individual Choice
Limitations force each of us to make choices
Economists
Scarcity and Individual Choice
Limitations force each of us to make choices
Economists
Scarcity and Social Choice
Society faces a scarcity of resources
Categories of resources:
Labor
Capital
Human
Scarcity and Social Choice
Society faces a scarcity of resources
Categories of resources:
Labor
Capital
Human
Scarcity and Economics
Problems studied in economics: the scarcity of resources—and the
Scarcity and Economics
Problems studied in economics: the scarcity of resources—and the
Scarcity and Economics
Economists study the decisions made by households, firms, and
Scarcity and Economics
Economists study the decisions made by households, firms, and
Microeconomics
Micro comes from the Greek word mikros, meaning “small”
Studies the behavior
Microeconomics
Micro comes from the Greek word mikros, meaning “small”
Studies the behavior
Macroeconomics
Macro comes from the Greek word makros, meaning “large”
Studies the behavior
Macroeconomics
Macro comes from the Greek word makros, meaning “large”
Studies the behavior
Positive and Normative Economics
Positive economics: how the economy works
Can be true
Positive and Normative Economics
Positive economics: how the economy works
Can be true
Why Economists Disagree
The difference of opinion may be positive in nature
Facts
Why Economists Disagree
The difference of opinion may be positive in nature
Facts
Why Study Economics
To understand the world better
Global events and personal phenomena
To
Why Study Economics
To understand the world better
Global events and personal phenomena
To
Why Study Economics
To help prepare for other careers
A wide range of
Why Study Economics
To help prepare for other careers
A wide range of
The Methods of Economics
Use economic models to develop economic theories
Economic models
The Methods of Economics
Use economic models to develop economic theories
Economic models
Economic Models: Assumptions and Conclusions
Two types of assumptions:
Simplifying assumptions
Essential features can
Economic Models: Assumptions and Conclusions
Two types of assumptions:
Simplifying assumptions
Essential features can

The Three Step Process
Economists follow the same three-step process to analyze
The Three Step Process
Economists follow the same three-step process to analyze
Math, Jargon, and Other Concerns…
Economic jargon
Special words that allow economists to
Math, Jargon, and Other Concerns…
Economic jargon
Special words that allow economists to
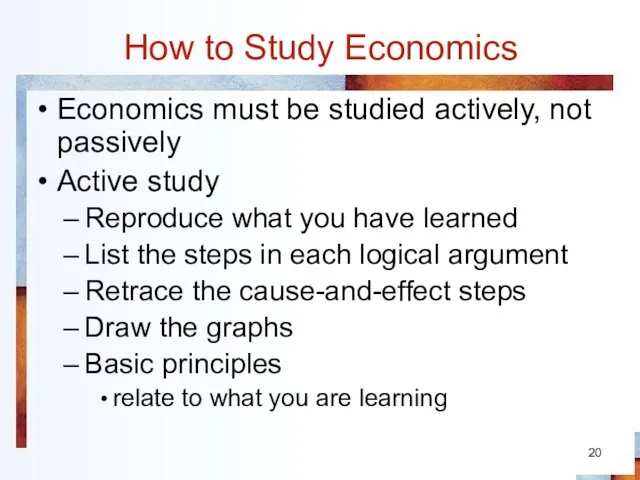
How to Study Economics
Economics must be studied actively, not passively
Active study
Reproduce
How to Study Economics
Economics must be studied actively, not passively
Active study
Reproduce
Math Review
Tables and graphs
Tables
Straight-line graphs
Curved lines
Linear equations
Lines and curves shift
Shifts vs.
Math Review
Tables and graphs
Tables
Straight-line graphs
Curved lines
Linear equations
Lines and curves shift
Shifts vs.
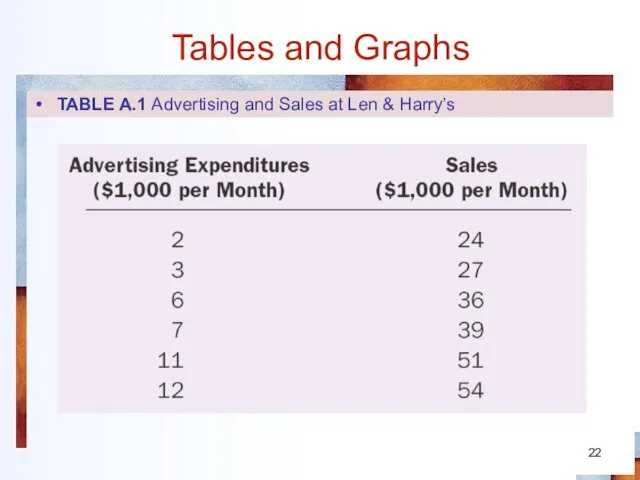
Tables and Graphs
TABLE A.1 Advertising and Sales at Len & Harry’s
Tables and Graphs
TABLE A.1 Advertising and Sales at Len & Harry’s
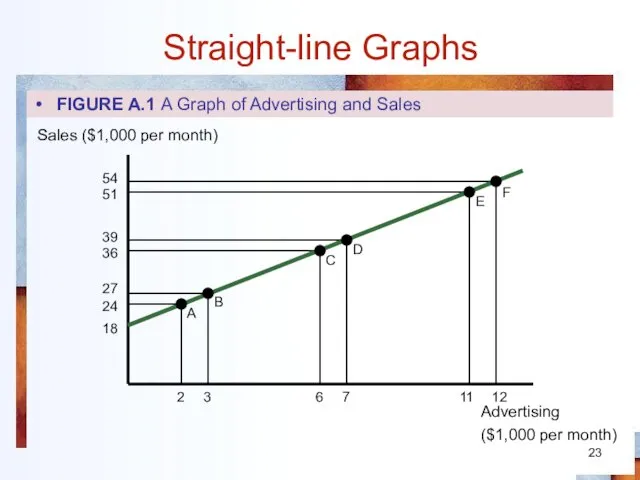
Straight-line Graphs
FIGURE A.1 A Graph of Advertising and Sales
Advertising
($1,000 per
Straight-line Graphs
FIGURE A.1 A Graph of Advertising and Sales
Advertising
($1,000 per
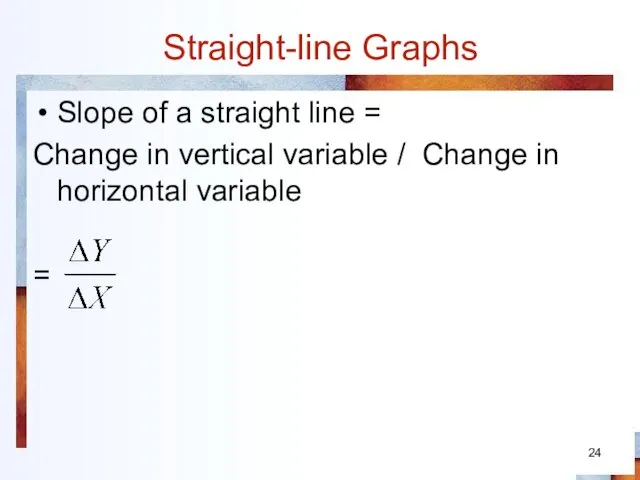
Straight-line Graphs
Slope of a straight line =
Change in vertical variable
Straight-line Graphs
Slope of a straight line =
Change in vertical variable
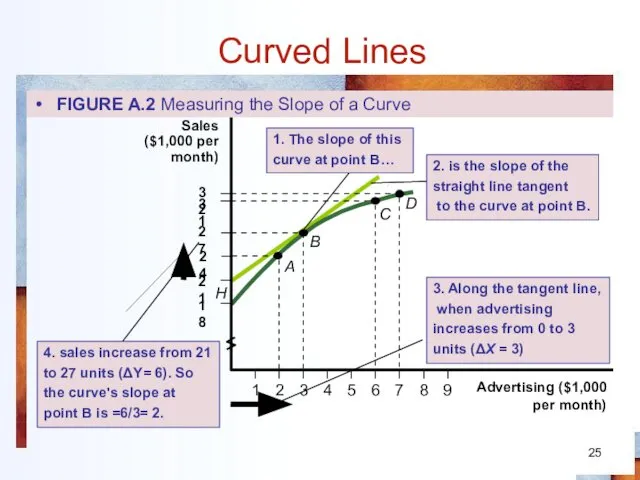
Curved Lines
FIGURE A.2 Measuring the Slope of a Curve
1. The slope
Curved Lines
FIGURE A.2 Measuring the Slope of a Curve
1. The slope
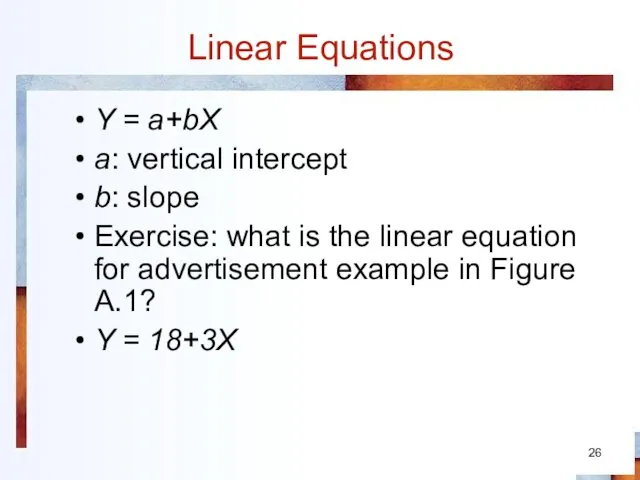
Linear Equations
Y = a+bX
a: vertical intercept
b: slope
Exercise: what is the linear
Linear Equations
Y = a+bX
a: vertical intercept
b: slope
Exercise: what is the linear
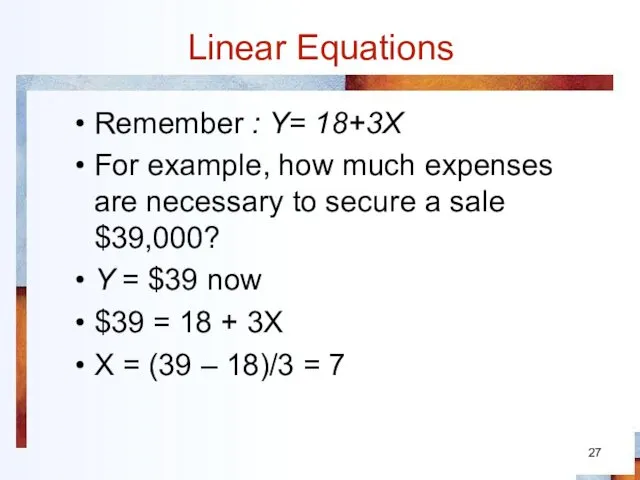
Linear Equations
Remember : Y= 18+3X
For example, how much expenses are
Linear Equations
Remember : Y= 18+3X
For example, how much expenses are
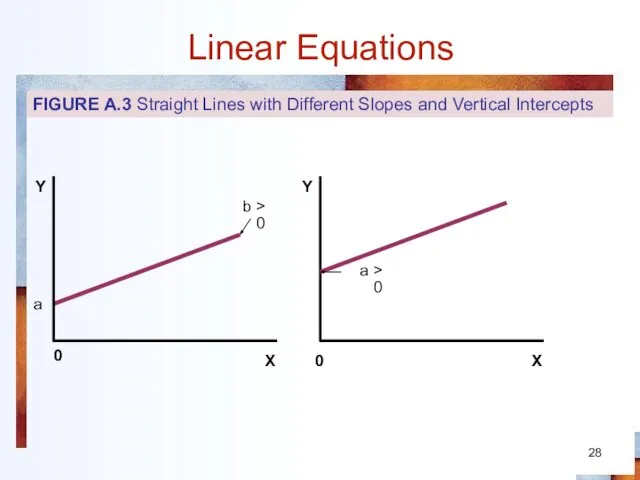
Linear Equations
0
a
b > 0
0
a > 0
FIGURE A.3 Straight Lines with Different
Linear Equations
0
a
b > 0
0
a > 0
FIGURE A.3 Straight Lines with Different
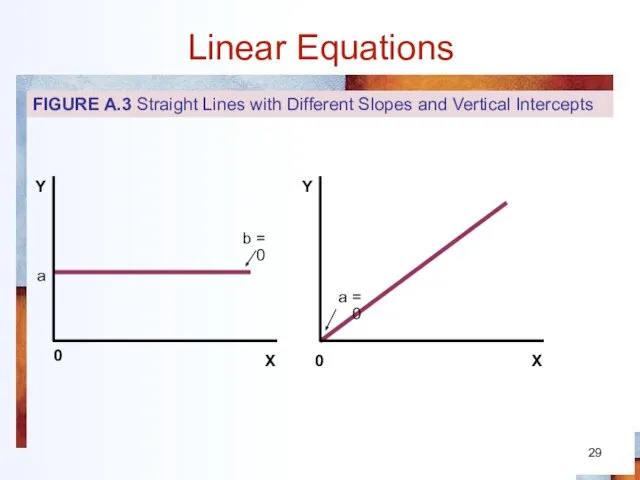
Linear Equations
0
a
b = 0
0
a = 0
FIGURE A.3 Straight Lines with Different
Linear Equations
0
a
b = 0
0
a = 0
FIGURE A.3 Straight Lines with Different

Linear Equations
0
a
b < 0
0
a < 0
FIGURE A.3 Straight Lines with Different
Linear Equations
0
a
b < 0
0
a < 0
FIGURE A.3 Straight Lines with Different
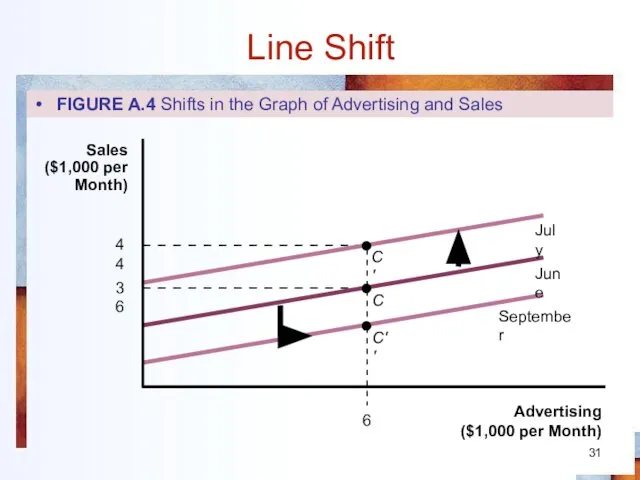
6
36
C''
C'
C
July
September
June
44
Line Shift
FIGURE A.4 Shifts in the Graph of Advertising and Sales
6
36
C''
C'
C
July
September
June
44
Line Shift
FIGURE A.4 Shifts in the Graph of Advertising and Sales
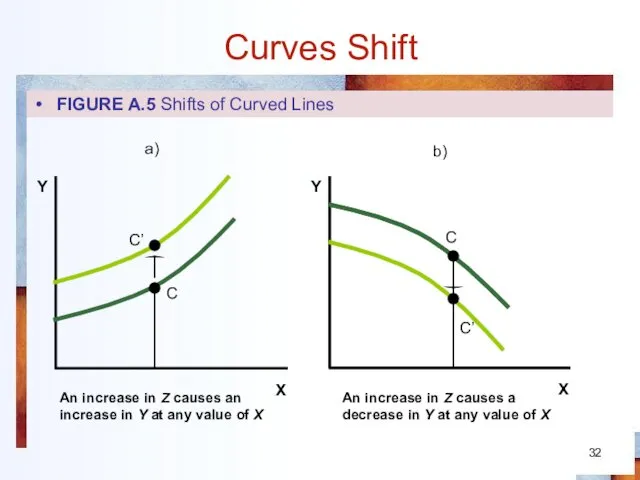
Curves Shift
FIGURE A.5 Shifts of Curved Lines
An increase in Z causes
Curves Shift
FIGURE A.5 Shifts of Curved Lines
An increase in Z causes
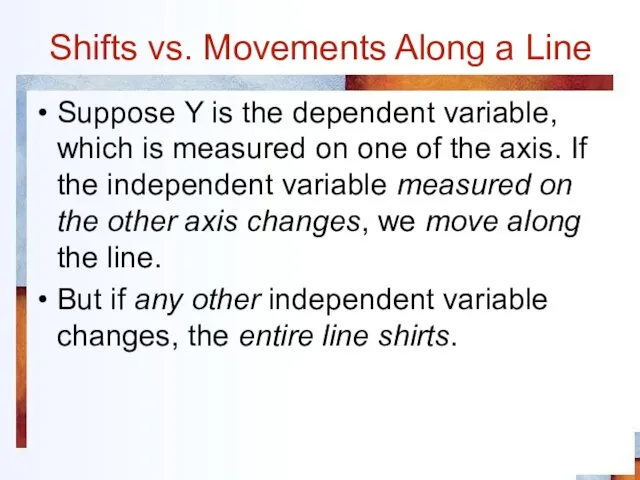
Shifts vs. Movements Along a Line
Suppose Y is the dependent variable,
Shifts vs. Movements Along a Line
Suppose Y is the dependent variable,
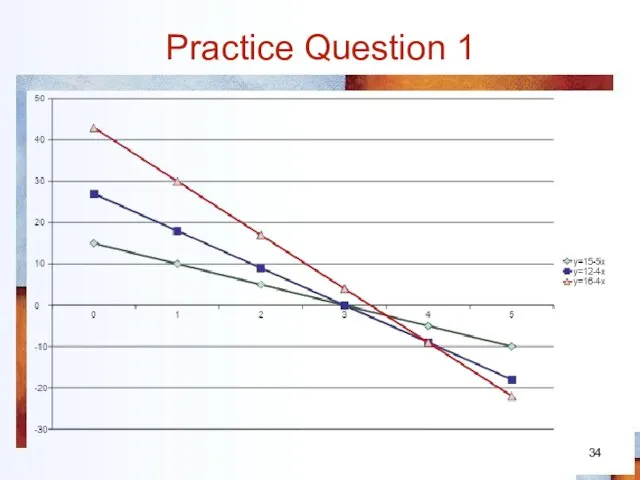
Practice Question 1
Practice Question 1
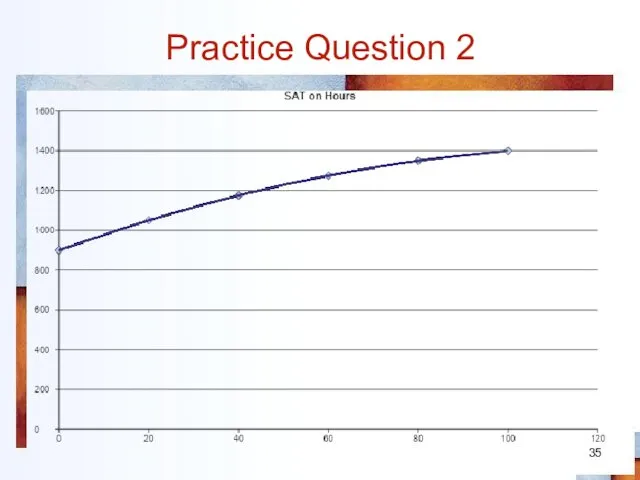
Practice Question 2
Practice Question 2
 Теоретические и методологические аспекты анализа международных процессов на региональном уровне
 Ряды динамики. Часть 3
 Экономика и её роль в жизни общества
 Презентация Международные отношения и Мировая политика
 Показатели эффективности проекта
 Economy system of Ukraine
 Импортный тариф в малой стране
 Производство – основа экономики
 Қазақстан Республикасында сыртқыэкономикалық іс-әрекетті ұйымдастыру. Тақырып 3
 Эффективность работы предприятия - комплексное многостороннее понятие
 Сущность четвертой технологической революции
 Экономическая эффективность отеля
 Халықаралық экономикалық қатынастар
 Эластичность спроса
 Индивидуальные инвестиционные cчета
 Законодательное регулирование закупочной деятельности в России. (Тема 1.1)
 Стратегия развития инвестиционной деятельности в Республике Казахстан
 Экономика общественного сектора. Функции государства. (Лекции 1-2)
 Проблемы роста в китайской экономике
 Модель Крафта-Вайзе
 Основные фонды предприятия. Понятие, состав и структура
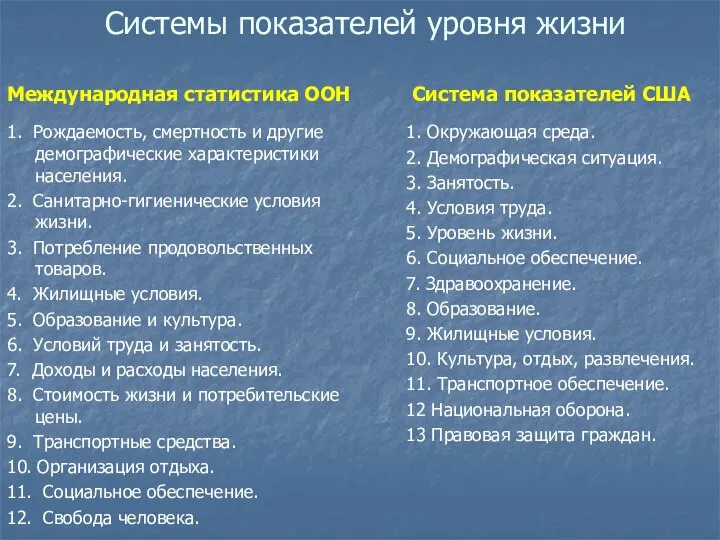 Системы показателей уровня жизни
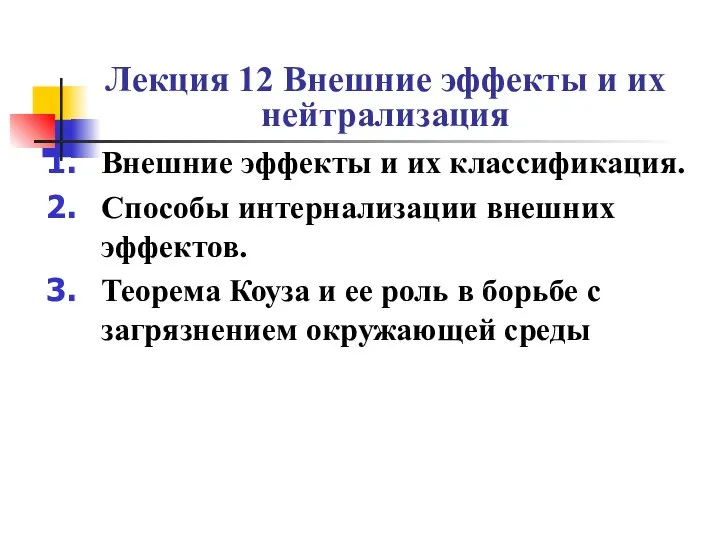 Внешние эффекты и их нейтрализация
 Анализ организации планирования трудоемкости производственной программы
 Презентация ФИНАНСОВОЕ ПРОГНОЗИРОВАНИЕ И ПЛАНИРОВАНИЕ
 Экономика и ее роль в жизни общества
 Монополист фирманың қылығы
 Рыночная экономика как объект воздействия права