- Market structure of production resources

Содержание
- 2. Topics: 1. General characteristics of the market of production resources. 2. Labor market and wages. 3.
- 3. References: A practical guide to seminars on economic theory. – M.: Vlados, 2016 .– 272 p.
- 4. Resource Demand As long as the additional revenue from employing another worker exceeds the additional cost,
- 5. Resource Supply Resource owners will supply their resources to the highest-paying alternative, other things equal Since
- 6. Demand and Supply of Resources Firms demand resources so as to maximize profit and households supply
- 7. Exhibit 1: Resource Market for Carpenters W 0 E Hours of labor per period D S
- 8. Market Demand for Resources Why do firms employ resources? Resources are used to produce goods and
- 9. Market Demand for Resources The market demand for a particular resource is the sum of demands
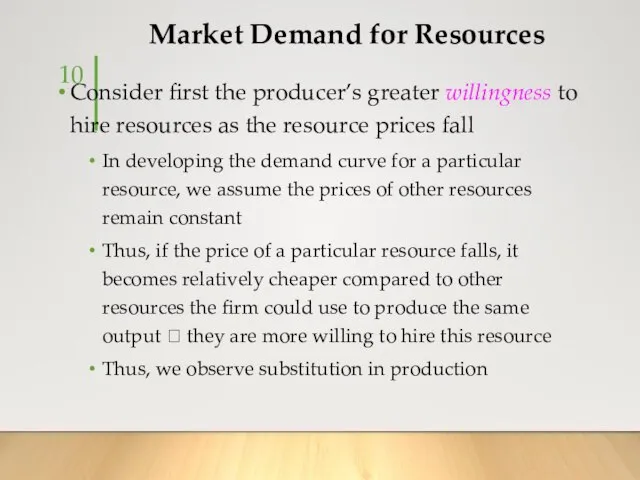
- 10. Market Demand for Resources Consider first the producer’s greater willingness to hire resources as the resource
- 11. Market Demand for Resources A lower price for a resource also increases a producer’s ability to
- 12. Market Supply for Resources The market supply curve of a resource sums all the individual supply
- 13. Market Supply for Resources Resource suppliers are more willing because a higher resource price, other things
- 14. Market Supply for Resources Resource supply curves also slope upward because resource owners are able to
- 15. Temporary and Permanent Resource Price Differences Resource owners have a strong interest in selling their resources
- 16. Exhibit 2: Market for Carpenters in Alternative Uses $25 (a) Home building Sh D h 0
- 17. Temporary Differences in Resource Prices Resource prices sometimes differ temporarily across markets because adjustment takes time
- 18. Permanent Differences in Resource Prices Not all resource price differences cause a reallocation of resources For
- 19. Summary Temporary price differences spark the movement of resources away from lower-paid uses toward higher-paid uses
- 20. Opportunity Cost and Economic Rent Recall that opportunity cost is what that resources could earn in
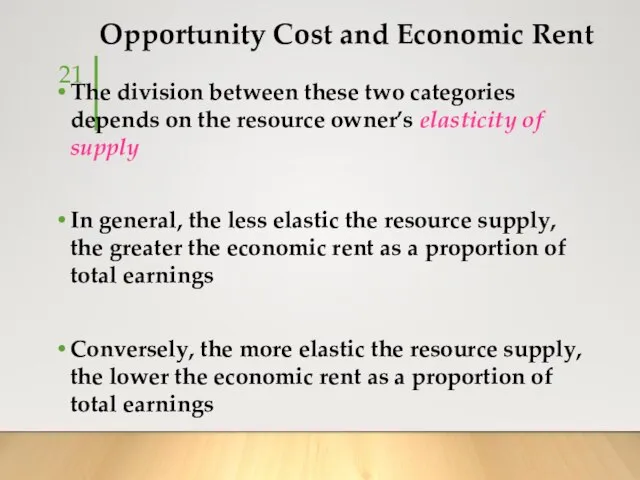
- 21. Opportunity Cost and Economic Rent The division between these two categories depends on the resource owner’s
- 22. All Earnings are Economic Rent If the supply of a resource to a particular market is
- 23. Exhibit 3: Opportunity Cost and Economic Rent D o l l a r s p e
- 24. D o l l a r s p e r u n i t $10 0
- 25. $10 5 0 5,000 10,000 Hours of labor per week Opportunity costs Economic rent S D
- 26. Summary Note that specialized resources tend to earn a higher proportion of economic rent than do
- 27. Closer Look at Resource Demand In our discussion of a firm’s costs, we varied the amount
- 28. Exhibit 4: Marginal Revenue Product Possible employment levels of the variable resource listed in column (1).
- 29. Marginal Revenue Product The important question is what happens to the firm’s revenue when additional workers
- 30. Marginal Revenue Product A resource’s marginal revenue product depends on How much additional output the resource
- 31. Selling Output as a Price Taker The calculation of marginal revenue product is simplest when the
- 32. Exhibit 4: Marginal Revenue Product Marginal revenue product is shown in the sixth column and is
- 33. Selling Output as a Price Maker If the firm has some market power over the price
- 34. Exhibit 5: Marginal Revenue Product for a Price Maker The marginal revenue product of labor, which
- 35. Marginal Resource Cost Marginal resource cost is the additional cost to the firm of employing one
- 36. Exhibit 6: Market Equilibrium For a Resource and the Firm’s Employment Decision $200 Workers per day
- 37. Resource Employment For all resources employed, the firm should hire additional units up to the level
- 38. Summary Maximum profit (or minimum loss) occurs where the marginal revenue from output equals its marginal
- 39. Shifts in the Demand for Resources A resource’s marginal revenue product consists of two components The
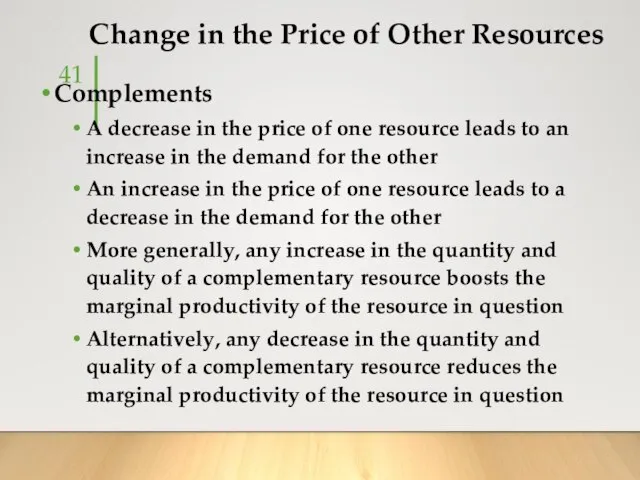
- 40. Change in the Price of Other Resources The marginal product of any resource depends on the
- 41. Change in the Price of Other Resources Complements A decrease in the price of one resource
- 42. Changes in Technology Technological improvements can boost the productivity of some resources but can make others
- 43. Change in the Demand for the Final Product Because the demand is derived from the demand
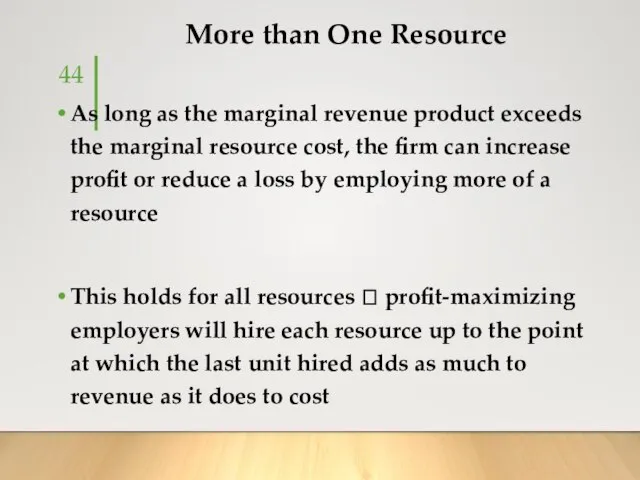
- 44. More than One Resource As long as the marginal revenue product exceeds the marginal resource cost,
- 46. Скачать презентацию

Topics:
1. General characteristics of the market of production resources.
2. Labor market
Topics:
1. General characteristics of the market of production resources.
2. Labor market
References:
A practical guide to seminars on economic theory. – M.: Vlados,
References:
A practical guide to seminars on economic theory. – M.: Vlados,
Resource Demand
As long as the additional revenue from employing another worker
Resource Demand
As long as the additional revenue from employing another worker

Resource Supply
Resource owners will supply their resources to the highest-paying alternative,
Resource Supply
Resource owners will supply their resources to the highest-paying alternative,

Demand and Supply of Resources
Firms demand resources so as to maximize
Demand and Supply of Resources
Firms demand resources so as to maximize

Exhibit 1: Resource Market for Carpenters
W
0
E
Hours of labor
Exhibit 1: Resource Market for Carpenters
W
0
E
Hours of labor
Market Demand for Resources
Why do firms employ resources?
Resources are used to
Market Demand for Resources
Why do firms employ resources?
Resources are used to
Market Demand for Resources
The market demand for a particular resource is
Market Demand for Resources
The market demand for a particular resource is
Market Demand for Resources
Consider first the producer’s greater willingness to hire
Market Demand for Resources
Consider first the producer’s greater willingness to hire

Market Demand for Resources
A lower price for a resource also increases
Market Demand for Resources
A lower price for a resource also increases

Market Supply for Resources
The market supply curve of a resource sums
Market Supply for Resources
The market supply curve of a resource sums

Market Supply for Resources
Resource suppliers are more willing because a higher
Market Supply for Resources
Resource suppliers are more willing because a higher

Market Supply for Resources
Resource supply curves also slope upward because resource
Market Supply for Resources
Resource supply curves also slope upward because resource

Temporary and Permanent Resource Price Differences
Resource owners have a strong interest
Temporary and Permanent Resource Price Differences
Resource owners have a strong interest
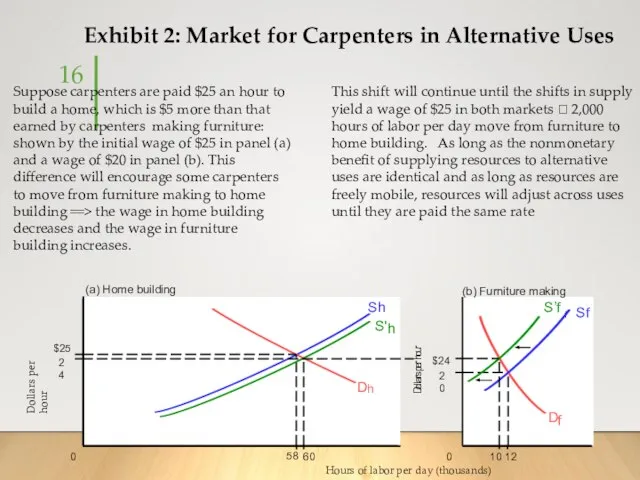
Exhibit 2: Market for Carpenters in Alternative Uses
$25
(a) Home building
Sh
D
h
0
Hours
Exhibit 2: Market for Carpenters in Alternative Uses
$25
(a) Home building
Sh
D
h
0
Hours
Temporary Differences in Resource Prices
Resource prices sometimes differ temporarily across markets
Temporary Differences in Resource Prices
Resource prices sometimes differ temporarily across markets

Permanent Differences in Resource Prices
Not all resource price differences cause a
Permanent Differences in Resource Prices
Not all resource price differences cause a

Summary
Temporary price differences spark the movement of resources away from lower-paid
Summary
Temporary price differences spark the movement of resources away from lower-paid

Opportunity Cost and Economic Rent
Recall that opportunity cost is what that
Opportunity Cost and Economic Rent
Recall that opportunity cost is what that
Opportunity Cost and Economic Rent
The division between these two categories depends
Opportunity Cost and Economic Rent
The division between these two categories depends

All Earnings are Economic Rent
If the supply of a resource to
All Earnings are Economic Rent
If the supply of a resource to

Exhibit 3: Opportunity Cost and Economic Rent
D
o
l
l
a
r
s
p
e
r
u
n
i
t
$1
0 10
Exhibit 3: Opportunity Cost and Economic Rent
D
o
l
l
a
r
s
p
e
r
u
n
i
t
$1
0 10

D
o
l
l
a
r
s
p
e
r
u
n
i
t
$10
0 1,000
S
D
Opportunity
costs
Hours of
labor per week
At the
D
o
l
l
a
r
s
p
e
r
u
n
i
t
$10
0 1,000
S
D
Opportunity
costs
Hours of
labor per week
At the

$10
5
0 5,000 10,000
Hours of labor
per week
Opportunity
costs
Economic
rent
S
D
D
o
l
l
a
r
s
p
e
r
$10
5
0 5,000 10,000
Hours of labor
per week
Opportunity
costs
Economic
rent
S
D
D
o
l
l
a
r
s
p
e
r

Summary
Note that specialized resources tend to earn a higher proportion of
Summary
Note that specialized resources tend to earn a higher proportion of

Closer Look at Resource Demand
In our discussion of a firm’s costs,
Closer Look at Resource Demand
In our discussion of a firm’s costs,

Exhibit 4: Marginal Revenue Product
Possible employment levels of the variable resource
Exhibit 4: Marginal Revenue Product
Possible employment levels of the variable resource

Marginal Revenue Product
The important question is what happens to the firm’s
Marginal Revenue Product
The important question is what happens to the firm’s

Marginal Revenue Product
A resource’s marginal revenue product depends on
How much additional
Marginal Revenue Product
A resource’s marginal revenue product depends on
How much additional

Selling Output as a Price Taker
The calculation of marginal revenue product
Selling Output as a Price Taker
The calculation of marginal revenue product
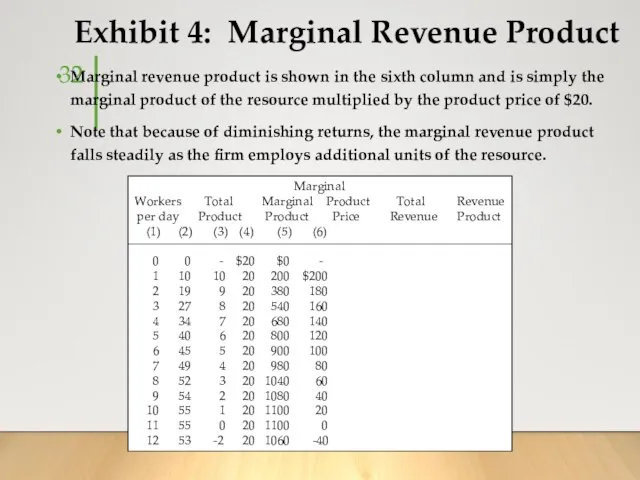
Exhibit 4: Marginal Revenue Product
Marginal revenue product is shown in the
Exhibit 4: Marginal Revenue Product
Marginal revenue product is shown in the
Selling Output as a Price Maker
If the firm has some market
Selling Output as a Price Maker
If the firm has some market

Exhibit 5: Marginal Revenue Product for a Price Maker
The marginal revenue
Exhibit 5: Marginal Revenue Product for a Price Maker
The marginal revenue

Marginal Resource Cost
Marginal resource cost is the additional cost to the
Marginal Resource Cost
Marginal resource cost is the additional cost to the

Exhibit 6: Market Equilibrium For a Resource
and the Firm’s Employment Decision
$200
Exhibit 6: Market Equilibrium For a Resource
and the Firm’s Employment Decision
$200
Resource Employment
For all resources employed, the firm should hire additional
Resource Employment
For all resources employed, the firm should hire additional
Summary
Maximum profit (or minimum loss) occurs where the marginal revenue from
Summary
Maximum profit (or minimum loss) occurs where the marginal revenue from

Shifts in the Demand for Resources
A resource’s marginal revenue product consists
Shifts in the Demand for Resources
A resource’s marginal revenue product consists

Change in the Price of Other Resources
The marginal product of any
Change in the Price of Other Resources
The marginal product of any
Change in the Price of Other Resources
Complements
A decrease in the price
Change in the Price of Other Resources
Complements
A decrease in the price

Changes in Technology
Technological improvements can boost the productivity of some resources
Changes in Technology
Technological improvements can boost the productivity of some resources

Change in the Demand for the Final Product
Because the demand is
Change in the Demand for the Final Product
Because the demand is
More than One Resource
As long as the marginal revenue product exceeds
More than One Resource
As long as the marginal revenue product exceeds
 Презентация Категорический силлогизм
 Основополагающие принципы налогообложения
 Введение в экономику. Проблемы экономической организации общества
 Наука гнома Эконома
 Понятие экономики
 Презентация урока по дисциплине «Основы менеджмента
 Человек и экономика
 Основания применения особого порядка принятия судебного решения Выполнили: Дамаева К., Мукебенова Л.
 Экономический рост. Цикличность экономического развития
 Popyt turystyczny
 Просмотр накладных «в пути» и оприходование товара на свой склад. Просмотр остатков товара на складе.
 Макроекономічне програмування та планування в системі державного регулювання економіки (Тема 3.2)
 Современная конъюнктура мирового товарного рынка
 Об экономном расходовании энергоресурсов
 Консультационная деятельность МБУ ИКЦ «Янаул Информ» муниципального района Янаульский район РБ
 Презентация Принципы международно-правового регулирования социального обеспечения
  Как работает рынок: спрос и предложение. Экономика для школьников. Главы №№ 3 - 4
 Specificul determinării tarifelor la servicii
 Корпоративные производственные системы. Развитие производственных систем. Факторы и концепции
 Бюджет страны и бюджетно-налоговая политика. (Тема 7)
 Продукция республиканских товаропроизводителей в ассортименте социально значимой группы товаров в округах Башкортостана
 Методы и функции экономической теории
 Социальный капитал. Характеристика и роль развития в экономических субъектах
 Экономика. (10 класс, урок № 3)
 Экономические функции домохозяйства
 Оценка коммерческого потенциала Технологии
 Механизмы совместного предпринимательства: структура и инструменты
 Экономика родного края