- The basic concepts of the world economy

Содержание
- 2. Economic science levels Тимофеева А.А. 2017 © Positive Normative What is economics
- 3. Microeconomics Macroeconomics The world economics Тимофеева А.А. 2017 ©
- 4. The world economics The sum of all national economies in the world The aggregate of those
- 5. Тимофеева А.А. 2017 ©
- 6. 195 states, 72 dependent areas 1 billion in 1820 2 billion in 1930 3 billion in
- 7. Age structure: 0-14 years: 25% 15-24 years: 16.8% 25-54 years: 40.6% 55-64 years: 8.4% 65 years
- 8. Тимофеева А.А. 2017 ©
- 9. 2016 Ten largest urban agglomerations: 1.Tokyo (Japan) – 38001000; 2. Delhi (India) – 25703000; 3. Shanghai
- 10. Total: 510.072 million sq km Land: 148.94 million sq km Water: 361.132 million sq km Note:
- 11. World World GDP (purchasing power parity): $119.25 trillion (2016 est.) $115.97 trillion (2015est.) $115.47 trillion (2014
- 12. GDP - composition by sector: Agriculture: 6% Industry: 31% Services: 62% (2016 est.) Тимофеева А.А. 2017
- 13. International economic relations Resident a legal or natural person, registered or residing in this state Тимофеева
- 14. The forms of international economic relations International trade in goods and services; The international movement of
- 15. International trade in goods and services Exports: $16 trillion (2015) $15 trillion (2014) Exports - commodities:
- 16. Stock of direct foreign investment - abroad: $28.4 trillion (31 December 2016 est.) $26.2 trillion (31
- 17. labour migration Тимофеева А.А. 2017 © According to UN data, in 2015 the total number of
- 18. Тимофеева А.А. 2017 ©
- 19. International exchange of knowledge Тимофеева А.А. 2017 © Nonprofit forms • scientific and technical publications; •
- 20. Тимофеева А.А. 2017 © International exchange of knowledge On commercial bases • transfer on the terms
- 21. The international currency and settlement relations Тимофеева А.А. 2017 © 1) means of payment (national currency,
- 22. International market Domestic market National market International market World market Тимофеева А.А. 2017 ©
- 24. Скачать презентацию
Economic science
levels
Тимофеева А.А. 2017 ©
Positive
Normative
What is economics
Economic science
levels
Тимофеева А.А. 2017 ©
Positive
Normative
What is economics
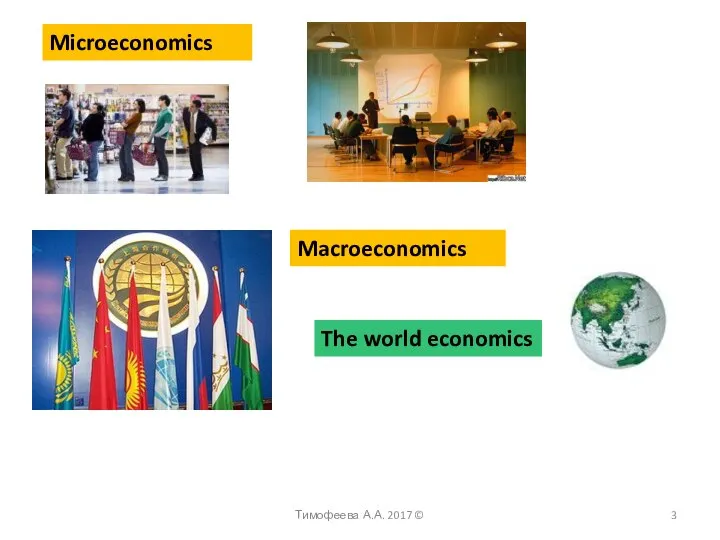
Microeconomics
Macroeconomics
The world economics
Тимофеева А.А. 2017 ©
Microeconomics
Macroeconomics
The world economics
Тимофеева А.А. 2017 ©
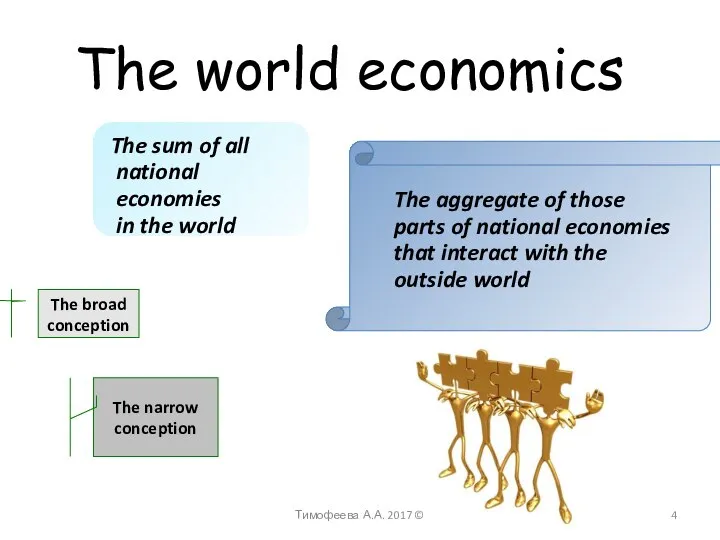
The world economics
The sum of all national economies in the
The world economics
The sum of all national economies in the

Тимофеева А.А. 2017 ©
Тимофеева А.А. 2017 ©
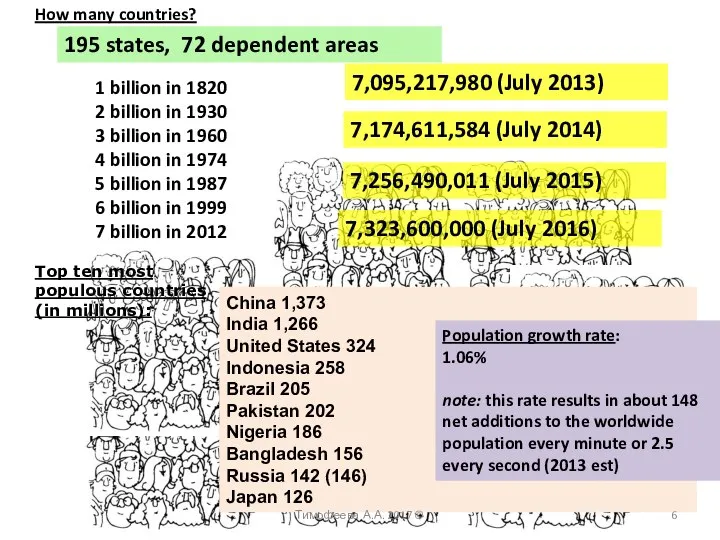
195 states, 72 dependent areas
1 billion in 1820
2 billion
195 states, 72 dependent areas
1 billion in 1820
2 billion
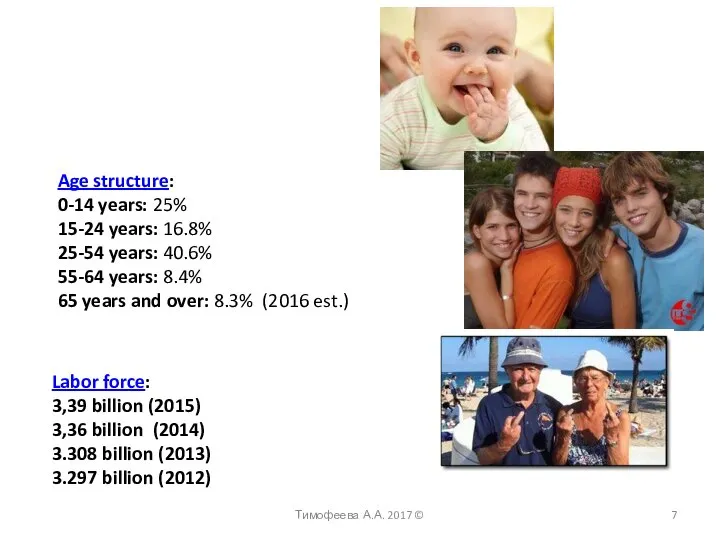
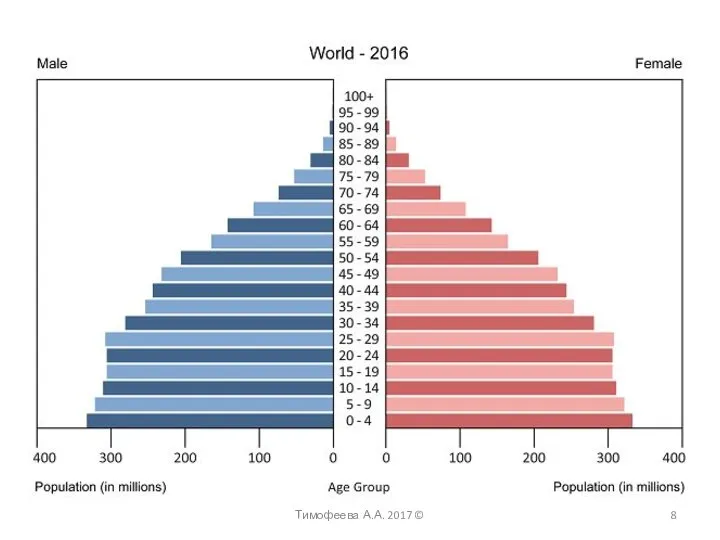
Age structure:
0-14 years: 25%
15-24 years: 16.8%
25-54 years: 40.6%
55-64 years: 8.4%
65 years and
Age structure:
0-14 years: 25%
15-24 years: 16.8%
25-54 years: 40.6%
55-64 years: 8.4%
65 years and
Тимофеева А.А. 2017 ©
Тимофеева А.А. 2017 ©
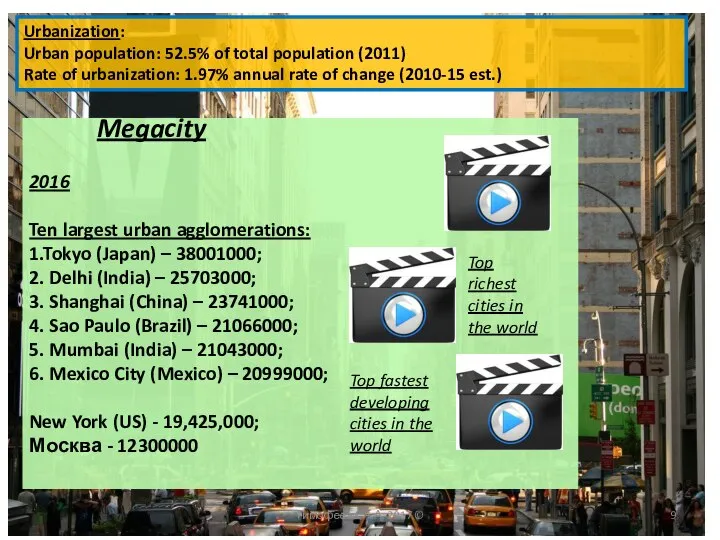
2016
Ten largest urban agglomerations:
1.Tokyo (Japan) – 38001000;
2. Delhi (India) –
Ten largest urban agglomerations:
1.Tokyo (Japan) – 38001000;
2. Delhi (India) –
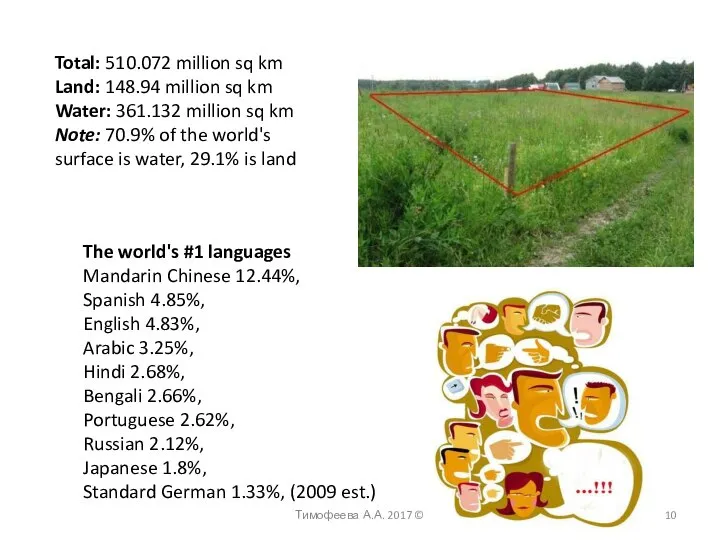
Total: 510.072 million sq km
Land: 148.94 million sq km
Water: 361.132 million sq km
Note: 70.9% of
Total: 510.072 million sq km
Land: 148.94 million sq km
Water: 361.132 million sq km
Note: 70.9% of
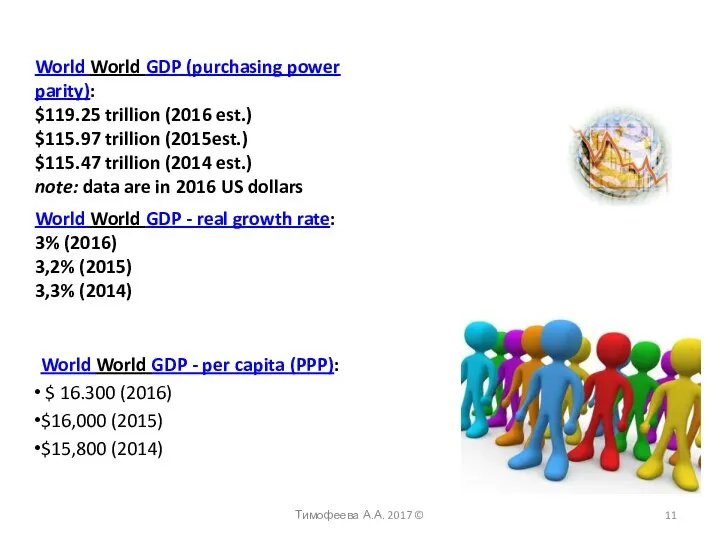
World World GDP (purchasing power parity):
$119.25 trillion (2016 est.)
$115.97 trillion (2015est.)
$115.47
World World GDP (purchasing power parity):
$119.25 trillion (2016 est.)
$115.97 trillion (2015est.)
$115.47
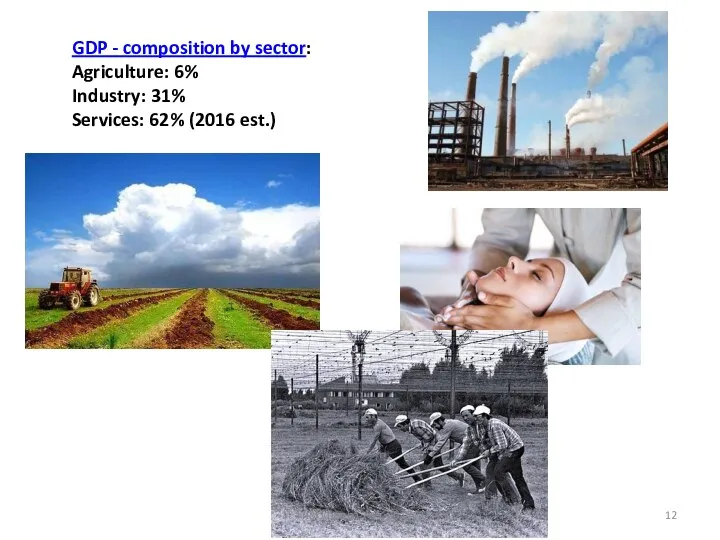
GDP - composition by sector:
Agriculture: 6%
Industry: 31%
Services: 62% (2016 est.)
Тимофеева А.А. 2017 ©
GDP - composition by sector:
Agriculture: 6%
Industry: 31%
Services: 62% (2016 est.)
Тимофеева А.А. 2017 ©
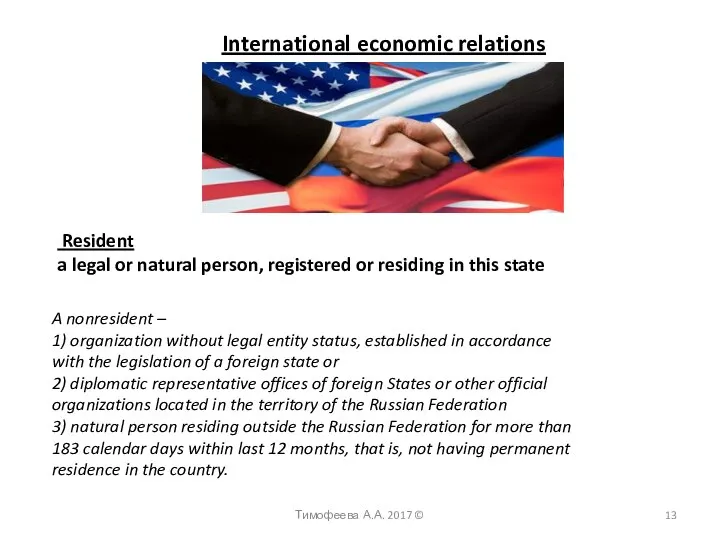
International economic relations
Resident
a legal or natural person, registered or residing
International economic relations
Resident a legal or natural person, registered or residing
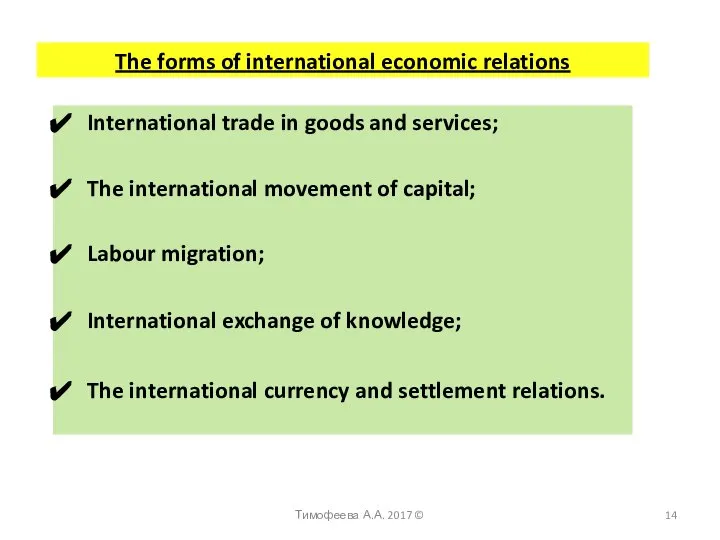
The forms of international economic relations
International trade in goods and services;
The
The forms of international economic relations
International trade in goods and services;
The
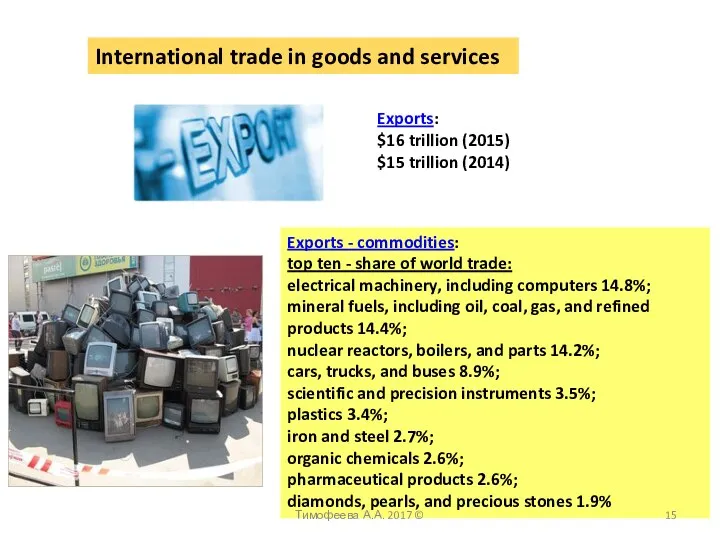
International trade in goods and services
Exports:
$16 trillion (2015)
$15 trillion (2014)
Exports -
International trade in goods and services
Exports:
$16 trillion (2015)
$15 trillion (2014)
Exports -
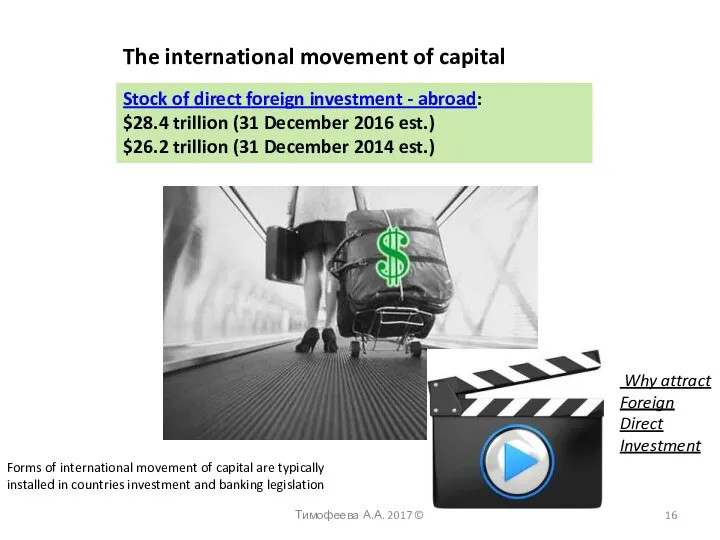
Stock of direct foreign investment - abroad:
$28.4 trillion (31 December 2016
Stock of direct foreign investment - abroad:
$28.4 trillion (31 December 2016
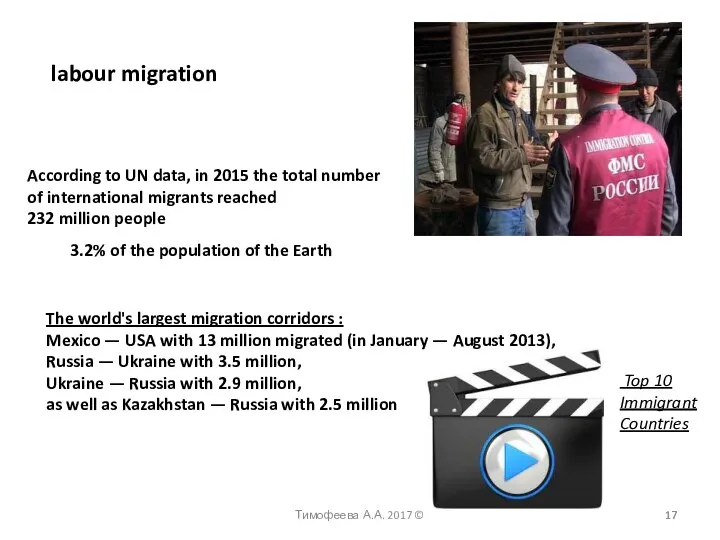
labour migration
Тимофеева А.А. 2017 ©
According to UN data, in 2015 the
labour migration
Тимофеева А.А. 2017 ©
According to UN data, in 2015 the
Тимофеева А.А. 2017 ©
Тимофеева А.А. 2017 ©
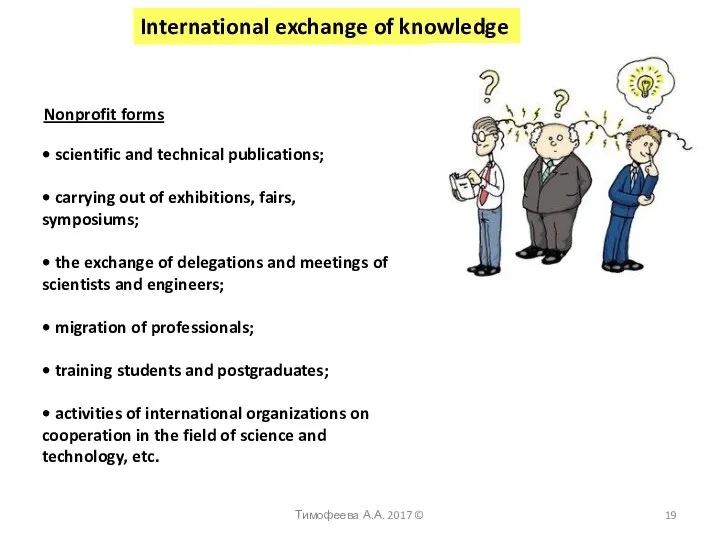
International exchange of knowledge
Тимофеева А.А. 2017 ©
Nonprofit forms
• scientific and technical
International exchange of knowledge
Тимофеева А.А. 2017 ©
Nonprofit forms
• scientific and technical
Тимофеева А.А. 2017 ©
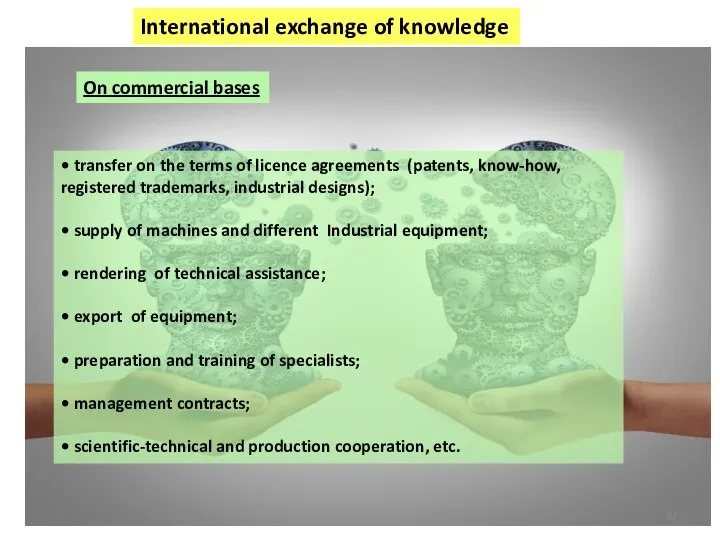
International exchange of knowledge
On commercial bases
• transfer on
Тимофеева А.А. 2017 ©
International exchange of knowledge
On commercial bases
• transfer on
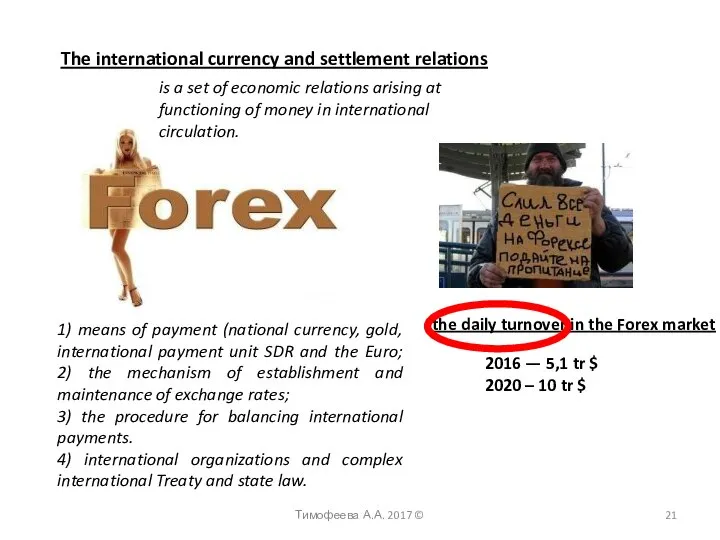
The international currency and settlement relations
Тимофеева А.А. 2017 ©
1) means
The international currency and settlement relations
Тимофеева А.А. 2017 ©
1) means
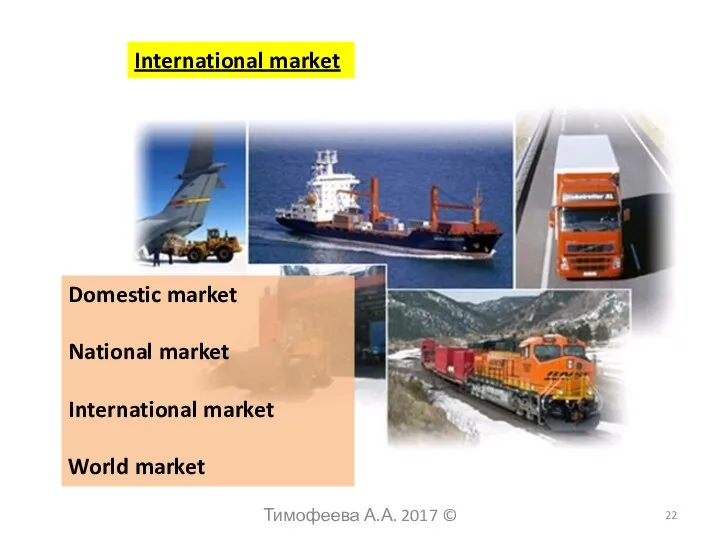
International market
Domestic market
National market
International market
World market
Тимофеева А.А. 2017 ©
International market
Domestic market
National market
International market
World market
Тимофеева А.А. 2017 ©
 Теория инноватики и ее современные концепции. (Тема 2)
 Стратегия формирования экономической безопасности
 Теория производства. Понятие изоквант, производственные множества и технологическая эффективность. (Лекция 9)
 Особенности трудовой этики индустриального общества
 Утечка мозгов как институт воспроизводства человеческого капитала
 Макроэкономическая нестабильность. Цикличность экономического развития
 Основні засоби підприємства. (Лекція 6)
 Сұраныс пен ұсыныс
 Теория Е и О организационных изменений М. Бира и Н. Нория
 Роль государства в экономике
 Проблемы стратегического планирования социально-экономического развития России
 Бюджет моей семьи
 Анализ трудовых ресурсов
 Государственное регулирование инновационной деятельности
 Введение в управленческую экономику
 Собівартість автомобільних перевезень та фактори, що її обумовлюють
 Экономическая модель взаимосвязи себестоимости продукции и факторов: объема реализации продукции, ее структуры
 Прогноз развития крупнейшего города: конструирование будущего
 Безработица. Население и рабочая сила. Измерение безработицы. Виды безработицы. Закон Оукена
 Экономические циклы. (Тема 3)
 Зеленая экономика в Казахстане
 Управление развитием национальной системы образования в Беларуси в условиях цифровой экономики
 Презентация Свободные экономические зоны
 Префектура Акита
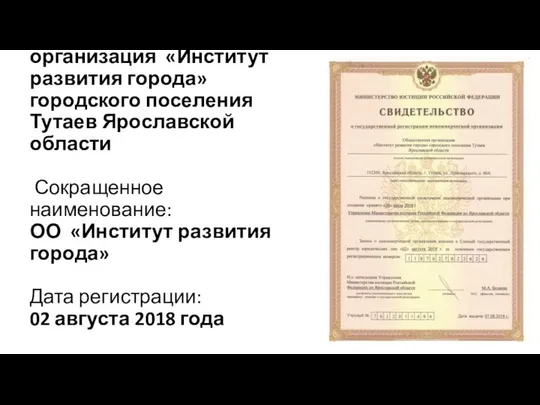 Общественная организация «Институт развития города» городского поселения Тутаев Ярославской области
 Экономическая деятельность и ее измерители
 Престижность рабочих мест и конкуренция между наемными работниками в современной России
 Джон Стюарт Милль