- The Market Forces of Supply and Demand

Содержание
- 2. The Market Forces of Supply and Demand
- 3. Supply and demand are the two words that economists use most often. Supply and demand are
- 4. A market is a group of buyers and sellers of a particular good or service. The
- 5. MARKETS AND COMPETITION Buyers determine demand. Sellers determine supply
- 6. Competitive Markets A competitive market is a market in which there are many buyers and sellers
- 7. Perfect Competition Products are the same Numerous buyers and sellers so that each has no influence
- 8. Oligopoly Few sellers Not always aggressive competition Monopolistic Competition Many sellers Slightly differentiated products Each seller
- 9. DEMAND Quantity demanded is the amount of a good that buyers are willing and able to
- 10. The Demand Curve: The Relationship between Price and Quantity Demanded Demand Schedule The demand schedule is
- 11. Catherine’s Demand Schedule
- 12. The Demand Curve: The Relationship between Price and Quantity Demanded Demand Curve The demand curve is
- 13. Figure 1 Catherine’s Demand Schedule and Demand Curve Copyright © 2004 South-Western Price of Ice-Cream Cone
- 14. Market Demand versus Individual Demand Market demand refers to the sum of all individual demands for
- 15. Shifts in the Demand Curve Change in Quantity Demanded Movement along the demand curve. Caused by
- 16. 0 D Price of Ice-Cream Cones Quantity of Ice-Cream Cones A tax that raises the price
- 17. Shifts in the Demand Curve Consumer income Prices of related goods Tastes Expectations Number of buyers
- 18. Shifts in the Demand Curve Change in Demand A shift in the demand curve, either to
- 19. Figure 3 Shifts in the Demand Curve Copyright©2003 Southwestern/Thomson Learning Price of Ice-Cream Cone Quantity of
- 20. Shifts in the Demand Curve Consumer Income As income increases the demand for a normal good
- 21. $3.00 2.50 2.00 1.50 1.00 0.50 2 1 3 4 5 6 7 8 9 10
- 22. $3.00 2.50 2.00 1.50 1.00 0.50 2 1 3 4 5 6 7 8 9 10
- 23. Shifts in the Demand Curve Prices of Related Goods When a fall in the price of
- 24. Table 1 Variables That Influence Buyers Copyright©2004 South-Western
- 25. SUPPLY Quantity supplied is the amount of a good that sellers are willing and able to
- 26. The Supply Curve: The Relationship between Price and Quantity Supplied Supply Schedule The supply schedule is
- 27. Ben’s Supply Schedule
- 28. The Supply Curve: The Relationship between Price and Quantity Supplied Supply Curve The supply curve is
- 29. Figure 5 Ben’s Supply Schedule and Supply Curve Copyright©2003 Southwestern/Thomson Learning Price of Ice-Cream Cone 0
- 30. Market Supply versus Individual Supply Market supply refers to the sum of all individual supplies for
- 31. Shifts in the Supply Curve Input prices Technology Expectations Number of sellers
- 32. Shifts in the Supply Curve Change in Quantity Supplied Movement along the supply curve. Caused by
- 33. 1 5 Price of Ice-Cream Cone Quantity of Ice-Cream Cones 0 S 1.00 A C A
- 34. Shifts in the Supply Curve Change in Supply A shift in the supply curve, either to
- 35. Figure 7 Shifts in the Supply Curve Copyright©2003 Southwestern/Thomson Learning Price of Ice-Cream Cone Quantity of
- 36. Table 2 Variables That Influence Sellers Copyright©2004 South-Western
- 37. SUPPLY AND DEMAND TOGETHER Equilibrium refers to a situation in which the price has reached the
- 38. SUPPLY AND DEMAND TOGETHER Equilibrium Price The price that balances quantity supplied and quantity demanded. On
- 39. At $2.00, the quantity demanded is equal to the quantity supplied! SUPPLY AND DEMAND TOGETHER Demand
- 40. Figure 8 The Equilibrium of Supply and Demand Copyright©2003 Southwestern/Thomson Learning Price of Ice-Cream Cone 0
- 41. Figure 9 Markets Not in Equilibrium Copyright©2003 Southwestern/Thomson Learning Price of Ice-Cream Cone 0 (a) Excess
- 42. Equilibrium Surplus When price > equilibrium price, then quantity supplied > quantity demanded. There is excess
- 43. Equilibrium Shortage When price the quantity supplied. There is excess demand or a shortage. Suppliers will
- 44. Figure 9 Markets Not in Equilibrium Copyright©2003 Southwestern/Thomson Learning Price of Ice-Cream Cone 0 Quantity of
- 45. Equilibrium Law of supply and demand The claim that the price of any good adjusts to
- 46. Three Steps to Analyzing Changes in Equilibrium Decide whether the event shifts the supply or demand
- 47. Figure 10 How an Increase in Demand Affects the Equilibrium Copyright©2003 Southwestern/Thomson Learning Price of Ice-Cream
- 48. Three Steps to Analyzing Changes in Equilibrium Shifts in Curves versus Movements along Curves A shift
- 49. Figure 11 How a Decrease in Supply Affects the Equilibrium Copyright©2003 Southwestern/Thomson Learning Price of Ice-Cream
- 50. Table 4 What Happens to Price and Quantity When Supply or Demand Shifts? Copyright©2004 South-Western
- 51. Summary Economists use the model of supply and demand to analyze competitive markets. In a competitive
- 52. Summary The demand curve shows how the quantity of a good depends upon the price. According
- 53. Summary The supply curve shows how the quantity of a good supplied depends upon the price.
- 54. Summary Market equilibrium is determined by the intersection of the supply and demand curves. At the
- 56. Скачать презентацию

The Market Forces of Supply and Demand
The Market Forces of Supply and Demand

Supply and demand are the two words that economists use most
Supply and demand are the two words that economists use most

A market is a group of buyers and sellers of a
A market is a group of buyers and sellers of a

MARKETS AND COMPETITION
Buyers determine demand.
Sellers determine supply
MARKETS AND COMPETITION
Buyers determine demand.
Sellers determine supply

Competitive Markets
A competitive market is a market in which there are
Competitive Markets
A competitive market is a market in which there are

Perfect Competition
Products are the same
Numerous buyers and sellers so that each
Perfect Competition
Products are the same
Numerous buyers and sellers so that each

Oligopoly
Few sellers
Not always aggressive competition
Monopolistic Competition
Many sellers
Slightly differentiated products
Each seller may
Oligopoly
Few sellers
Not always aggressive competition
Monopolistic Competition
Many sellers
Slightly differentiated products
Each seller may

DEMAND
Quantity demanded is the amount of a good that buyers are
DEMAND
Quantity demanded is the amount of a good that buyers are

The Demand Curve: The Relationship between Price and Quantity Demanded
Demand Schedule
The Demand Curve: The Relationship between Price and Quantity Demanded
Demand Schedule

Catherine’s Demand Schedule
Catherine’s Demand Schedule

The Demand Curve: The Relationship between Price and Quantity Demanded
Demand Curve
The Demand Curve: The Relationship between Price and Quantity Demanded
Demand Curve

Figure 1 Catherine’s Demand Schedule and Demand Curve
Copyright © 2004 South-Western
Price
Figure 1 Catherine’s Demand Schedule and Demand Curve
Copyright © 2004 South-Western
Price

Market Demand versus Individual Demand
Market demand refers to the sum of
Market Demand versus Individual Demand
Market demand refers to the sum of

Shifts in the Demand Curve
Change in Quantity Demanded
Movement along the demand
Shifts in the Demand Curve
Change in Quantity Demanded
Movement along the demand

0
D
Price of Ice-Cream
Cones
Quantity of Ice-Cream Cones
A tax that raises the
0
D
Price of Ice-Cream
Cones
Quantity of Ice-Cream Cones
A tax that raises the

Shifts in the Demand Curve
Consumer income
Prices of related goods
Tastes
Expectations
Number of buyers
Shifts in the Demand Curve
Consumer income
Prices of related goods
Tastes
Expectations
Number of buyers

Shifts in the Demand Curve
Change in Demand
A shift in the demand
Shifts in the Demand Curve
Change in Demand
A shift in the demand

Figure 3 Shifts in the Demand Curve
Copyright©2003 Southwestern/Thomson Learning
Price of
Ice-Cream
Cone
Quantity of
Ice-Cream
Figure 3 Shifts in the Demand Curve
Copyright©2003 Southwestern/Thomson Learning
Price of
Ice-Cream
Cone
Quantity of
Ice-Cream

Shifts in the Demand Curve
Consumer Income
As income increases the demand for
Shifts in the Demand Curve
Consumer Income
As income increases the demand for

$3.00
2.50
2.00
1.50
1.00
0.50
2
1
3
4
5
6
7
8
9
10
12
11
Price of Ice-Cream Cone
Quantity of Ice-Cream Cones
0
Increase
in demand
An increase in income...
D1
D2
Consumer
$3.00
2.50
2.00
1.50
1.00
0.50
2
1
3
4
5
6
7
8
9
10
12
11
Price of Ice-Cream Cone
Quantity of Ice-Cream Cones
0
Increase
in demand
An increase in income...
D1
D2
Consumer

$3.00
2.50
2.00
1.50
1.00
0.50
2
1
3
4
5
6
7
8
9
10
12
11
Price of Ice-Cream Cone
Quantity of Ice-Cream Cones
0
Decrease
in demand
An increase in income...
D1
D2
Consumer
$3.00
2.50
2.00
1.50
1.00
0.50
2
1
3
4
5
6
7
8
9
10
12
11
Price of Ice-Cream Cone
Quantity of Ice-Cream Cones
0
Decrease
in demand
An increase in income...
D1
D2
Consumer

Shifts in the Demand Curve
Prices of Related Goods
When a fall in
Shifts in the Demand Curve
Prices of Related Goods
When a fall in

Table 1 Variables That Influence Buyers
Copyright©2004 South-Western
Table 1 Variables That Influence Buyers
Copyright©2004 South-Western

SUPPLY
Quantity supplied is the amount of a good that sellers are
SUPPLY
Quantity supplied is the amount of a good that sellers are

The Supply Curve: The Relationship between Price and Quantity Supplied
Supply Schedule
The
The Supply Curve: The Relationship between Price and Quantity Supplied
Supply Schedule
The

Ben’s Supply Schedule
Ben’s Supply Schedule

The Supply Curve: The Relationship between Price and Quantity Supplied
Supply
The Supply Curve: The Relationship between Price and Quantity Supplied
Supply

Figure 5 Ben’s Supply Schedule and Supply Curve
Copyright©2003 Southwestern/Thomson Learning
Price of
Ice-Cream
Cone
0
2.50
2.00
1.50
1.00
1
2
3
4
5
6
7
8
9
10
11
Quantity
Figure 5 Ben’s Supply Schedule and Supply Curve
Copyright©2003 Southwestern/Thomson Learning
Price of
Ice-Cream
Cone
0
2.50
2.00
1.50
1.00
1
2
3
4
5
6
7
8
9
10
11
Quantity

Market Supply versus Individual Supply
Market supply refers to the sum of
Market Supply versus Individual Supply
Market supply refers to the sum of

Shifts in the Supply Curve
Input prices
Technology
Expectations
Number of sellers
Shifts in the Supply Curve
Input prices
Technology
Expectations
Number of sellers

Shifts in the Supply Curve
Change in Quantity Supplied
Movement along the supply
Shifts in the Supply Curve
Change in Quantity Supplied
Movement along the supply

1
5
Price of Ice-Cream Cone
Quantity of Ice-Cream Cones
0
S
1.00
A
C
A rise in
1
5
Price of Ice-Cream Cone
Quantity of Ice-Cream Cones
0
S
1.00
A
C
A rise in

Shifts in the Supply Curve
Change in Supply
A shift in the supply
Shifts in the Supply Curve
Change in Supply
A shift in the supply

Figure 7 Shifts in the Supply Curve
Copyright©2003 Southwestern/Thomson Learning
Price of
Ice-Cream
Cone
Quantity of
Ice-Cream
Figure 7 Shifts in the Supply Curve
Copyright©2003 Southwestern/Thomson Learning
Price of
Ice-Cream
Cone
Quantity of
Ice-Cream

Table 2 Variables That Influence Sellers
Copyright©2004 South-Western
Table 2 Variables That Influence Sellers
Copyright©2004 South-Western

SUPPLY AND DEMAND TOGETHER
Equilibrium refers to a situation in which the
SUPPLY AND DEMAND TOGETHER
Equilibrium refers to a situation in which the

SUPPLY AND DEMAND TOGETHER
Equilibrium Price
The price that balances quantity supplied and
SUPPLY AND DEMAND TOGETHER
Equilibrium Price
The price that balances quantity supplied and

At $2.00, the quantity demanded is equal to the quantity supplied!
SUPPLY
At $2.00, the quantity demanded is equal to the quantity supplied!
SUPPLY

Figure 8 The Equilibrium of Supply and Demand
Copyright©2003 Southwestern/Thomson Learning
Price of
Ice-Cream
Cone
0
1
2
3
4
5
6
7
8
9
10
11
12
Quantity
Figure 8 The Equilibrium of Supply and Demand
Copyright©2003 Southwestern/Thomson Learning
Price of
Ice-Cream
Cone
0
1
2
3
4
5
6
7
8
9
10
11
12
Quantity

Figure 9 Markets Not in Equilibrium
Copyright©2003 Southwestern/Thomson Learning
Price of
Ice-Cream
Cone
0
(a) Excess Supply
Quantity
Figure 9 Markets Not in Equilibrium
Copyright©2003 Southwestern/Thomson Learning
Price of
Ice-Cream
Cone
0
(a) Excess Supply
Quantity

Equilibrium
Surplus
When price > equilibrium price, then quantity supplied > quantity demanded.
Equilibrium
Surplus
When price > equilibrium price, then quantity supplied > quantity demanded.

Equilibrium
Shortage
When price < equilibrium price, then quantity demanded > the quantity
Equilibrium
Shortage
When price < equilibrium price, then quantity demanded > the quantity

Figure 9 Markets Not in Equilibrium
Copyright©2003 Southwestern/Thomson Learning
Price of
Ice-Cream
Cone
0
Quantity of
Ice-Cream
Cones
(b) Excess
Figure 9 Markets Not in Equilibrium
Copyright©2003 Southwestern/Thomson Learning
Price of
Ice-Cream
Cone
0
Quantity of
Ice-Cream
Cones
(b) Excess

Equilibrium
Law of supply and demand
The claim that the price of any
Equilibrium
Law of supply and demand
The claim that the price of any

Three Steps to Analyzing Changes in Equilibrium
Decide whether the event shifts
Three Steps to Analyzing Changes in Equilibrium
Decide whether the event shifts

Figure 10 How an Increase in Demand Affects the Equilibrium
Copyright©2003 Southwestern/Thomson
Figure 10 How an Increase in Demand Affects the Equilibrium
Copyright©2003 Southwestern/Thomson

Three Steps to Analyzing Changes in Equilibrium
Shifts in Curves versus
Three Steps to Analyzing Changes in Equilibrium
Shifts in Curves versus

Figure 11 How a Decrease in Supply Affects the Equilibrium
Copyright©2003 Southwestern/Thomson
Figure 11 How a Decrease in Supply Affects the Equilibrium
Copyright©2003 Southwestern/Thomson

Table 4 What Happens to Price and Quantity When Supply or
Table 4 What Happens to Price and Quantity When Supply or

Summary
Economists use the model of supply and demand to analyze competitive
Summary
Economists use the model of supply and demand to analyze competitive

Summary
The demand curve shows how the quantity of a good depends
Summary
The demand curve shows how the quantity of a good depends

Summary
The supply curve shows how the quantity of a good supplied
Summary
The supply curve shows how the quantity of a good supplied

Summary
Market equilibrium is determined by the intersection of the supply and
Summary
Market equilibrium is determined by the intersection of the supply and
 Экономика и управление. Адаптационный курс. Основы современного менеджмента
 Денежно-кредитная политика государства
 Основы рыночной экономики
 Тензорное и спинорное моделирование крупномасштабных объектов с заданными свойствами и переменной структурой
 Unsicherheit und Verbraucherverhalten
 Функции государства в экономике
 Производство - основа экономики
 Муниципальное образование, как субъект экономической деятельности. (Тема 9)
 Изменение объема спроса и предложения (подготовка к ЕГЭ по обществознанию)
 Макроекономіка як наука
 Рекомендація МОП № 204 щодо переходу від неформальної до формальної економіки до 2015 року
 Понятие, факторы и угрозы экономической безопасности
 Особенности работы брокера на зарубежном рынке
 Экономия по видам транспорта
 Cyclical economic development and economic growth
 Последствия безработицы. Государственная политика поддержки занятости. Понятие экономического роста
 Равновесие на рынке факторов производства при различных структурах товарного и факторного рынков
 Enerģētiskie resursi. Akmeņogles
 Экономические вопросы в ЕГЭ по обществознанию
 Понятие транснациональной корпорации (ТНК). Роль ТНК в мировой экономике
 Основные макроэкономические показатели. Система национальных счетов
 Основы теории рынков
 Регионы в формировании инновационного облика российской экономики
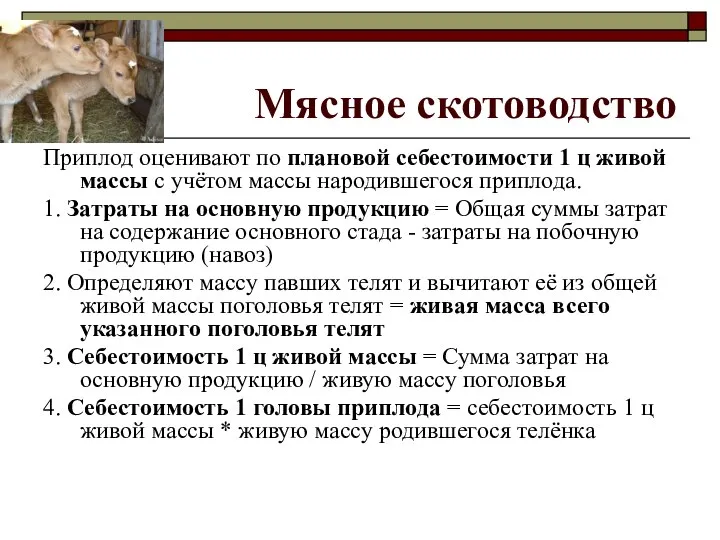 Мясное скотоводство
 Потребности и ресурсы. Проблема выбора в экономике (2)
 Азиатско-Тихоокеанское экономическое сотрудничество (история создания, цели, задачи, членство, структура, характер деятельности)
 Московская областная дума. Отчет о деятельности комитета по имущественным отношениям и землепользованию за 2017 год
 Трудовые ресурсы мирового хозяйства