- How indicators work

Содержание
- 2. Stay with us... Q & A at the end
- 3. Technical analysis is an analysis methodology for forecasting the direction of prices through the study of
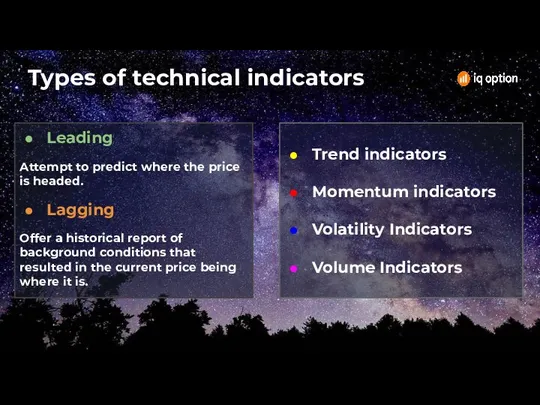
- 4. Trend indicators Momentum indicators Volatility Indicators Volume Indicators Leading Attempt to predict where the price is
- 5. Types of technical indicators Trend indicators Measure the direction and strength of a trend by comparing
- 6. First you may consider focusing the effects into the four categories of market research: trend, momentum,
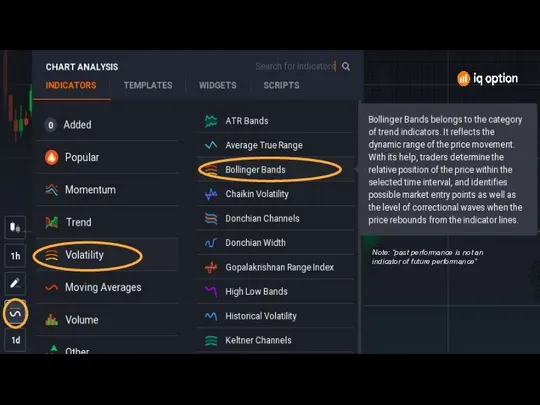
- 7. Note: “past performance is not an indicator of future performance”
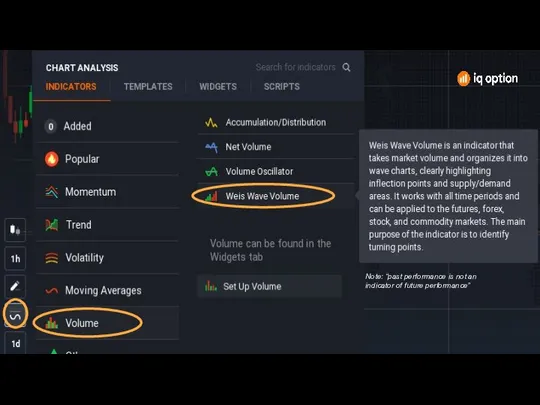
- 8. Note: “past performance is not an indicator of future performance”
- 9. Note: “past performance is not an indicator of future performance”
- 10. Note: “past performance is not an indicator of future performance”
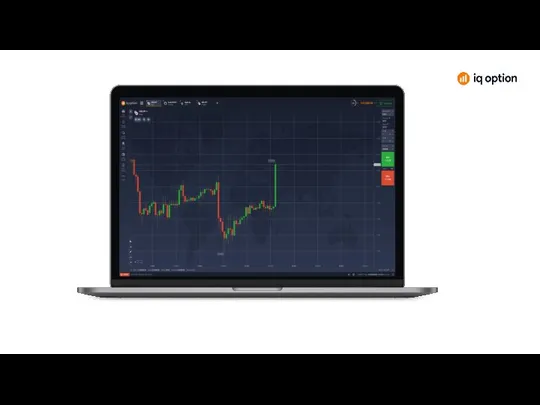
- 11. How it will look The RSI will show us if the asset is overbought or oversold
- 14. Скачать презентацию

Stay with us...
Q & A at the end
Stay with us...
Q & A at the end

Technical analysis is an analysis methodology for forecasting the direction of
Technical analysis is an analysis methodology for forecasting the direction of
Trend indicators
Momentum indicators
Volatility Indicators
Volume Indicators
Leading
Attempt to predict where the price is
Trend indicators
Momentum indicators
Volatility Indicators
Volume Indicators
Leading
Attempt to predict where the price is

Types of technical indicators
Trend indicators
Measure the direction and strength of a
Types of technical indicators
Trend indicators
Measure the direction and strength of a
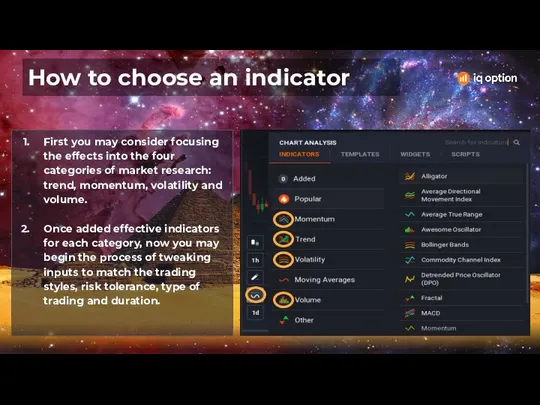
First you may consider focusing the effects into the four categories
First you may consider focusing the effects into the four categories

Note: “past performance is not an indicator of future performance”
Note: “past performance is not an indicator of future performance”

Note: “past performance is not an indicator of future performance”
Note: “past performance is not an indicator of future performance”
Note: “past performance is not an indicator of future performance”
Note: “past performance is not an indicator of future performance”
Note: “past performance is not an indicator of future performance”
Note: “past performance is not an indicator of future performance”

How it will look
The RSI will show us if the asset
How it will look
The RSI will show us if the asset
 Конструирование из кубиков
 Введение в Интернет
 Как создать ЭОР учителю с помощью некоторых сервисов: LearningApps.org, Prezi.com, Playcast, OnWebinar.ru, Moodle, Твой тест
 Указатели и работа с памятью
 Отношения объектов. Разновидности объектов и их классификация. (Урок 2)
 Катарсис и видеоигры
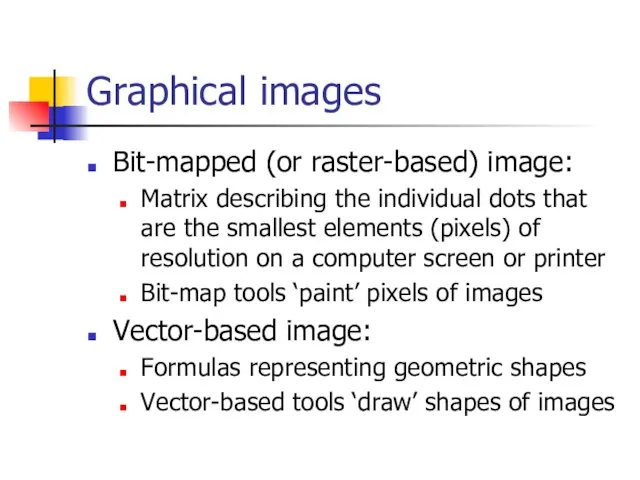 Graphical images
 Компьютерная графика и геометрическое моделирование
 Записи и файлы
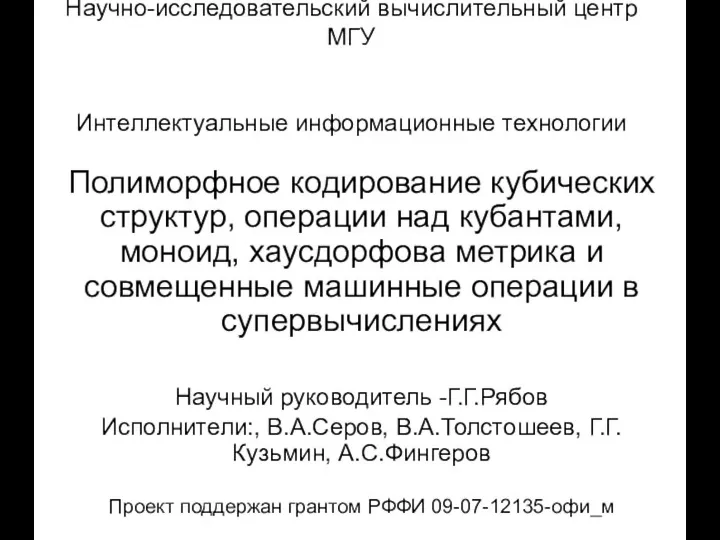 Научно-исследовательский вычислительный центр МГУ Интеллектуальные информационные технологии Полиморфное кодирование куб
 Информатика в играх и задачах. Основы логики. 2 класс (4 урок)
 Защита файлов и управление доступом к ним. Борисов В.А. Красноармейский филиал ГОУ ВПО «Академия народного хозяйства при Прави
 Стать программистом. Первый шаг
 Классификация видов моделирования систем
 Информационные каналы
 Устройство компьютера
 Разработка голосового помощника
 Управляющие конструкции
 Прикладное программное обеспечение информационных систем
 Tensilica Xtensa
 Hyper-V. Что такое Hyper-V?
 Воздействие анимации на пользовательский опыт в мобильных интерфейсах мобильного приложения для облачного хранения данных
 Производственная практика по информатике в отделе военного комиссариата Ростовской области по городу Батайску
 Системное программирование тема: Асинхронные вычисления. Семафор, монитор (Лекция 17)
 Подпрограммы
 Как не заскучать в онлайне?
 Введение в системы управления базами данных (СУБД) и основные возможности реляционной СУБД MySQL
 Бананы. Рекомендации по оформлению сайта