- Программирование (бағдарламалау) лекция 3

Содержание
- 2. Шартты оператор IF if выражение: инструкция_1 инструкция_2 ... инструкция_n
- 3. Конструкция if – else if выражение: инструкция_1 инструкция_2 ... инструкция_n else: инструкция_a инструкция_b ... инструкция_x
- 4. Конструкция if – elif – else if выражение_1: инструкции_(блок_1) elif выражение_2: инструкции_(блок_2) elif выражение_3: инструкции_(блок_3) else:
- 5. Example: a = int(input("введите число:")) if a print("Neg") elif a == 0: print("Zero") else: print("Pos")
- 6. Циклдік оператор WHILE while выражение: инструкция_1 инструкция_2 ... инструкция_n
- 7. a=0 while a print("A") a += 1 #Пример бесконечного цикла: a=0 while a == 0: print("A")
- 8. a = -1 while a a =a+1 if a>= 7: continue print("A") Continue операторы циклды қайтадан
- 9. break операторы while циклін мерзімінен бұрын тоқтату үшін қолданылады. a=0 while a >= 0: if a
- 10. Python-да график салу Matplotlib кітапханасын енгізу арқылы жүзеге асады: import matplotlib . pyplot as plt График
- 11. Уақытқа байланысты температураның өлшемін графикалық кескіндеу программасы: from matplotlib.pyplot import * x=[1, 2, 3, 4, 5,
- 12. Алдыңғы программалық кодты келесі түрде де жаза аламыз:
- 13. Sin(x) Функциясының графигін салу мысалы:
- 14. Алдыңғы кодқа өзгертулер енгізіп, функцияның графигін келесі түрде аламыз: import matplotlib . pyplot as plt import
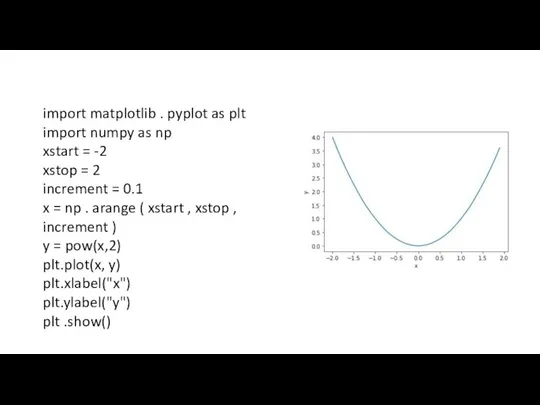
- 15. import matplotlib . pyplot as plt import numpy as np xstart = -2 xstop = 2
- 16. import matplotlib . pyplot as plt import numpy as np xstart = 0 xstop = 2*np.pi
- 17. Creating Subplots in Python Subplot(m,n,p)
- 18. import matplotlib.pyplot as plt # line 1 points x1 = [1,2,3] y1 = [2,4,1] # plotting
- 19. import matplotlib.pyplot as plt # x axis values x = [1,2,3,4,5,6] # corresponding y axis values
- 20. import matplotlib.pyplot as plt # x-coordinates of left sides of bars left = [1, 2, 3,
- 21. import matplotlib.pyplot as plt # frequencies ages = [2,5,70,40,30,45,50,45,43,40,44, 60,7,13,57,18,90,77,32,21,20,40] # setting the ranges and no.
- 22. import matplotlib.pyplot as plt # x-axis values x = [1,2,3,4,5,6,7,8,9,10] # y-axis values y = [2,4,5,7,6,8,9,11,12,12]
- 23. import matplotlib.pyplot as plt # defining labels activities = ['eat', 'sleep', 'work', 'play'] # portion covered
- 25. Скачать презентацию
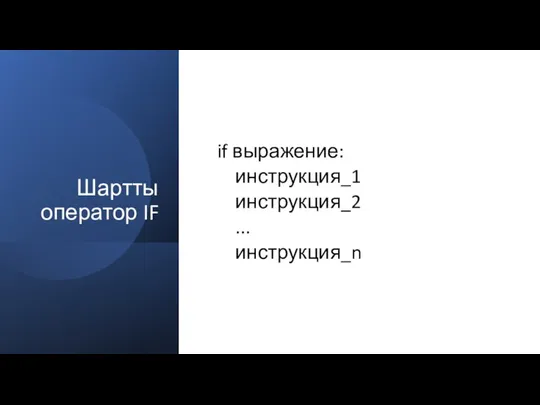
Шартты оператор IF
if выражение:
инструкция_1
инструкция_2
...
Шартты оператор IF
if выражение:
инструкция_1
инструкция_2
...
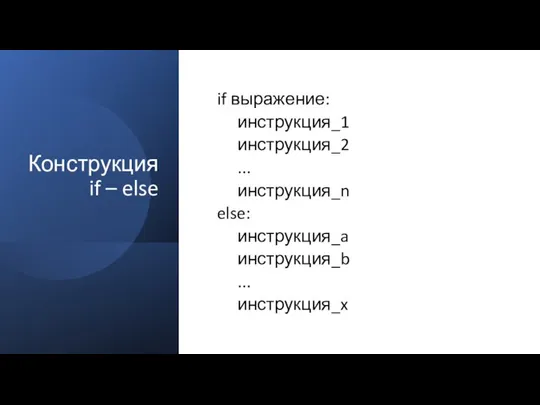
Конструкция if – else
if выражение:
инструкция_1
инструкция_2
Конструкция if – else
if выражение:
инструкция_1
инструкция_2
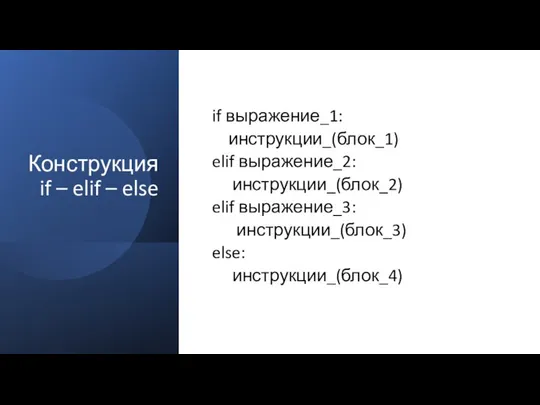
Конструкция if – elif – else
if выражение_1:
инструкции_(блок_1)
elif
Конструкция if – elif – else
if выражение_1:
инструкции_(блок_1)
elif
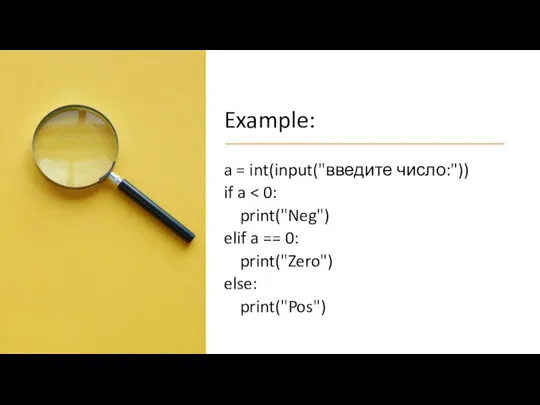
Example:
a = int(input("введите число:"))
if a < 0:
print("Neg")
elif
Example:
a = int(input("введите число:"))
if a < 0:
print("Neg")
elif
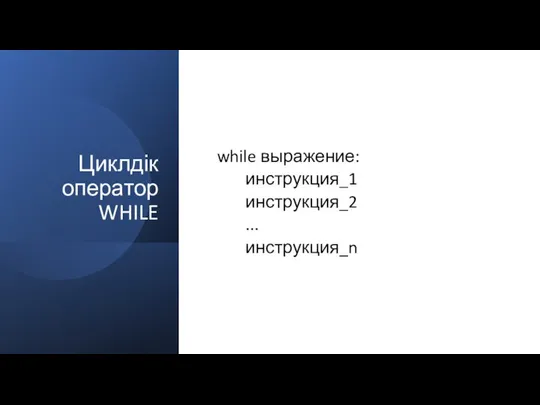
Циклдік оператор WHILE
while выражение:
инструкция_1
инструкция_2
...
Циклдік оператор WHILE
while выражение:
инструкция_1
инструкция_2
...
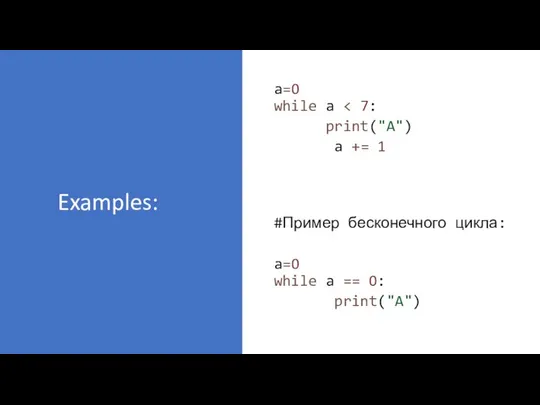
a=0
while a < 7:
print("A")
a += 1
#Пример
a=0
while a < 7:
print("A")
a += 1
#Пример
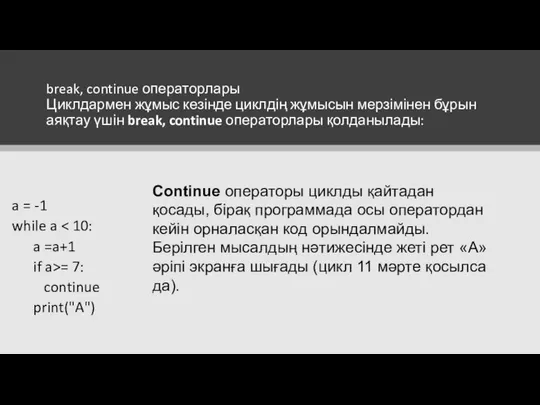
a = -1
while a < 10:
a =a+1
if a>=
a = -1
while a < 10:
a =a+1
if a>=
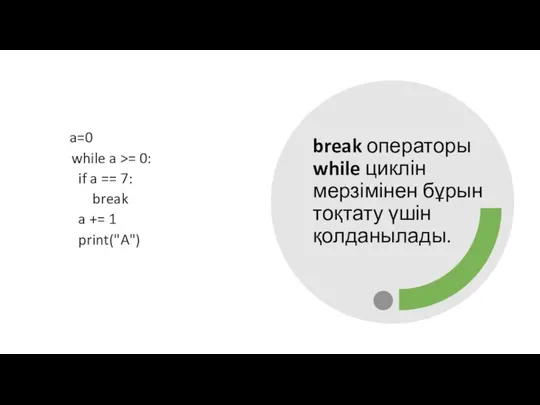
break операторы while циклін мерзімінен бұрын тоқтату үшін қолданылады.
a=0
break операторы while циклін мерзімінен бұрын тоқтату үшін қолданылады.
a=0
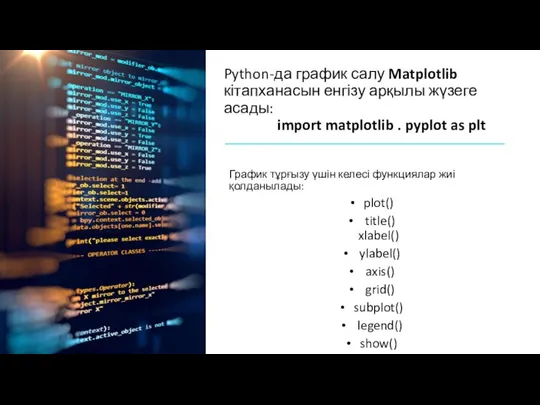
Python-да график салу Matplotlib кітапханасын енгізу арқылы жүзеге асады: import matplotlib
Python-да график салу Matplotlib кітапханасын енгізу арқылы жүзеге асады: import matplotlib
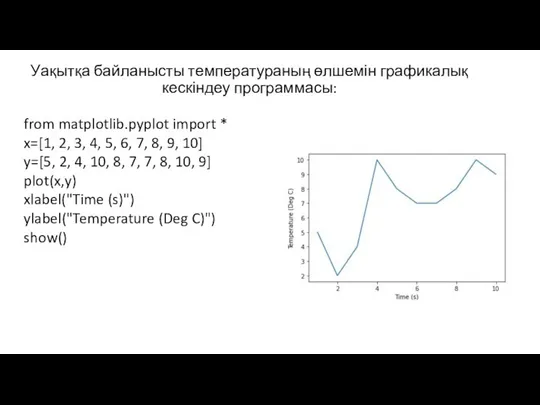
Уақытқа байланысты температураның өлшемін графикалық кескіндеу программасы:
from matplotlib.pyplot import *
x=[1, 2,
Уақытқа байланысты температураның өлшемін графикалық кескіндеу программасы:
from matplotlib.pyplot import *
x=[1, 2,
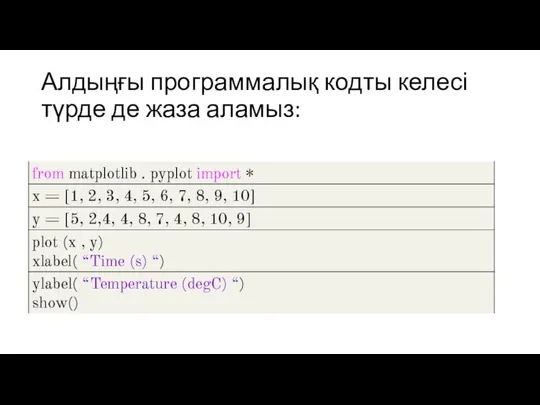
Алдыңғы программалық кодты келесі түрде де жаза аламыз:
Алдыңғы программалық кодты келесі түрде де жаза аламыз:
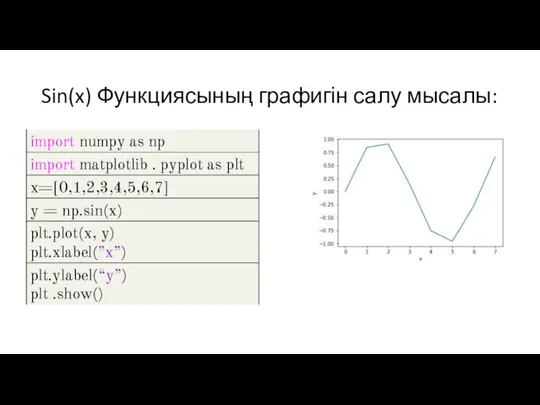
Sin(x) Функциясының графигін салу мысалы:
Sin(x) Функциясының графигін салу мысалы:
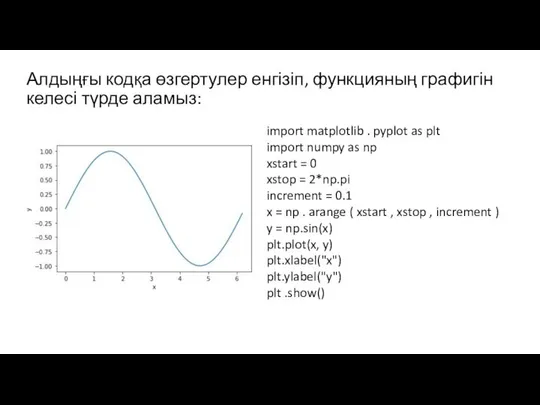
Алдыңғы кодқа өзгертулер енгізіп, функцияның графигін келесі түрде аламыз:
import matplotlib .
Алдыңғы кодқа өзгертулер енгізіп, функцияның графигін келесі түрде аламыз:
import matplotlib .
import matplotlib . pyplot as plt
import numpy as np
xstart = -2
xstop
import matplotlib . pyplot as plt
import numpy as np
xstart = -2
xstop
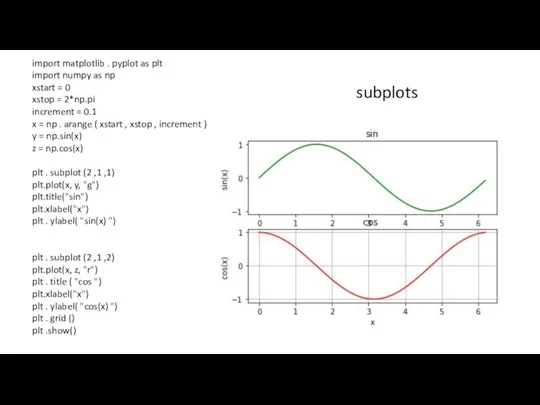
import matplotlib . pyplot as plt
import numpy as np
xstart =
import matplotlib . pyplot as plt
import numpy as np
xstart =
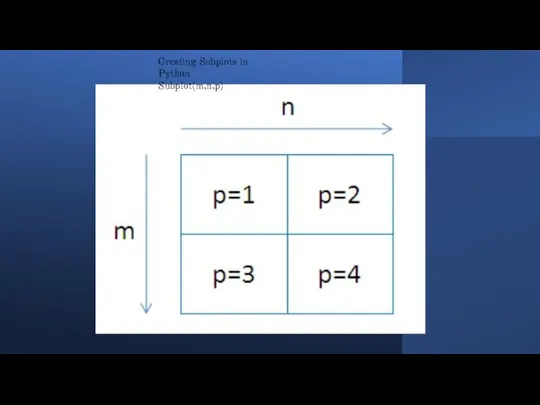
Creating Subplots in Python
Subplot(m,n,p)
Creating Subplots in Python
Subplot(m,n,p)
![import matplotlib.pyplot as plt # line 1 points x1 = [1,2,3]](/_ipx/f_webp&q_80&fit_contain&s_1440x1080/imagesDir/jpg/736042/slide-17.jpg)
import matplotlib.pyplot as plt
# line 1 points
x1 = [1,2,3]
y1 = [2,4,1]
#
import matplotlib.pyplot as plt
# line 1 points
x1 = [1,2,3]
y1 = [2,4,1]
#
![import matplotlib.pyplot as plt # x axis values x = [1,2,3,4,5,6]](/_ipx/f_webp&q_80&fit_contain&s_1440x1080/imagesDir/jpg/736042/slide-18.jpg)
import matplotlib.pyplot as plt
# x axis values
x = [1,2,3,4,5,6]
# corresponding
import matplotlib.pyplot as plt
# x axis values
x = [1,2,3,4,5,6]
# corresponding
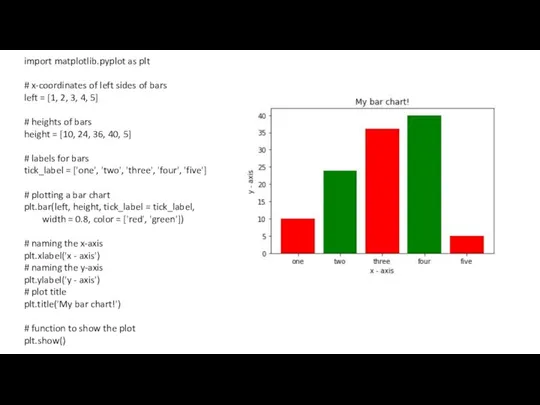
import matplotlib.pyplot as plt
# x-coordinates of left sides of bars
left =
import matplotlib.pyplot as plt
# x-coordinates of left sides of bars
left =
![import matplotlib.pyplot as plt # frequencies ages = [2,5,70,40,30,45,50,45,43,40,44, 60,7,13,57,18,90,77,32,21,20,40] #](/_ipx/f_webp&q_80&fit_contain&s_1440x1080/imagesDir/jpg/736042/slide-20.jpg)
import matplotlib.pyplot as plt
# frequencies
ages = [2,5,70,40,30,45,50,45,43,40,44,
60,7,13,57,18,90,77,32,21,20,40]
# setting the ranges
import matplotlib.pyplot as plt
# frequencies
ages = [2,5,70,40,30,45,50,45,43,40,44,
60,7,13,57,18,90,77,32,21,20,40]
# setting the ranges
![import matplotlib.pyplot as plt # x-axis values x = [1,2,3,4,5,6,7,8,9,10] #](/_ipx/f_webp&q_80&fit_contain&s_1440x1080/imagesDir/jpg/736042/slide-21.jpg)
import matplotlib.pyplot as plt
# x-axis values
x = [1,2,3,4,5,6,7,8,9,10]
# y-axis values
y =
import matplotlib.pyplot as plt
# x-axis values
x = [1,2,3,4,5,6,7,8,9,10]
# y-axis values
y =
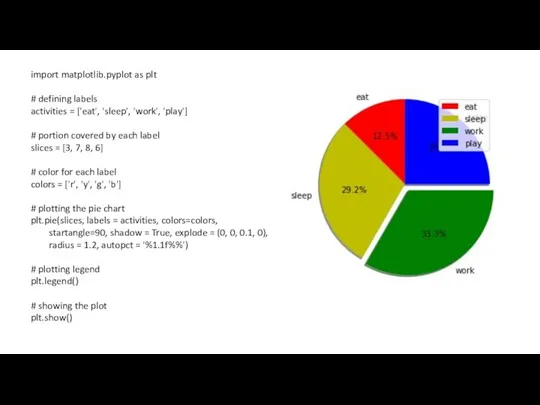
import matplotlib.pyplot as plt
# defining labels
activities = ['eat', 'sleep', 'work', 'play']
#
import matplotlib.pyplot as plt
# defining labels
activities = ['eat', 'sleep', 'work', 'play']
#
 Сервисы сети Интернет
 Презентация "Досвід" - скачать презентации по Информатике
 HTML
HTML ГРАФИКИ И ДИАГРАММЫ
  Интернет
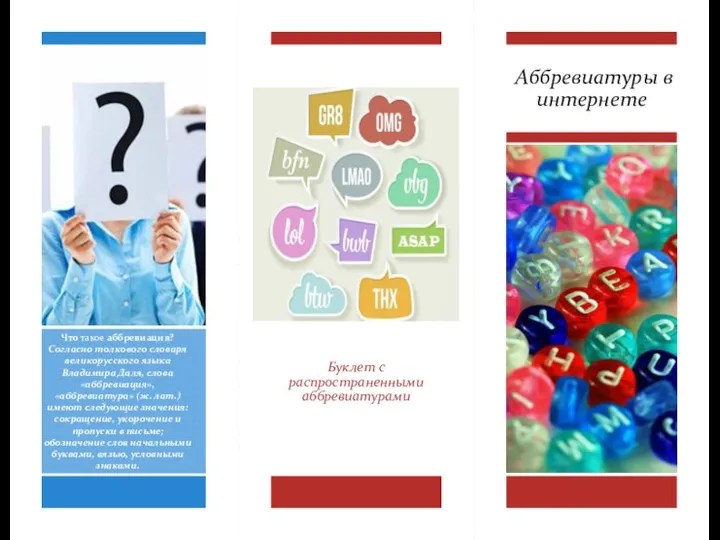 Аббревиатуры в интернете
 Составление запросов для поисковых систем с использованием логических выражений
 Функциональная схема компьютера
 Работа в системе: Партнер - Онлайн Оценка
 Файловый сервер Samba
 Проект поэтажной навигации НТГИК в технологии VENUE
 Презентация "«Состав персонального компьютера»" - скачать презентации по Информатике
 Основные принципы защиты информации в компьютерных системах. Антонова И.М. гр. И-411
  Коммуникационные технологии
 Интерфейсы
 Лабароторная работа 3
 lektsia_1
 Решение заданий на позиционные системы счисления Подготовка к ЕГЭ Задания В8
 Безопасность школьников в сети интернета
 Влияние социальных сетей и интернета на речь молодежи
 Укрощение электрона История развития мониторов
 Редактирование и корректура документов
 Системы счисления. (Лекция 3)
 Системы конструкторского и технологического проектирования (лекция 3)
 Локальные и глобальные сети ЭВМ
 Презентация "Этапы разработки и исследования моделей на компьютере" - скачать презентации по Информатике
 Презентация "КОМПЬЮТЕРНАЯ ГРАФИКА" - скачать презентации по Информатике
 Что такое алгоритм. Жизненные задачи