- Source coordinate definition by. Non-destructive assay

Содержание
- 2. Schematic of the experimental set. 1 3 2 4 -4 -3 -2 -1 0 1 2
- 3. Table of correspondence between source position and coordinate
- 4. Detector №1 Diagramm of the registered particles sorted by amplitude (axis Y) and division parameter (axis
- 5. Detector №2 Diagramm of the registered particles sorted by amplitude (axis Y) and division parameter (axis
- 6. Detector №3 Diagramm of the registered particles sorted by amplitude (axis Y) and division parameter (axis
- 7. Detector №3 Diagramm of the registered particles sorted by amplitude (axis Y) and division parameter (axis
- 9. Скачать презентацию
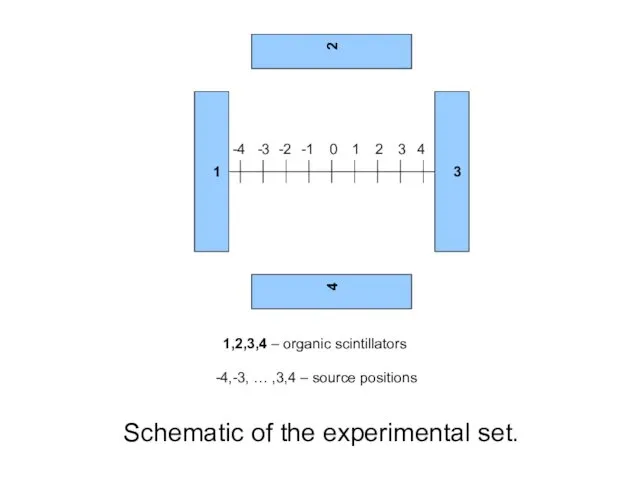
Schematic of the experimental set.
1
3
2
4
-4
-3
-2
-1
0
1
2
3
4
1,2,3,4 – organic scintillators
-4,-3, … ,3,4 –
Schematic of the experimental set.
1
3
2
4
-4
-3
-2
-1
0
1
2
3
4
1,2,3,4 – organic scintillators
-4,-3, … ,3,4 –
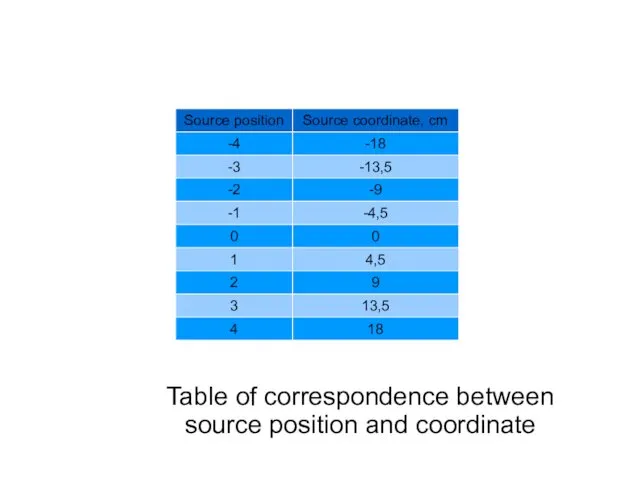
Table of correspondence between source position and coordinate
Table of correspondence between source position and coordinate
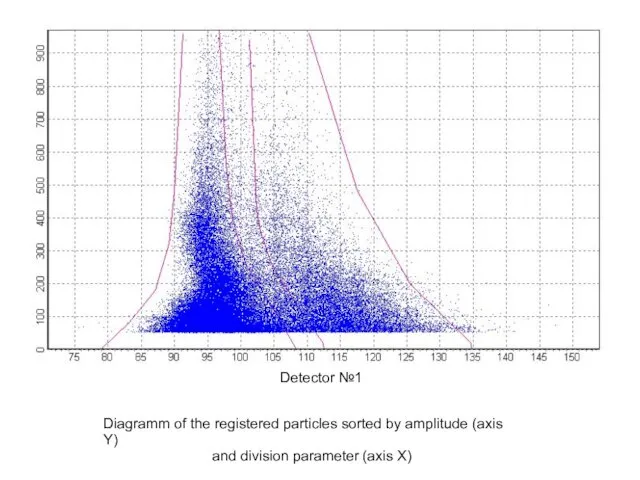
Detector №1
Diagramm of the registered particles sorted by amplitude (axis Y)
and
Detector №1
Diagramm of the registered particles sorted by amplitude (axis Y)
and
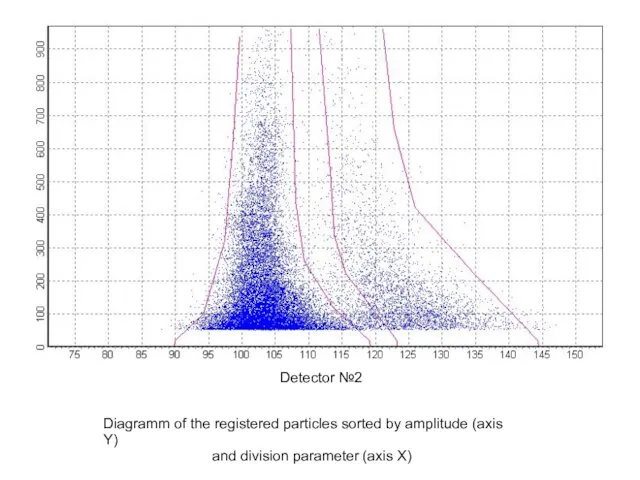
Detector №2
Diagramm of the registered particles sorted by amplitude (axis Y)
and
Detector №2
Diagramm of the registered particles sorted by amplitude (axis Y)
and

Detector №3
Diagramm of the registered particles sorted by amplitude (axis Y)
and
Detector №3
Diagramm of the registered particles sorted by amplitude (axis Y)
and

Detector №3
Diagramm of the registered particles sorted by amplitude (axis Y)
and
Detector №3
Diagramm of the registered particles sorted by amplitude (axis Y)
and
 Параллельные прямые. Решение задач
 Числа - великаны
 ГИА. Открытый банк заданий по математике. (Задача 3)
 Быстрый счет. Табличное сложение чисел от 11 до 20
 Сравнение предметов по различным признакам
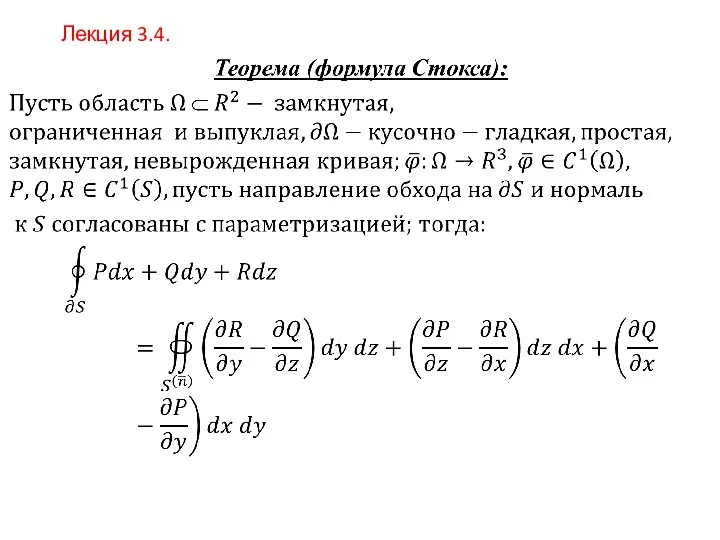 Формула Стокса. Формула Гаусса-Остроградского. Лекция 3.4
 Преобразование алгебраических выражений
 Системы эконометрических уравнений
 Замечательные точки треугольника
 Значение переменных верного равенства. Корни уравнений
 Презентация Знаки «+», «–»,«=»
  Сандық тізбек
 Векторная алгебра
 Параллельные прямые
 Антагонистические игры
 Алтын қақпа
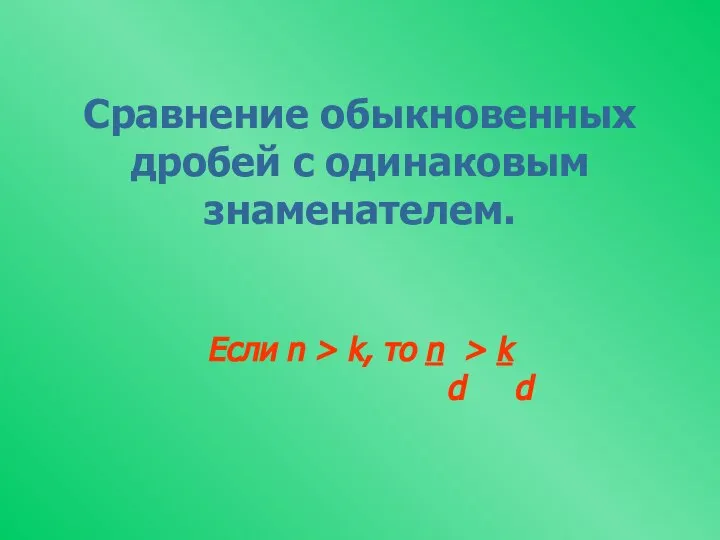 Сравнение обыкновенных дробей с одинаковым знаменателем. Если n > k, то n > k d d
 Считаем с гномами. Математика 1 класс. Сложение с переходом через десяток
 Презентация по математике "Метод графов" - скачать
  Подготовка к ГИА по математике. Задания 17
 Презентация по математике "Великолепная семерка" - скачать
  Линейная функция
 Определение функции
 Простейшие задачи в координатах
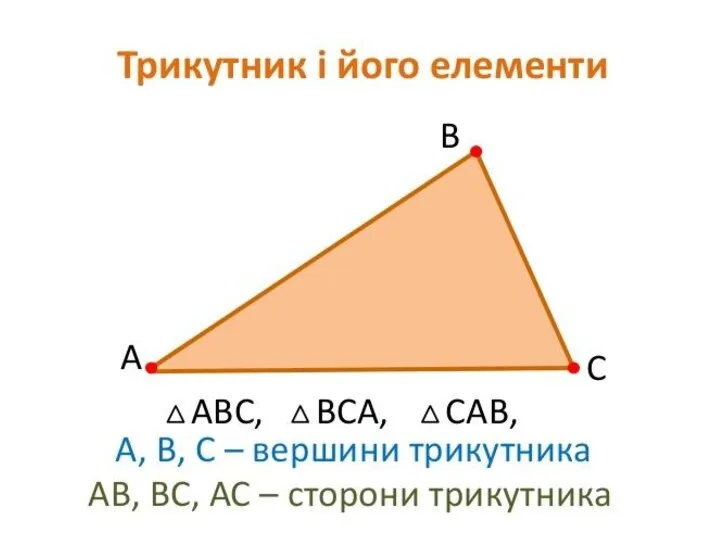 Трикутник і його елементи
 Определение вектора
 Проверка качества уравнения регрессии
 У кого Карлсон в гостях