- Types of Data – (continued). Week 2 (2)

Содержание
- 2. NEW IN CLASS? Send me an email to the following address: susanne.saral@okan.edu.tr DR SUSANNE HANSEN SARAL
- 3. Activation of piazza.com account Enter your first and last name Select : Undergraduate Select : Economy
- 4. Organizing categorical data Categorical data produce values that are names, words or codes, but not real
- 5. The Frequency and relative frequency - Distribution Table Summarizing categorical data A frequency table organizes data
- 6. Contingency table another type of frequency table Contingency tables list the number of observations for every
- 7. Contingency table A larger retailer of electronics conducted a survey to determine consumer preferences for various
- 8. Three Rules of Data Analysis Rule 1, 2 and 3: Make a picture of the data
- 9. Bar Chart – Hospital patients DR SUSANNE HANSEN SARAL, SUSANNE.SARAL@GMAIL.COM Hospital Number Unit of Patients Cardiac
- 10. Pie Chart – Hospital patients DR SUSANNE HANSEN SARAL, SUSANNE.SARAL@GMAIL.COM (Percentages are rounded to the nearest
- 11. Bar-chart Number of visits to OKAN University website
- 12. Pie-chart Number of visits to OKAN University website
- 13. Graphing Multivariate Categorical Data MULTIVARIATE= MORE THAN ONE VARIABLE Why multivariate? We are investigating more than
- 14. Graphing Multivariate Categorical Data
- 15. Graphing Multivariate Categorical Data Side by side horizontal bar chart DR SUSANNE HANSEN SARAL, SUSANNE.SARAL@GMAIL.COM (continued)
- 16. Graphing Multivariate Categorical Data Stacked bar chart DR SUSANNE HANSEN SARAL, SUSANNE.SARAL@GMAIL.COM (continued)
- 17. Class exercise The following raw data show responses to the question “What is your primary source
- 18. Class exercise A cable company surveyed its customers and asked how likely they were to bundle
- 19. Week 2 (2) How to organize and illustrate numerical data DR SUSANNE HANSEN SARAL EMAIL: SUSANNE.SARAL@OKAN.EDU.TR
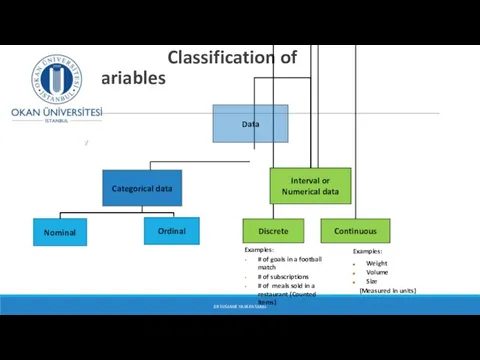
- 20. Classification of Variables DR SUSANNE HANSEN SARAL Examples: # of goals in a football match #
- 21. Numerical/quantitative Data Histogram Frequency Distributions and Cumulative Distributions Tables and Graphs to Describe Numerical Variables DR
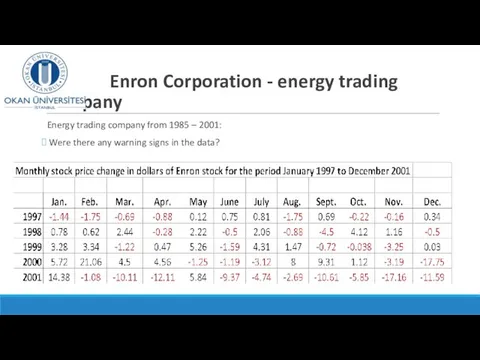
- 22. Enron Corporation - energy trading company Energy trading company from 1985 – 2001 (then went bankrupt):
- 23. Enron Corporation - energy trading company Energy trading company from 1985 – 2001: Were there any
- 24. Enron Corporation - energy trading company Energy trading company from 1985 – 2001: Were there any
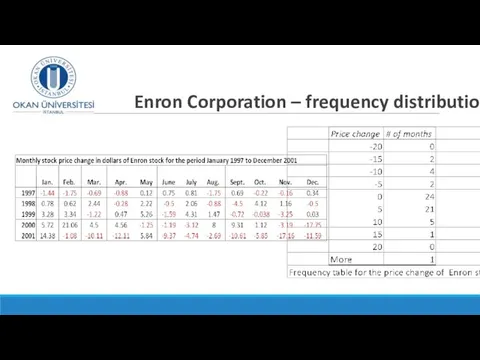
- 26. Enron Corporation – frequency distribution
- 28. Why Use Frequency Distributions and graphs for numerical data? A frequency distribution is a way to
- 29. Frequency Distributions What is a Frequency Distribution for numerical data? A frequency distribution is a table
- 30. Frequency Distributions for numerical data Intervals for numerical data are not as easy to identify as
- 31. Raw data (sample of 110 employees in a production plant) Completion Times of a particular task
- 32. How to determine the number of intervals/classes A quick guide Sample size Number of intervals Fewer
- 33. How to determine the interval width Each class/interval grouping has to have the same width Determine
- 34. Employee completion time 110 employees’ time have been recorded and the plant supervisor needs to report
- 35. Employee completion time DR SUSANNE HANSEN SARAL, SUSANNE.SARAL@GMAIL.COM
- 36. Employee completion time Completion time (in seconds) Frequency Relative frequency % 220 – 229 5 4.5
- 37. Histogram of employee completion times Absolute frequency DR SUSANNE HANSEN SARAL, SUSANNE.SARAL@GMAIL.COM
- 38. Histogram of employee completion times Relative frequency same graph as absolute frequency DR SUSANNE HANSEN SARAL,
- 39. Employee completion time Cumulative frequency DR SUSANNE HANSEN SARAL, SUSANNE.SARAL@GMAIL.COM
- 40. Histogram – Absolute frequency Enron: Change in stock price DR SUSANNE HANSEN SARAL, SUSANNE.SARAL@GMAIL.COM
- 42. Скачать презентацию

NEW IN CLASS?
Send me an email to the following address:
NEW IN CLASS?
Send me an email to the following address:
Activation of piazza.com account
Enter your first and last name
Select
Activation of piazza.com account
Enter your first and last name
Select

Organizing categorical data
Categorical data produce values that are names,
Organizing categorical data
Categorical data produce values that are names,
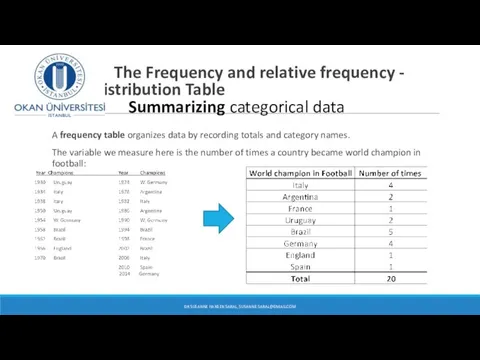
The Frequency and relative frequency - Distribution Table
Summarizing categorical data
The Frequency and relative frequency - Distribution Table Summarizing categorical data

Contingency table
another type of frequency table
Contingency tables list
Contingency table
another type of frequency table
Contingency tables list
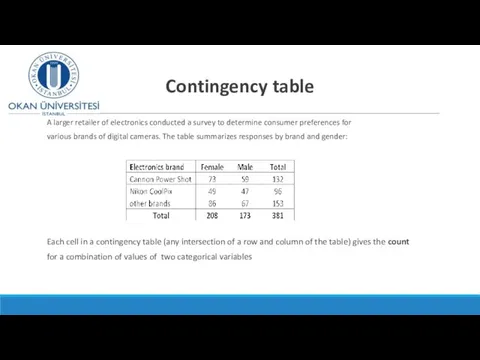
Contingency table
A larger retailer of electronics conducted a survey
Contingency table
A larger retailer of electronics conducted a survey

Three Rules of Data Analysis
Rule 1, 2 and 3: Make
Three Rules of Data Analysis
Rule 1, 2 and 3: Make
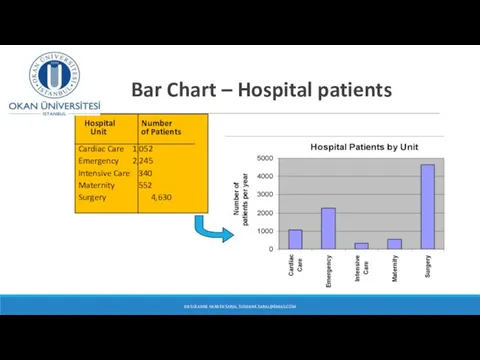
Bar Chart – Hospital patients
DR SUSANNE HANSEN SARAL, SUSANNE.SARAL@GMAIL.COM
Hospital Number
Bar Chart – Hospital patients
DR SUSANNE HANSEN SARAL, SUSANNE.SARAL@GMAIL.COM
Hospital Number
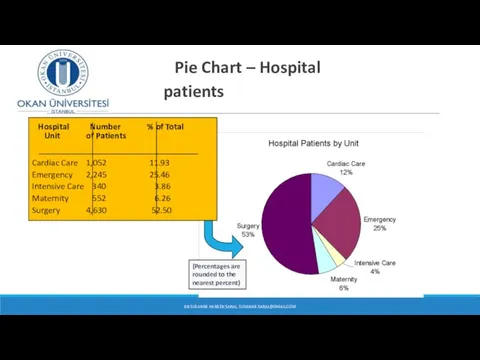
Pie Chart – Hospital patients
DR SUSANNE HANSEN SARAL, SUSANNE.SARAL@GMAIL.COM
(Percentages are
Pie Chart – Hospital patients
DR SUSANNE HANSEN SARAL, SUSANNE.SARAL@GMAIL.COM
(Percentages are

Bar-chart Number of visits to OKAN University website
Bar-chart Number of visits to OKAN University website
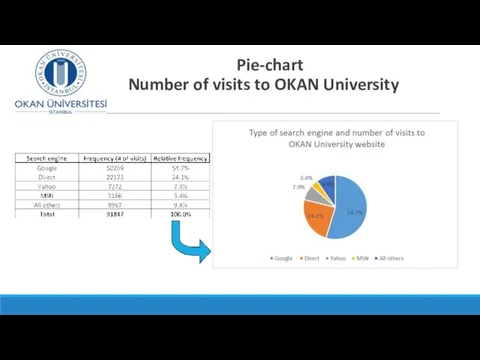
Pie-chart Number of visits to OKAN University website
Pie-chart Number of visits to OKAN University website
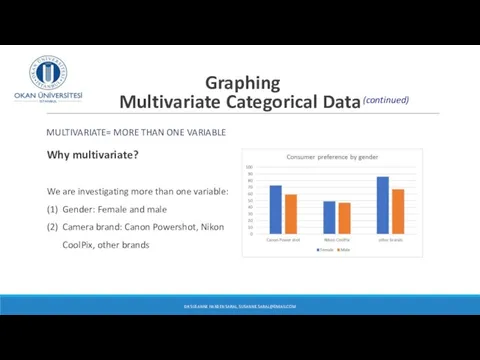
Graphing Multivariate Categorical Data
MULTIVARIATE= MORE THAN ONE VARIABLE
Why multivariate?
We are
Graphing Multivariate Categorical Data
MULTIVARIATE= MORE THAN ONE VARIABLE
Why multivariate?
We are

Graphing Multivariate Categorical Data
Graphing Multivariate Categorical Data

Graphing Multivariate Categorical Data
Side by side horizontal bar chart
DR SUSANNE
Graphing Multivariate Categorical Data
Side by side horizontal bar chart
DR SUSANNE

Graphing Multivariate Categorical Data
Stacked bar chart
DR SUSANNE HANSEN SARAL, SUSANNE.SARAL@GMAIL.COM
(continued)
Graphing Multivariate Categorical Data
Stacked bar chart
DR SUSANNE HANSEN SARAL, SUSANNE.SARAL@GMAIL.COM
(continued)
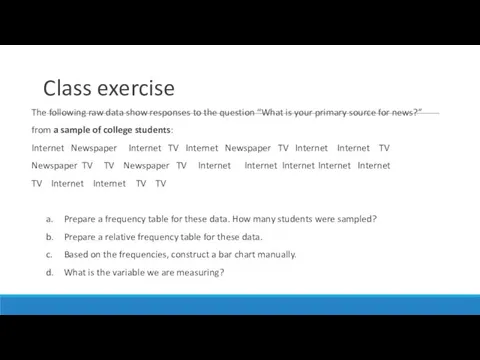
Class exercise
The following raw data show responses to the question “What
Class exercise
The following raw data show responses to the question “What

Class exercise
A cable company surveyed its customers and asked how
Class exercise A cable company surveyed its customers and asked how
Week 2 (2) How to organize and illustrate numerical data
DR SUSANNE
Week 2 (2) How to organize and illustrate numerical data
DR SUSANNE
Classification of Variables
DR SUSANNE HANSEN SARAL
Examples:
# of goals in a
Classification of Variables
DR SUSANNE HANSEN SARAL
Examples:
# of goals in a

Numerical/quantitative Data
Histogram
Frequency Distributions and
Cumulative Distributions
Tables and Graphs to Describe Numerical
Numerical/quantitative Data
Histogram
Frequency Distributions and
Cumulative Distributions
Tables and Graphs to Describe Numerical

Enron Corporation - energy trading company
Energy trading company from 1985
Enron Corporation - energy trading company
Energy trading company from 1985
Enron Corporation - energy trading company
Energy trading company from 1985
Enron Corporation - energy trading company
Energy trading company from 1985

Enron Corporation - energy trading company
Energy trading company from 1985
Enron Corporation - energy trading company
Energy trading company from 1985

Enron Corporation – frequency distribution
Enron Corporation – frequency distribution

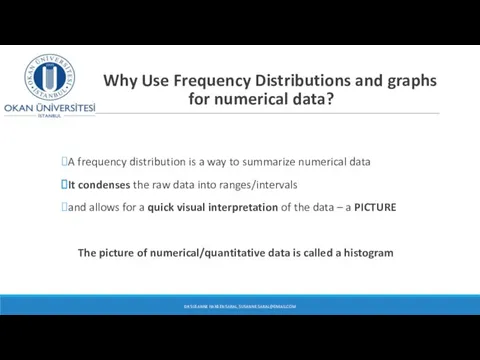
Why Use Frequency Distributions and graphs for numerical data?
A frequency distribution
Why Use Frequency Distributions and graphs for numerical data?
A frequency distribution

Frequency Distributions
What is a Frequency Distribution for numerical data?
A
Frequency Distributions
What is a Frequency Distribution for numerical data?
A

Frequency Distributions for numerical data
Intervals for numerical data are not as
Frequency Distributions for numerical data
Intervals for numerical data are not as
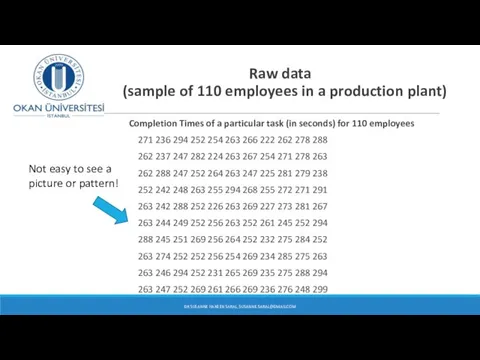
Raw data (sample of 110 employees in a production plant)
Completion
Raw data (sample of 110 employees in a production plant)
Completion

How to determine the number of intervals/classes A quick guide
Sample
How to determine the number of intervals/classes A quick guide
Sample
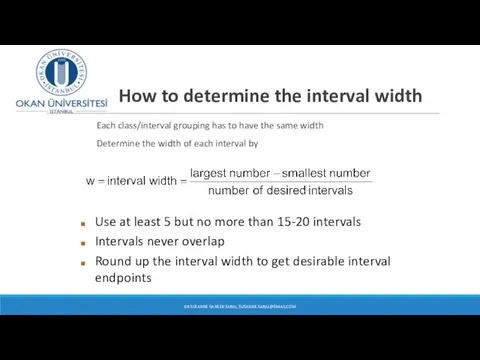
How to determine the interval width
Each class/interval grouping has to
How to determine the interval width
Each class/interval grouping has to

Employee completion time
110 employees’ time have been recorded and
Employee completion time
110 employees’ time have been recorded and

Employee completion time
DR SUSANNE HANSEN SARAL, SUSANNE.SARAL@GMAIL.COM
Employee completion time
DR SUSANNE HANSEN SARAL, SUSANNE.SARAL@GMAIL.COM

Employee completion time
Completion time (in seconds) Frequency Relative frequency %
220 –
Employee completion time
Completion time (in seconds) Frequency Relative frequency %
220 –
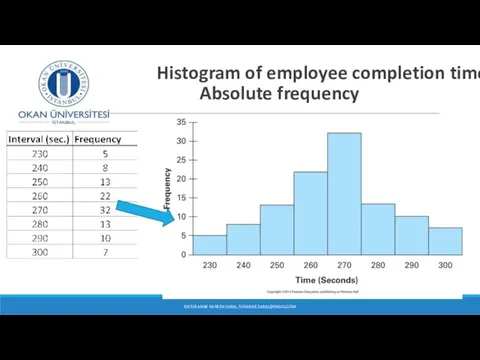
Histogram of employee completion times Absolute frequency
DR SUSANNE HANSEN
Histogram of employee completion times Absolute frequency
DR SUSANNE HANSEN
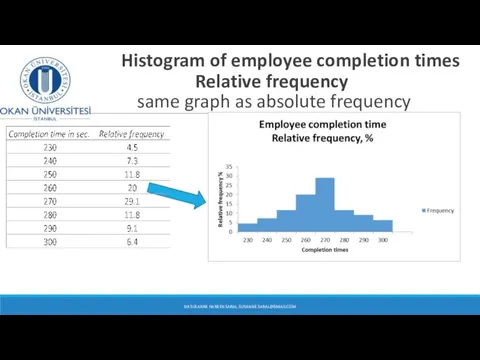
Histogram of employee completion times Relative frequency same graph as
Histogram of employee completion times Relative frequency same graph as
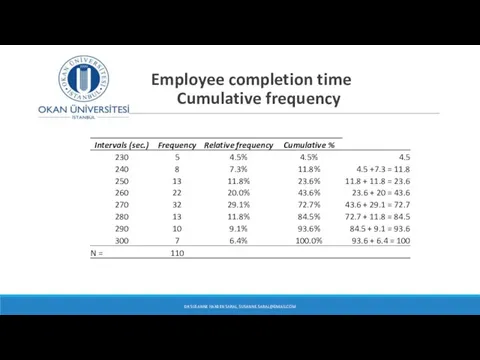
Employee completion time
Cumulative frequency
DR SUSANNE HANSEN SARAL, SUSANNE.SARAL@GMAIL.COM
Employee completion time
Cumulative frequency
DR SUSANNE HANSEN SARAL, SUSANNE.SARAL@GMAIL.COM

Histogram – Absolute frequency
Enron: Change in stock price
DR SUSANNE
Histogram – Absolute frequency
Enron: Change in stock price
DR SUSANNE
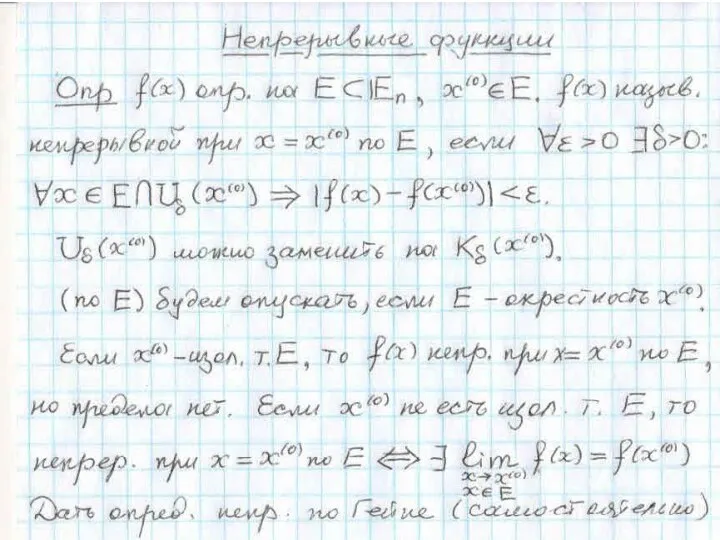 Непрерывные функции
 Аттестационная работа. Программа курса внеурочной деятельности Живая математика
 Старинный способ решения задач на смеси и сплавы
 Координатная плоскость
 Линейные неравенства
 Задачи на построение сечений в тетраэдре и параллелограмме
 Математическая жизнь класса в графиках и диаграммах
 Пособие для самостоятельного обучения учащихся 5-6 классов Проценты. Основные задачи на проценты.
 Площадь правильного треугольника
 Числовые последовательности
 Открытый урок в 1 классе по математике. Тема: Дециметр
 K-подмножества
 Прямоугольник. Квадрат
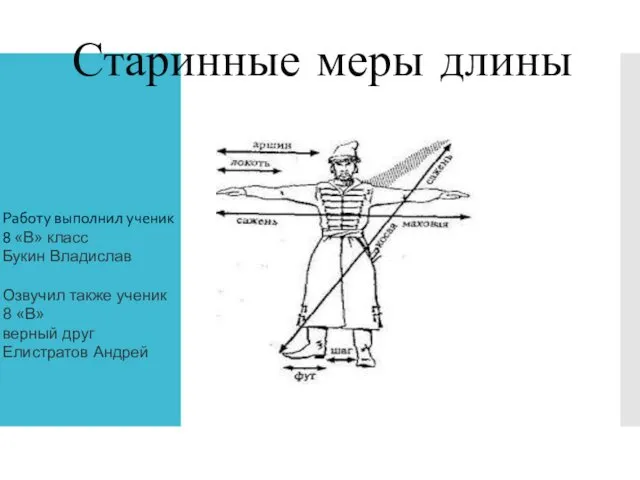 Старинные меры длины на Руси
 Марковские цепи
 Презентация на тему Кто хочет стать отличником Математическая игра
  Решение уравнений (5 класс)
 Прямая и обратная пропорциональные зависимости
 Исследовательская работа на уроках математики Учитель математики Ледовская Евгения Николаевна
  Сумма углов треугольника
 Моделирование систем и процессов. Марковские процессы. (Лекция 3)
 Подготовка к контрольной работе по алгебре. (9 класс)
 Алгоритмы линейного поиска. Тема 1
 Свойства параллельных прямых
 Құрама есептер
 Урок математики
 Презентация по математике "Уравнения 1 класс" - скачать бесплатно
 Справедливые и несправедливые игры с точки зрения теории вероятностей