- Wellness and health promotion

Содержание
- 2. Objectives Describe quality of life and list some measures used to describe quality of life. List
- 3. Quality of Life General Sense of Happiness and Satisfaction And Contentment Hard to Measure Personal sense
- 4. How To Lead Flourishing Lives? Scarcity/Poverty: Can cause increased health risks, high levels of stress, tunneling
- 5. To Increase Life Expectancy and Quality of Life…People Need Knowledge Motivation Opportunities Resources Life expectancy is
- 6. Mortality Number of deaths that occur at a specific time, in a specific group, from a
- 7. Morbidity Number of people with a specific disease, during a specific period, in a specific location.
- 8. Rates Formula that divides the number of events (cases) occurring in a population by the number
- 9. Health Disparities Differences in the health of people that is not due to biological or genetic
- 10. Disparities Due to Gender Longer Life Expectancy Lower Death Rates Lower Rates of Intentional Injuries Higher
- 11. Disparities Due to Race/Ethnicity African Americans Hispanics Infant Mortality Complications of Heart Disease Diabetes Prostate Cancer
- 12. Disparities Due to Income Fair or Poor Perceived Health Low Income High Income
- 13. Relationship Between Education and Income Over a 30 year career the increase in salary between a
- 14. Race/Ethnicity of Persons Living Below the Poverty Level
- 15. Educational Attainment by Race/Ethnicity
- 16. Disparities Due to Disabilities Activity Limitations Weight Control Access to Health Care
- 18. Скачать презентацию
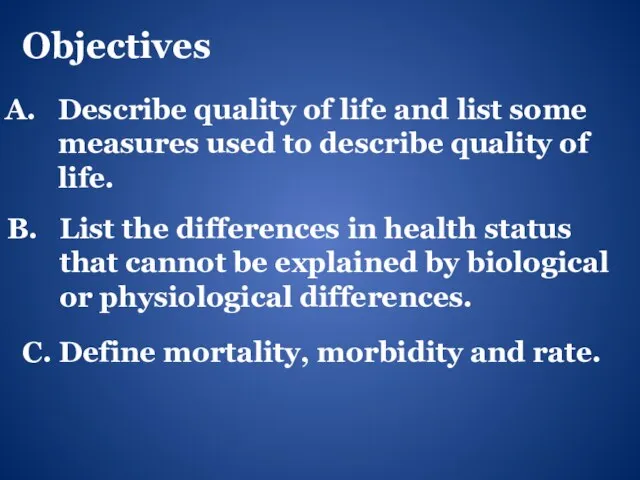
Objectives
Describe quality of life and list some
measures used to describe
Objectives
Describe quality of life and list some
measures used to describe
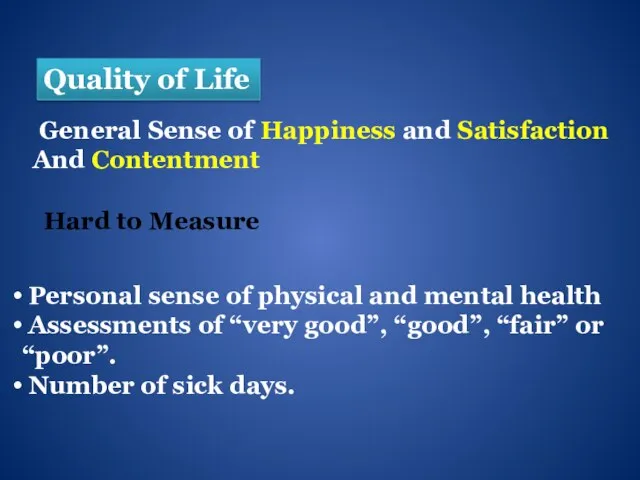
Quality of Life
General Sense of Happiness and Satisfaction
And Contentment
Hard to
Quality of Life
General Sense of Happiness and Satisfaction
And Contentment
Hard to
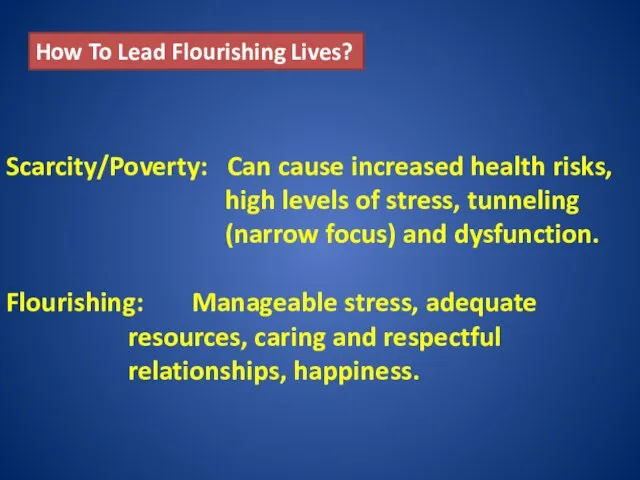
How To Lead Flourishing Lives?
Scarcity/Poverty: Can cause increased health risks,
How To Lead Flourishing Lives?
Scarcity/Poverty: Can cause increased health risks,

To Increase Life Expectancy and
Quality of Life…People Need
Knowledge
Motivation
Opportunities
Resources
Life expectancy is
To Increase Life Expectancy and
Quality of Life…People Need
Knowledge
Motivation
Opportunities
Resources
Life expectancy is
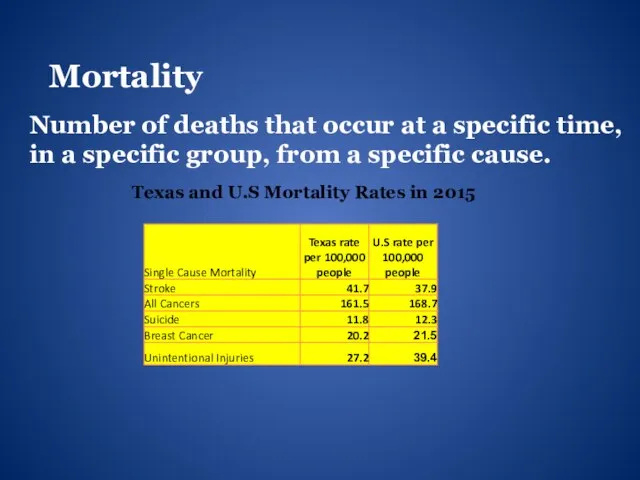
Mortality
Number of deaths that occur at a specific time,
in a
Mortality
Number of deaths that occur at a specific time,
in a
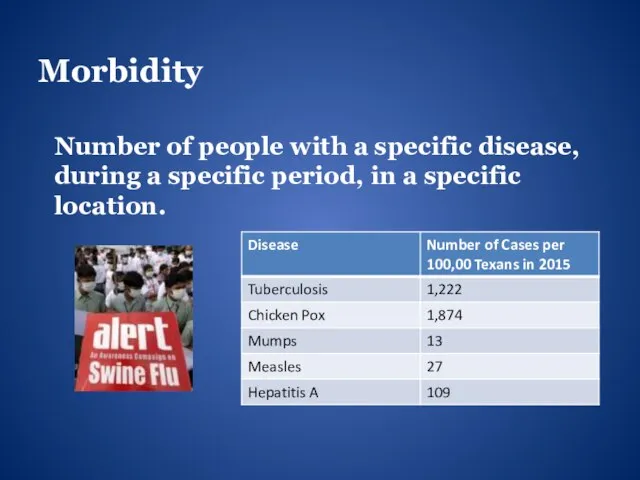
Morbidity
Number of people with a specific disease,
during a specific period,
Morbidity
Number of people with a specific disease,
during a specific period,
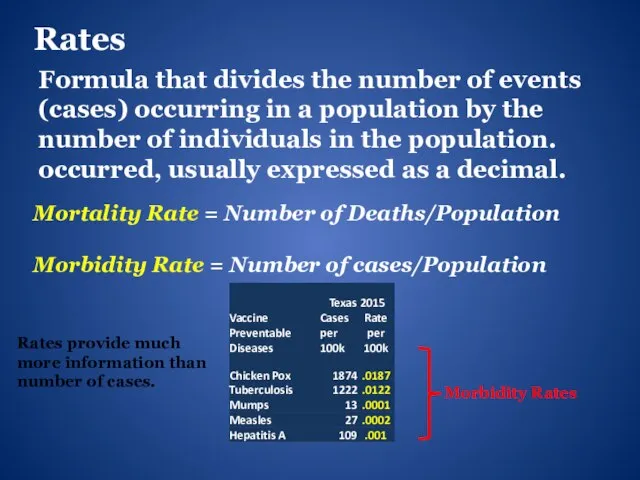
Rates
Formula that divides the number of events
(cases) occurring in a population
Rates
Formula that divides the number of events
(cases) occurring in a population
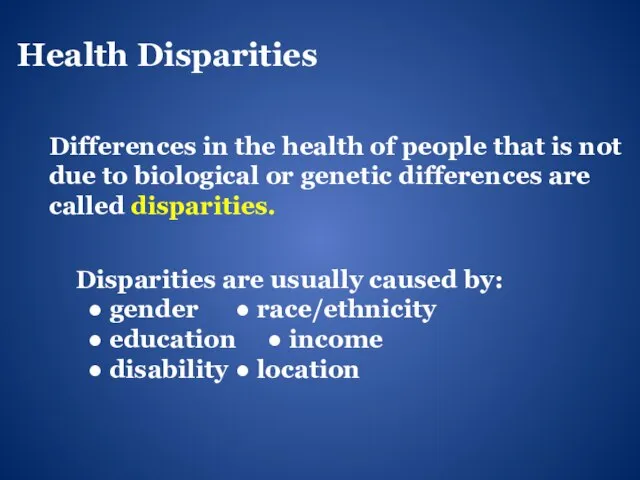
Health Disparities
Differences in the health of people that is not
due to
Health Disparities
Differences in the health of people that is not
due to
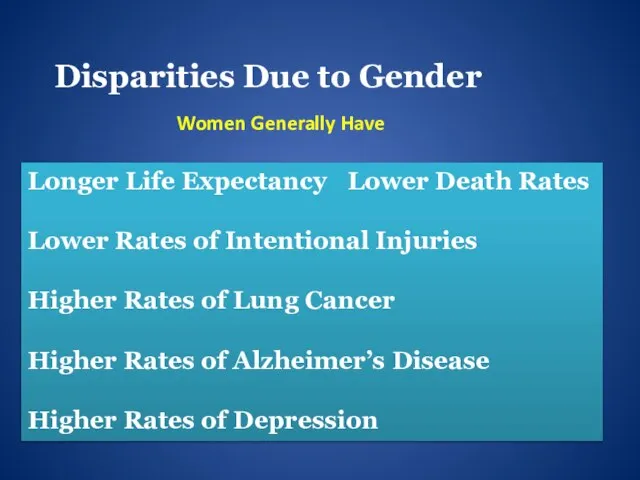
Disparities Due to Gender
Longer Life Expectancy Lower Death Rates
Lower Rates of Intentional
Disparities Due to Gender
Longer Life Expectancy Lower Death Rates
Lower Rates of Intentional
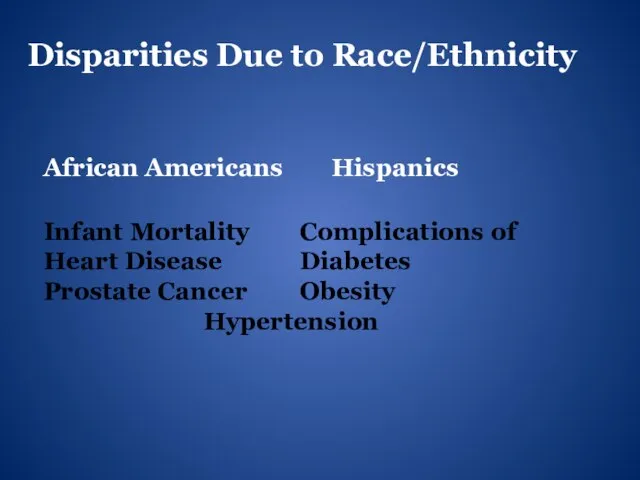
Disparities Due to Race/Ethnicity
African Americans Hispanics
Infant Mortality Complications of
Heart Disease Diabetes
Prostate Cancer Obesity
Hypertension
Disparities Due to Race/Ethnicity
African Americans Hispanics
Infant Mortality Complications of
Heart Disease Diabetes
Prostate Cancer Obesity
Hypertension
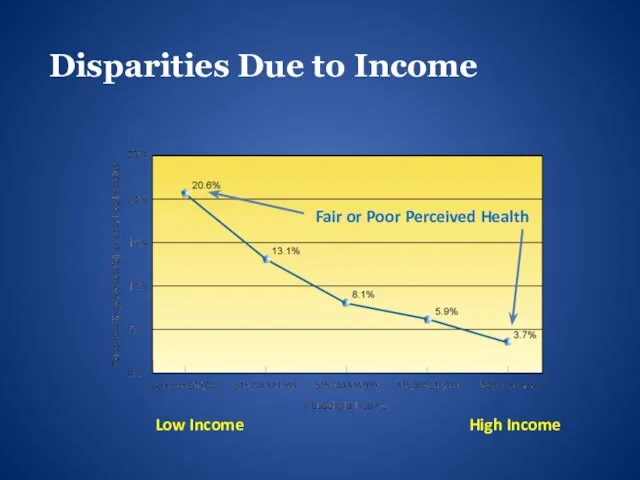
Disparities Due to Income
Fair or Poor Perceived Health
Low Income High Income
Disparities Due to Income
Fair or Poor Perceived Health
Low Income High Income

Relationship Between
Education and Income
Over a 30 year career
the increase in
Relationship Between
Education and Income
Over a 30 year career
the increase in
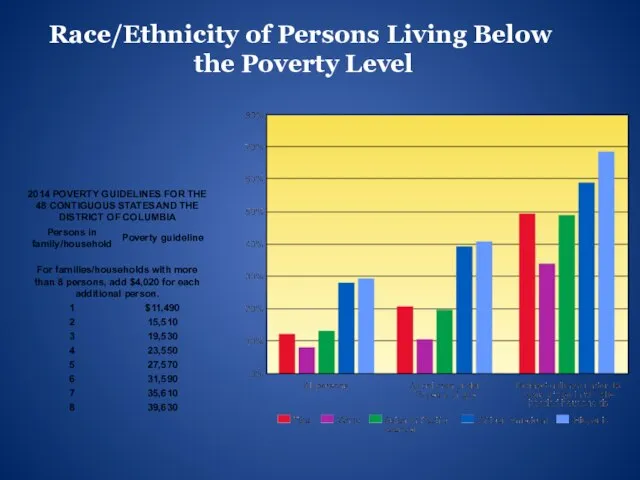
Race/Ethnicity of Persons Living Below
the Poverty Level
Race/Ethnicity of Persons Living Below
the Poverty Level

Educational Attainment
by Race/Ethnicity
Educational Attainment
by Race/Ethnicity

Disparities Due to Disabilities
Activity Limitations Weight Control
Access to Health Care
Disparities Due to Disabilities
Activity Limitations Weight Control
Access to Health Care
 Патофизиология обмена веществ
 Гипоталамо-гипофизарная система
 UWF Campus Alcohol Coalition
 Параметрические методы оценки результатов статистического исследования. Лекция №7
 Хирургические инфекции при повреждениях и заболеваниях конечностей
 Медицинский дискурс
 Введение в рентгенанатомию
 Базовые диагностические услуги многопрофильных медицинских Центров Москвы. Обзор медицинского рынка ЦФО и Москвы
 Физиология выделения. Физиология почек и водно-солевого обмена
 Анализ телерентгенограммы
 Туа біткен кардиттер. Эластофиброз
 20 искусственных объектов для улучшения и поддержания здоровья, усовершенствования тела человека
 Психогигиена
 Черепно-мозговая травма: сотрясение головного мозга
 Конфликты в межличностных отношениях
 Острые лейкозы. Лабораторная диагностика гемобластозов
 Треугольник Гиппократа
 Науқас пен оның туыстарымен денсаулық сақтау саласында жұмыс істейтін қызметкерлер мен тиімді қарым-қатынасқа түсудің
 СПИД. ВИЧ
 20131010_pervaya_pomoshch_pri_ukusakh_zhivotnykh
 Психология воздействия в следственной практике
 Интенсивная терапия алкогольного абстинентного синдрома
 Панкреонекроз
 Дифференциальная диагностика кратковременной потери сознании (синкопе)
 Системы регуляции жизнедеятельности
 Психологические особенности проявления синдрома эмоционального выгорания у сотрудников уголовно-исполнительной системы
 Руководство по забору проб для лабораторных исследований
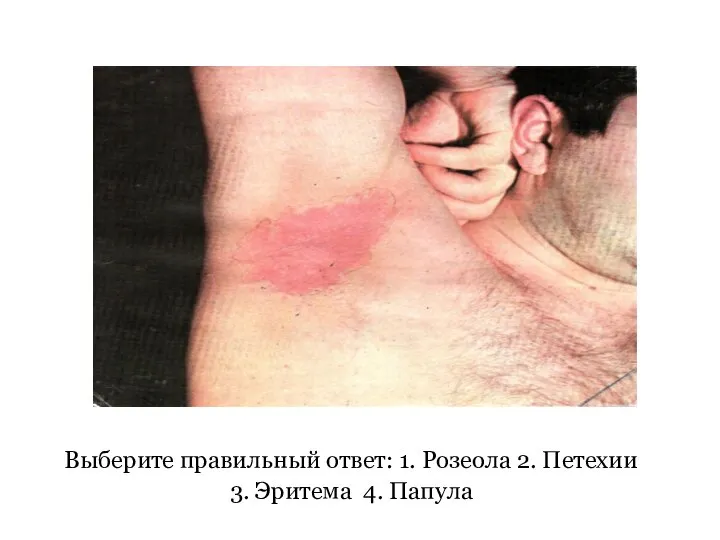 Дерматологический статус. Задачи