- Battery Capacity Project AC

Содержание
- 2. San Francisco New York Chicago Houston Time Capacity
- 3. Factors Battery capacity decreases over time and the main factor that affects the rate of battery
- 4. Temperature Stress factor S(T) We used a research paper and found that the stress factor for
- 5. S(T) modelling We use the temperature in the city of San Francisco to model temperature stress
- 7. Скачать презентацию
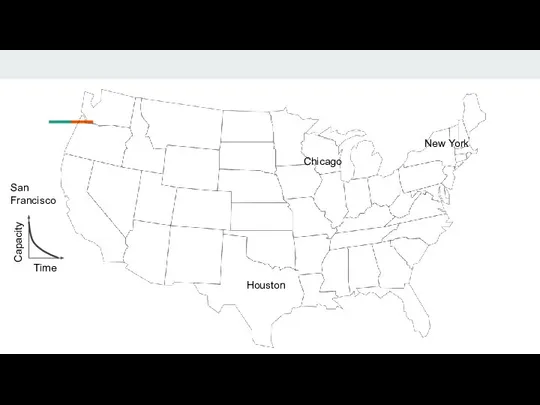
San Francisco
New York
Chicago
Houston
Time
Capacity
San Francisco
New York
Chicago
Houston
Time
Capacity
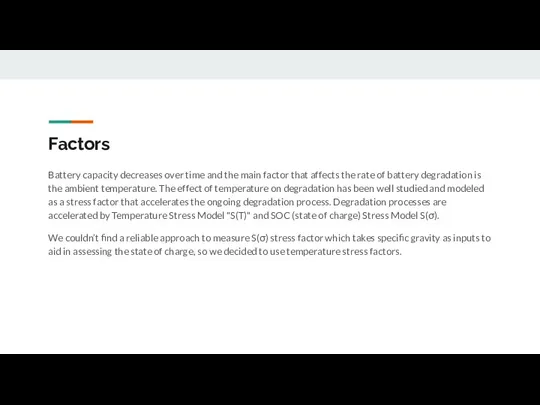
Factors
Battery capacity decreases over time and the main factor that affects
Factors
Battery capacity decreases over time and the main factor that affects
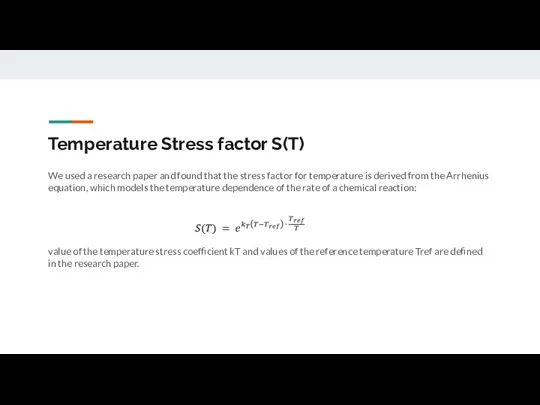
Temperature Stress factor S(T)
We used a research paper and found that
Temperature Stress factor S(T)
We used a research paper and found that
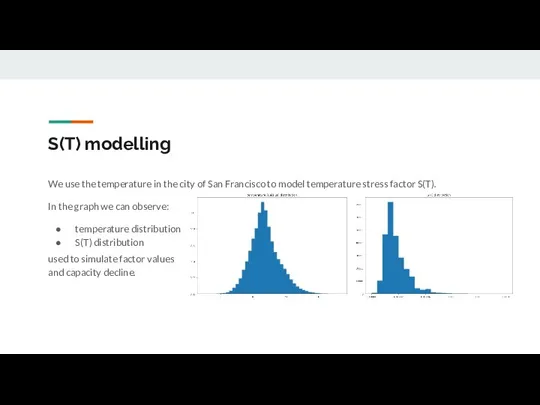
S(T) modelling
We use the temperature in the city of San Francisco
S(T) modelling
We use the temperature in the city of San Francisco
 Провешивание поверхностей, устройство маяков. Установка штукатурных маяков
 Организация работы сортировочной станции
 Доклад на тему ГЛОНАСС
 Портфолио Жумабаева Мукатжана
 апреля
 Разработка технологии сборки-сварки кровельной фермы
 Графен: анализ свойств и перспективы применения
 Проект благоустройства территории УТТиСТ
 Устройства закрепления подвижного состава
 Состав воздуха
 Презентация 3
 The history of the mustang
 АО Сигма-оптик. Датчик-сигнализатор твердых включений и капельной влаги в потоке газа ДСП-А
 Foundation of the company
 Блокировка действия дистанционных защит при выходе параметров нагрузочного режима за допустимые значения
 Технология нанесения составов жидких обоев на поверхность стен и потолков
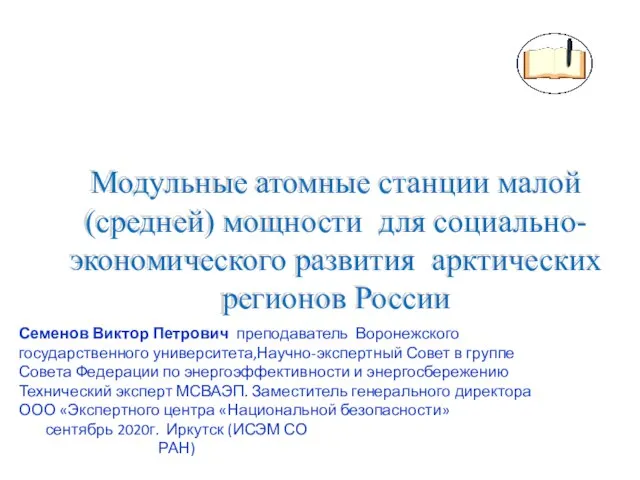 Модульные атомные станции малой (средней) мощности для социально-экономического развития арктических регионов России
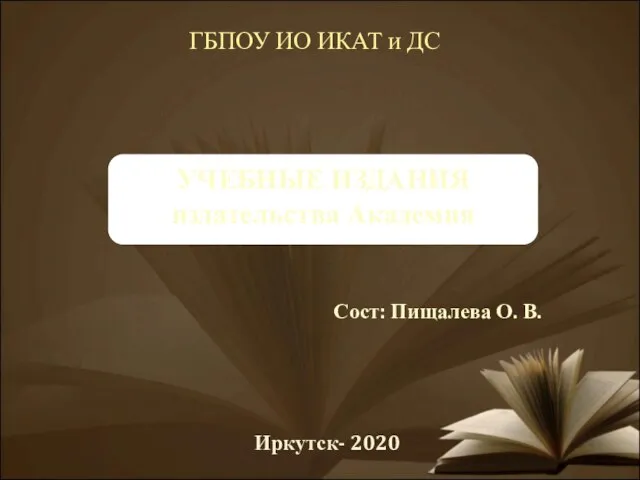 Учебные издания издательства Академия
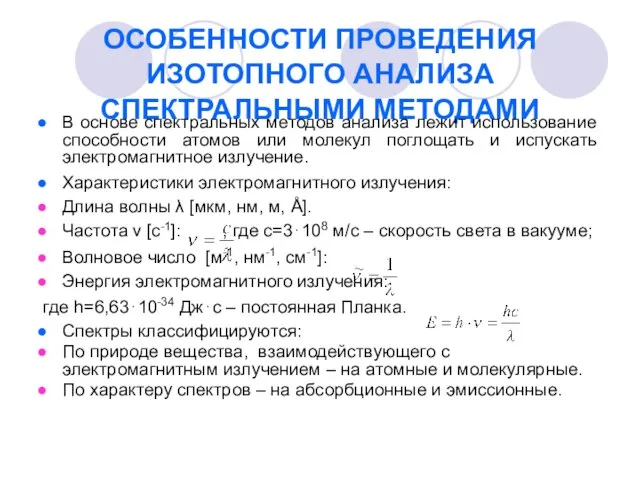 Особенности проведения изотопного анализа спектральными методами
 20111117_rossiya_pri_petrei
 Анализ оперативно-тактических действий пожарных подразделений Самарского пожарно-спасательного гарнизона
 Путешествие Екатерины II в Крым
 Биосфера - сфера жизни
 Анализ и совершенствование формирования кадровой политики в организации
 Завод по производству биоэнергии Рowerbarn
 Применение ККТ в сфере Туризма
 Мостовые краны
 Конкурс Знай-ка!, посвященный 80-летию Промышленновского района