- Power Requirements of A Vehicle

Содержание
- 2. Animal Driven Vehicles
- 3. The Powering Engine Torque is: The speed of the vehicle in km/h is: rwheel = Wheel
- 4. Modern Cars are not Directly Driven!?!?!
- 5. High Way Driving Cycle
- 6. Urban Driving Cycle
- 7. Forces To be Overcome by an Automobile
- 8. Resistance Forces on A Vehicle The major components of the resisting forces to motion are comprised
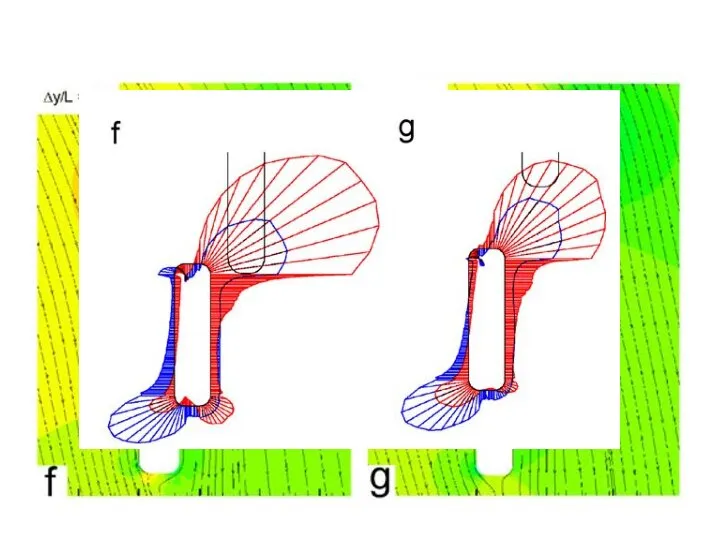
- 9. Aerodynamic Force : Flow Past A Bluff Body Composed of: Turbulent air flow around vehicle body
- 10. Aerodynamic Resistance on Vehicle Dynamic Pressure: Drag Force: Aero Power
- 11. Cd = coefficient of drag ρ = air density ≈ 1.2 kg/m3 A = projected frontal
- 12. Aerodynamic Drag on An Accelerating Vehicles
- 15. Purpose, Shape & Drag
- 16. Shape & Components of Drag
- 17. Some examples of Cd: The typical modern automobile achieves a drag coefficient of between 0.30 and
- 18. 0.42 - Lamborghini Countach, 1974 0.42 - Triumph Spitfire Mk IV, 1971-1980 0.42 - Plymouth Duster,
- 19. 0.34 - Ford Sierra, 1982 0.34 - Ferrari F40, 1987 0.34 - Chevrolet Caprice, 1994-1996 0.34
- 21. Скачать презентацию
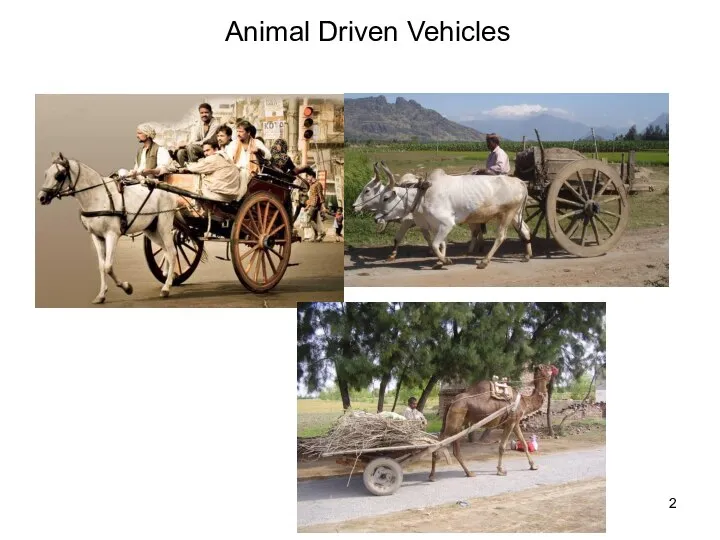
Animal Driven Vehicles
Animal Driven Vehicles
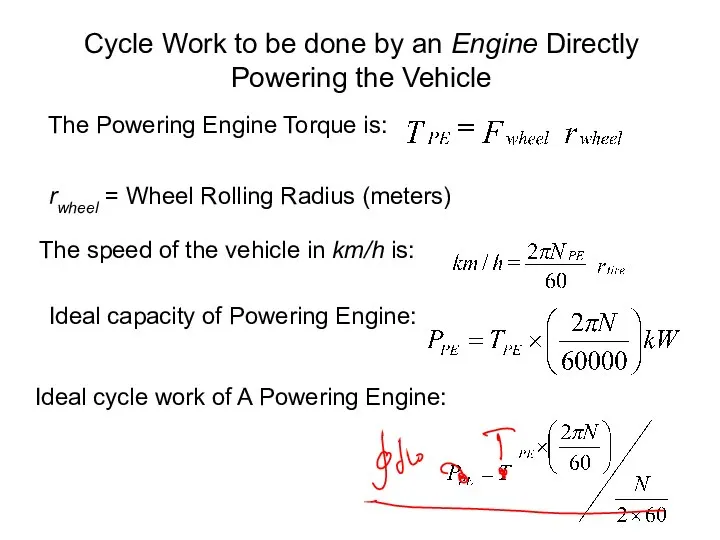
The Powering Engine Torque is:
The speed of the vehicle in km/h
The Powering Engine Torque is:
The speed of the vehicle in km/h
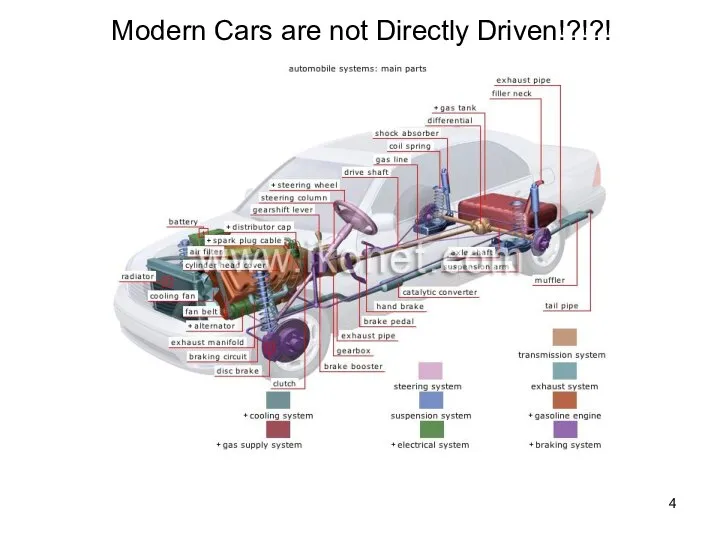
Modern Cars are not Directly Driven!?!?!
Modern Cars are not Directly Driven!?!?!
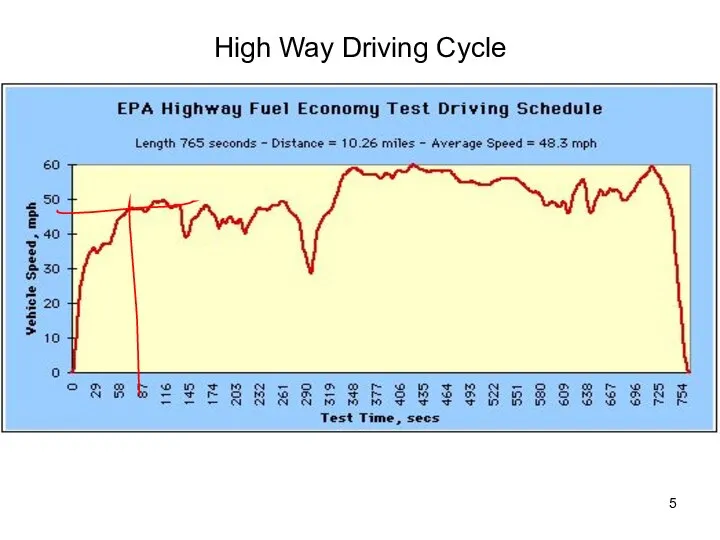
High Way Driving Cycle
High Way Driving Cycle
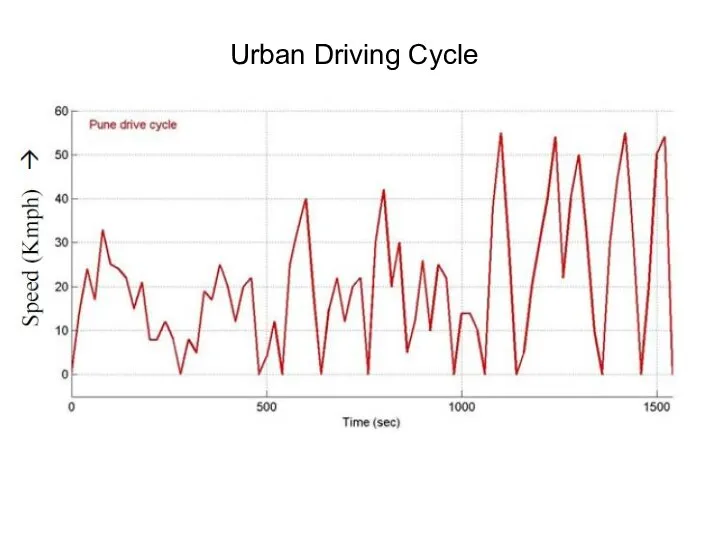
Urban Driving Cycle
Urban Driving Cycle
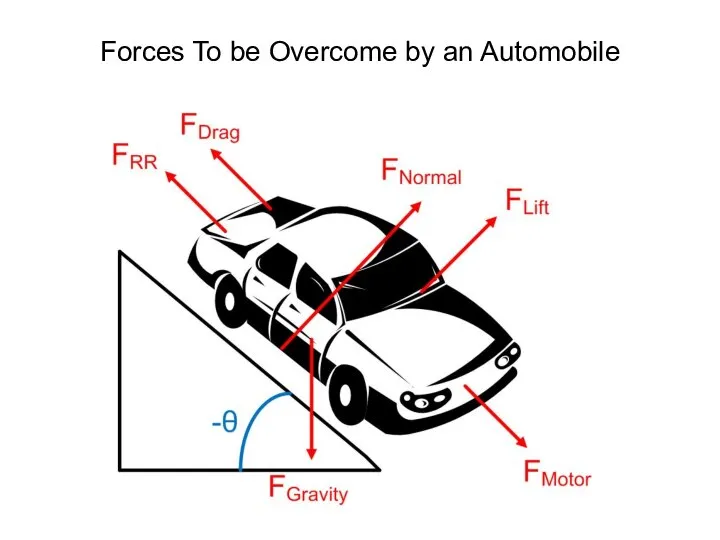
Forces To be Overcome by an Automobile
Forces To be Overcome by an Automobile
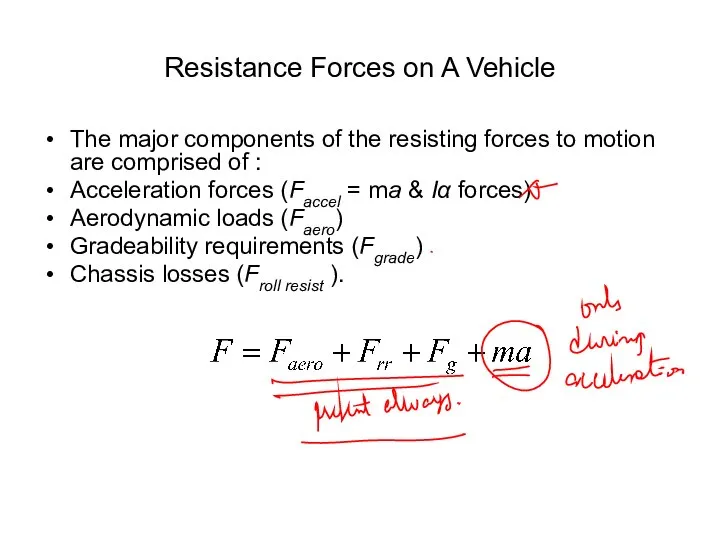
Resistance Forces on A Vehicle
The major components of the resisting forces
Resistance Forces on A Vehicle
The major components of the resisting forces
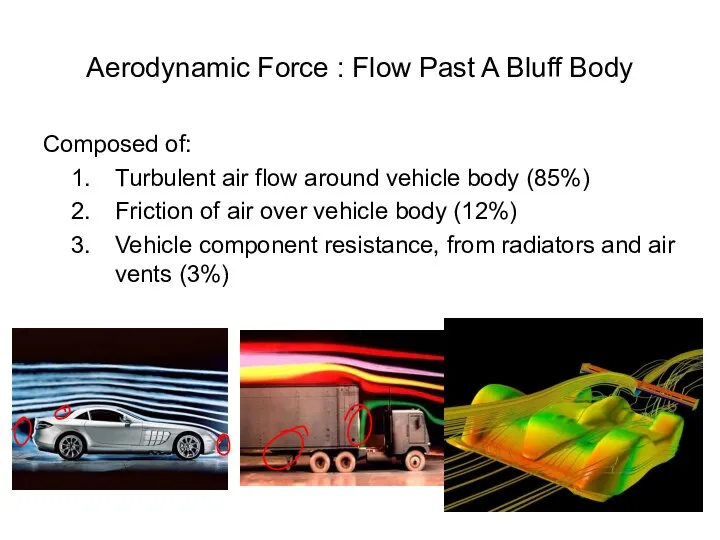
Aerodynamic Force : Flow Past A Bluff Body
Composed of:
Turbulent air flow
Aerodynamic Force : Flow Past A Bluff Body
Composed of:
Turbulent air flow
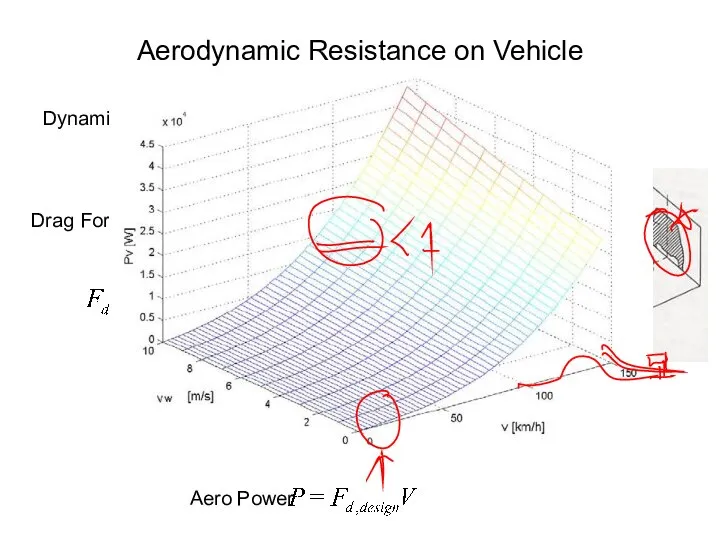
Aerodynamic Resistance on Vehicle
Dynamic Pressure:
Drag Force:
Aero Power
Aerodynamic Resistance on Vehicle
Dynamic Pressure:
Drag Force:
Aero Power
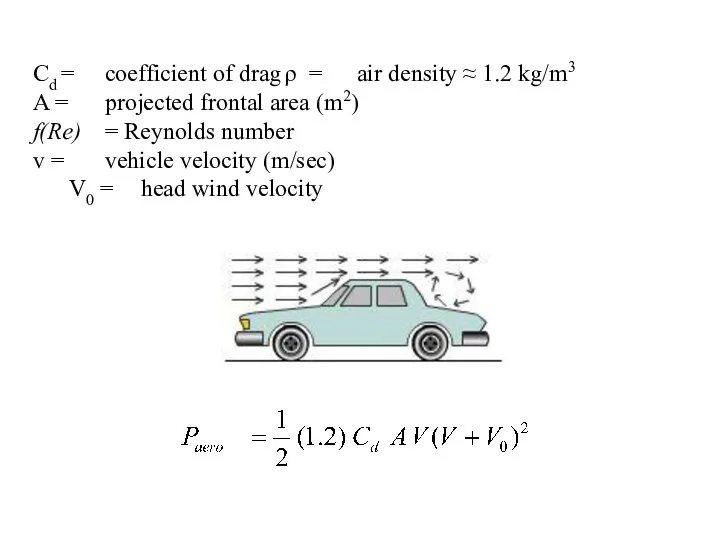
Cd = coefficient of drag ρ = air density ≈ 1.2 kg/m3
A
Cd = coefficient of drag ρ = air density ≈ 1.2 kg/m3
A
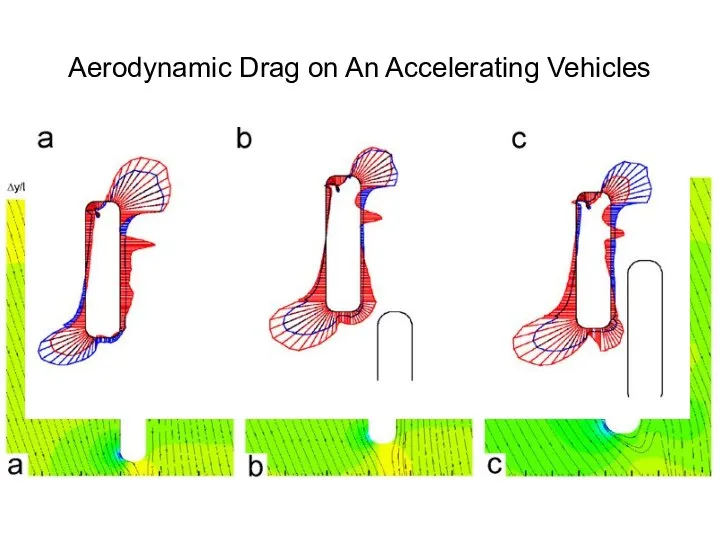
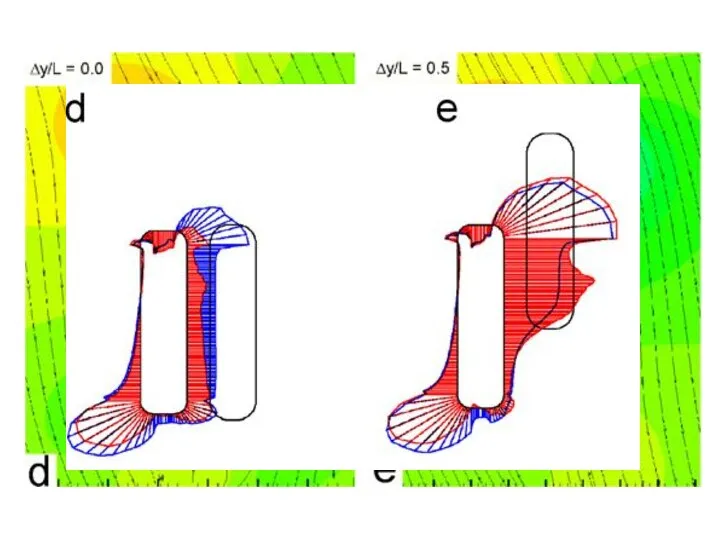
Aerodynamic Drag on An Accelerating Vehicles
Aerodynamic Drag on An Accelerating Vehicles
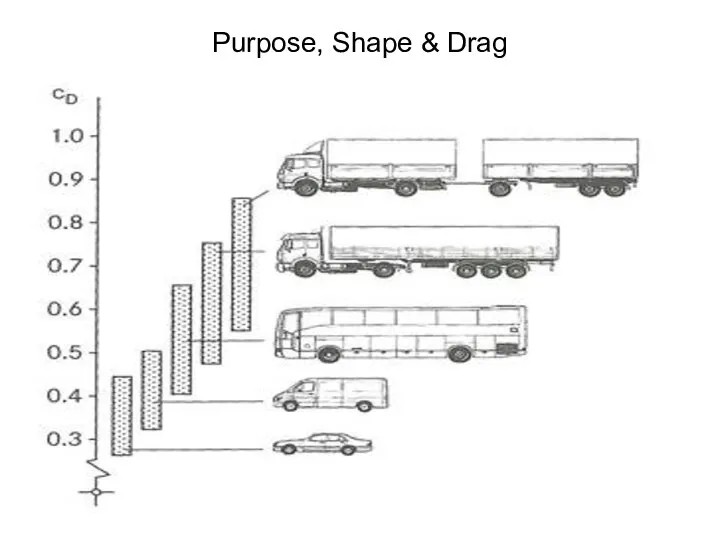
Purpose, Shape & Drag
Purpose, Shape & Drag
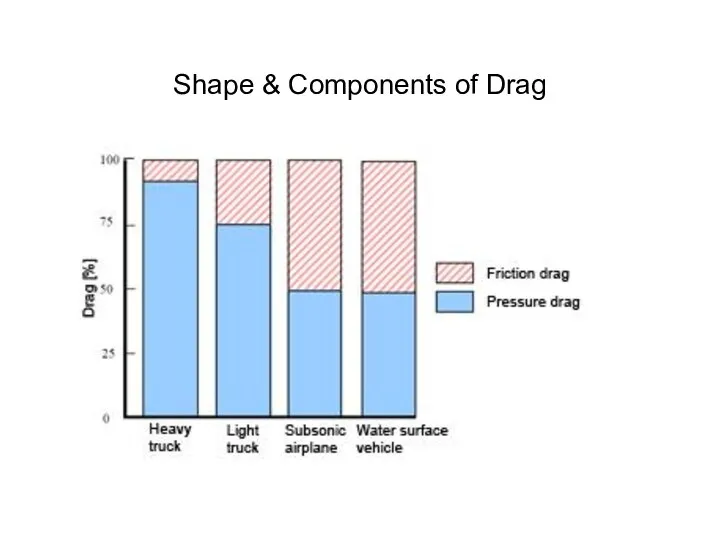
Shape & Components of Drag
Shape & Components of Drag
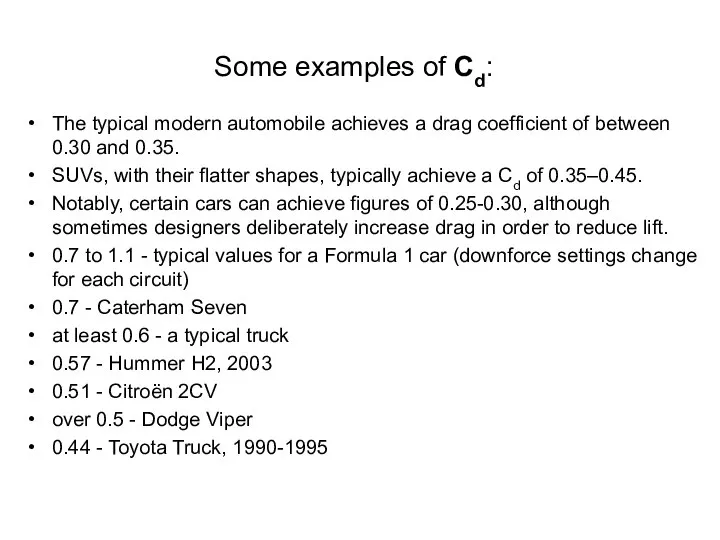
Some examples of Cd:
The typical modern automobile achieves a drag coefficient
Some examples of Cd:
The typical modern automobile achieves a drag coefficient
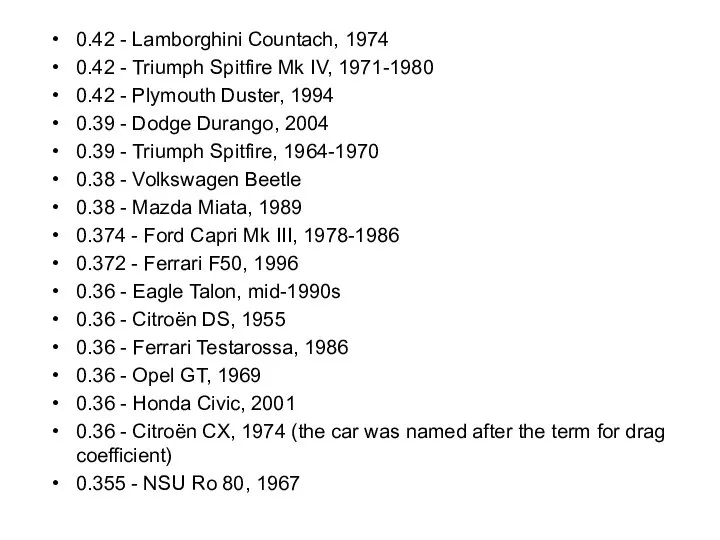
0.42 - Lamborghini Countach, 1974
0.42 - Triumph Spitfire Mk IV,
0.42 - Lamborghini Countach, 1974
0.42 - Triumph Spitfire Mk IV,
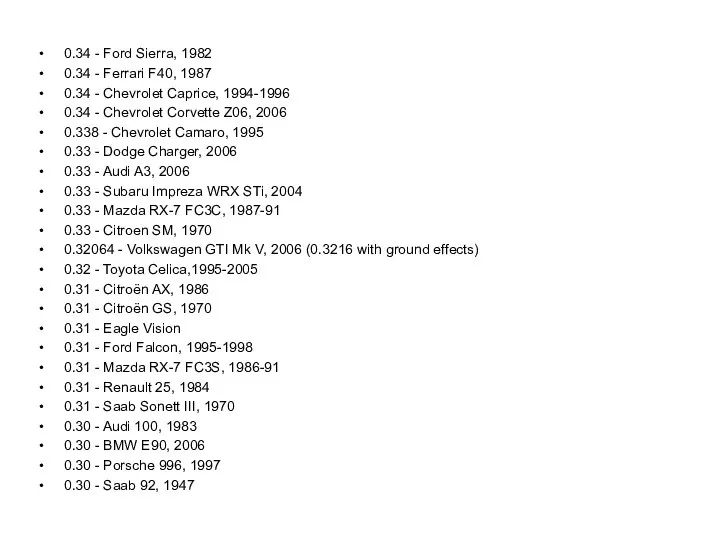
0.34 - Ford Sierra, 1982
0.34 - Ferrari F40, 1987
0.34
0.34 - Ford Sierra, 1982
0.34 - Ferrari F40, 1987
0.34
 Русский язык важен для любой профессии!!!
 Автосцепное устройство
  ВЭБ-инфекция, вводный
 Презентация на тему "Федеральный государственный образовательный стандарт (ФГОС) начального общего образования: цели и содержа
 Аттестационная работа. Методическая разработка в рамках межшкольного взаимодействия «Интерактивный этномузей»
 Генетический код
 7 чудес света
 МАСТЕР - КЛАСС Изучения результатов и эффективности воспитания школьников
 Сын Божий (часть 4)
 Организация труда персонала
 Отсчёт по производственной практике
 Презентация "Картины художника Тойво Васильевича Ряннеля" - скачать презентации по МХК
 эпоха Возрождения» По Культурологии
 НАД СЛАЙДАМИ РАБОТАЛИ УЧЕНИКИ 3Б КЛАССА ИБРАШЕВА ЕВГЕНИЯ, ПРИВАЛОВА ЕКАТЕРИНА, Степанов Александр
 Работа. Кинетическая энергия
 Особенности расследования дорожно-транспортных преступлений
  Разработка мобильной эстакады для транспортных средств категории М1
 А.С.Пушкин Искусство Пушкина
 Партийный проект «Народный контроль»
 Реалии и поэзия пейзажного парка (по лирике А.С. Пушкина)
 Презентация Основные виды и сферы международного страхования
 Презентация на тему "Антидепрессанты" - скачать презентации по Медицине
 Технологическая карта урока как основа проектирования урока Если мы хотим достигнуть какой-нибудь цели воспитанием, то должны п
 Обязательства в гражданском праве
 Королевство Бельгия
 Жизнь и быт монахов
 Управление
 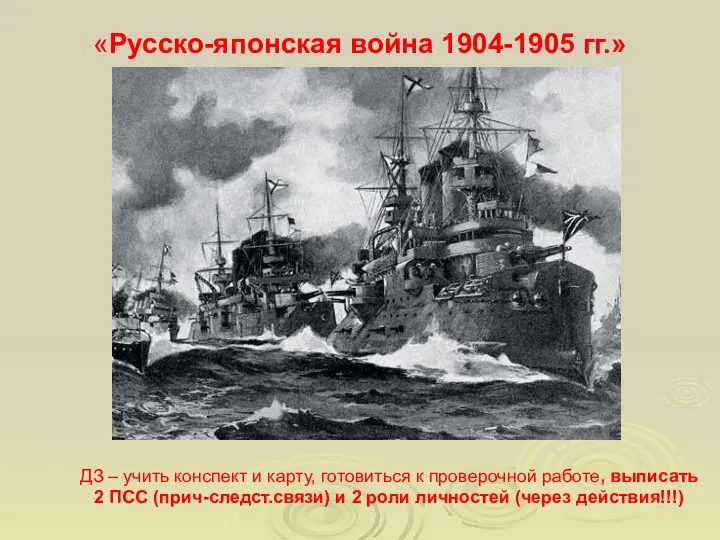 Россия в нач.20в. Р-Яп война