- Describing graphs with trends. Tips and strategies

Содержание
- 2. Academic Writing – formal writing Write in paragraphs (Intro – Overview (main trends) – Details– Details)
- 3. Introduction. Paraphrasing the rubric The task: The chart shows information about visitors to Australia, 2006-2014. You:
- 4. Introduction with uncountable nouns We, basically, just substitute the words “many” and “number” with “much” and
- 5. Overview. Highlighting the key trends Describe general trends (if they were upward or downward) and most
- 6. Some useful language There are two general words for trend – Upward (^) and Downward (v).
- 7. Main body paragraphs (1 or 2) First and foremost, describe changes/details from MORE to LESS noticeable.
- 8. Language to describe changes 1 Put the Past Simple form of these verbs in the correct
- 9. Language to describe changes 1 Key NB it is more effective to memorize patterns of changes
- 10. Language to describe changes 2 Which of these adverbs describe 1.a big change, 2. a small
- 11. Language to describe changes 3 Literally the same words can be used in noun forms (from
- 12. Practice. Adjective + Noun Rewrite these sentences, changing them to verb-adverb or adjective-noun. 1. Sales of
- 13. Look at this task: The given diagram shows how many books were read in Burnaby Public
- 14. Model Answer The provided graph highlights data on the number of books which were read in
- 15. Language use. Linking expressions Linking phrases to introduce new section of a graph: As regards _
- 16. Language use. Prepositions Ss have a handout with the exercises (p. 86). RULES: 1. With started
- 17. Comment on data Make your essay more advanced by commenting on the data. There are a
- 18. More practice Look at he graph and complete the sentences below. 48% of people worked in
- 19. Same kind of data, different form
- 20. Same kind of data, different form 2
- 21. But what if… the diagram shows a future trend? First, remember HOW we talk about future
- 22. Now give it a try! 150 words
- 23. Feel like practicing? Burnaby Public Library – Employment rates in the UK – Travellers using British
- 25. Скачать презентацию
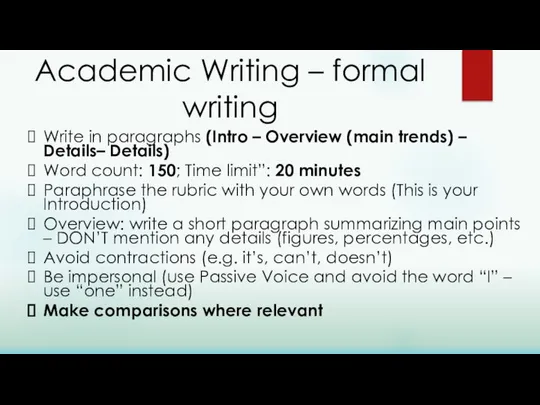
Academic Writing – formal writing
Write in paragraphs (Intro – Overview (main
Academic Writing – formal writing
Write in paragraphs (Intro – Overview (main
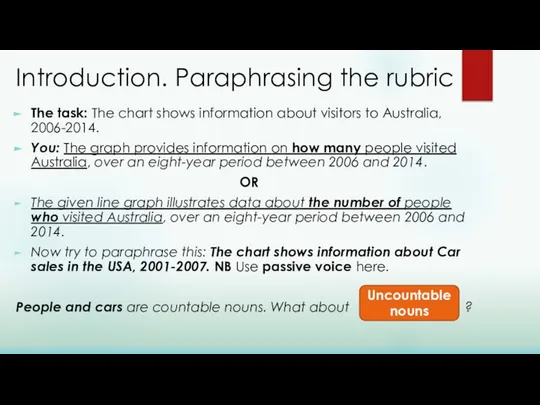
Introduction. Paraphrasing the rubric
The task: The chart shows information about visitors
Introduction. Paraphrasing the rubric
The task: The chart shows information about visitors
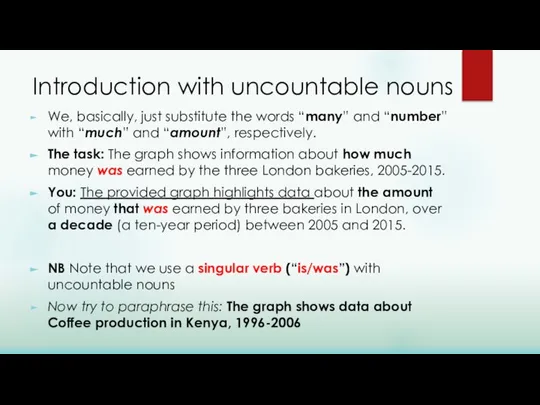
Introduction with uncountable nouns
We, basically, just substitute the words “many” and
Introduction with uncountable nouns
We, basically, just substitute the words “many” and
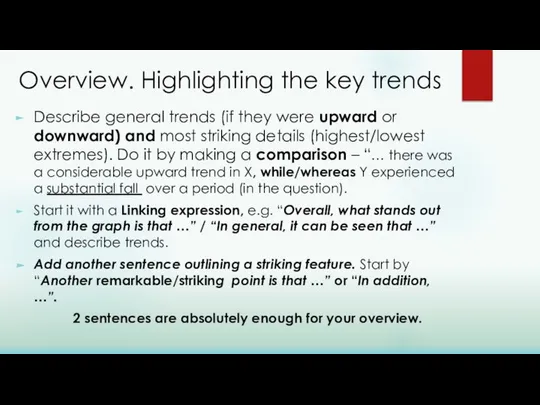
Overview. Highlighting the key trends
Describe general trends (if they were
Overview. Highlighting the key trends
Describe general trends (if they were
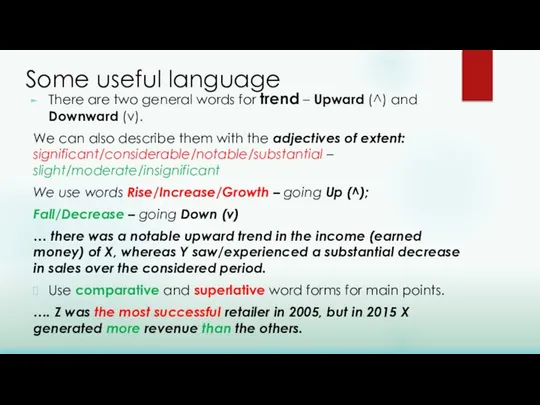
Some useful language
There are two general words for trend – Upward
Some useful language
There are two general words for trend – Upward
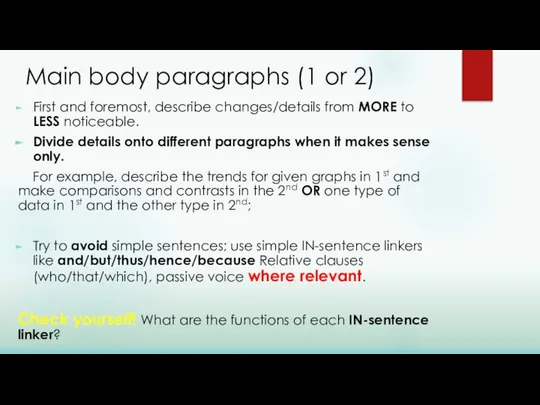
Main body paragraphs (1 or 2)
First and foremost, describe changes/details from
Main body paragraphs (1 or 2)
First and foremost, describe changes/details from
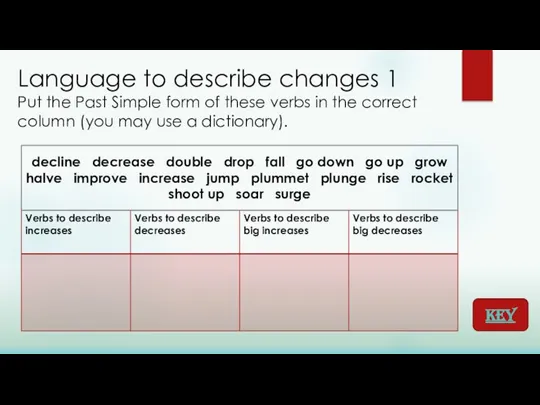
Language to describe changes 1
Put the Past Simple form of these
Language to describe changes 1 Put the Past Simple form of these
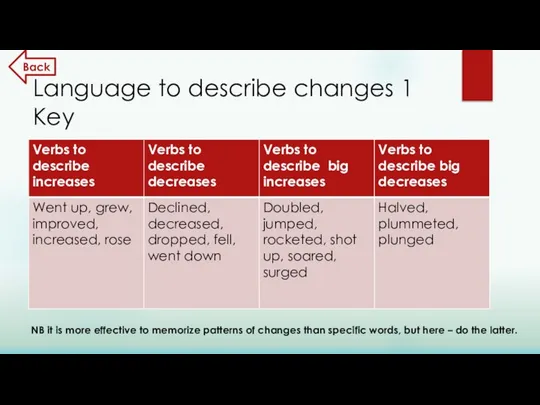
Language to describe changes 1
Key
NB it is more effective to memorize
Language to describe changes 1
Key
NB it is more effective to memorize
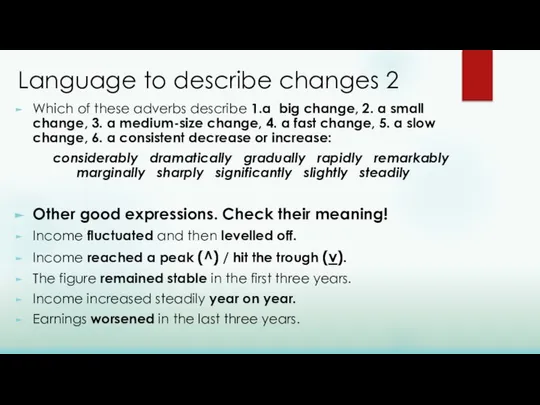
Language to describe changes 2
Which of these adverbs describe 1.a big
Language to describe changes 2
Which of these adverbs describe 1.a big
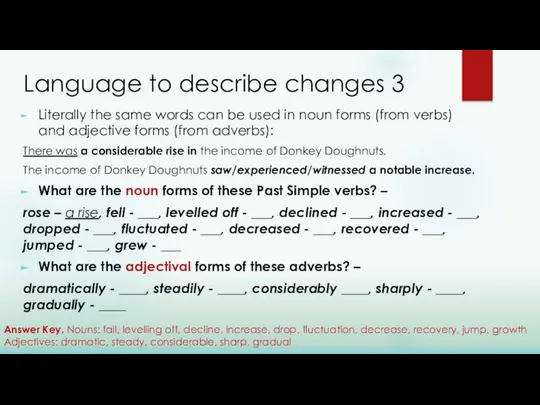
Language to describe changes 3
Literally the same words can be used
Language to describe changes 3
Literally the same words can be used

Practice. Adjective + Noun
Rewrite these sentences, changing them to verb-adverb or
Practice. Adjective + Noun
Rewrite these sentences, changing them to verb-adverb or
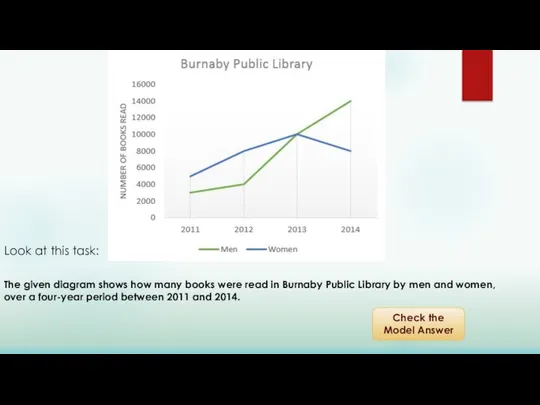
Look at this task:
The given diagram shows how many books were
Look at this task:
The given diagram shows how many books were
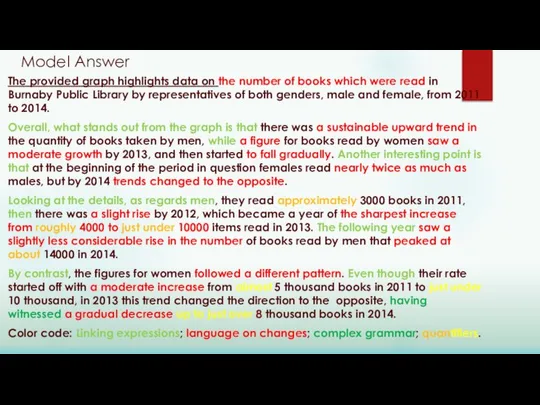
Model Answer
The provided graph highlights data on the number of books
Model Answer
The provided graph highlights data on the number of books
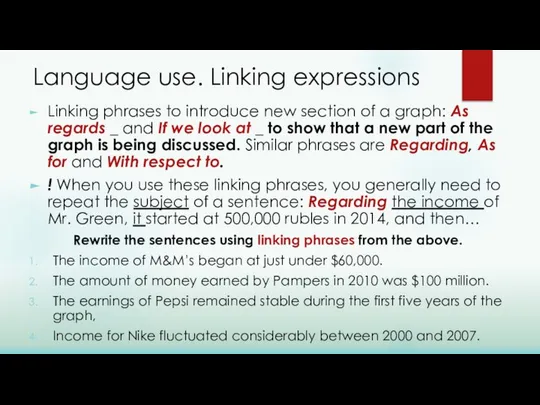
Language use. Linking expressions
Linking phrases to introduce new section of a
Language use. Linking expressions
Linking phrases to introduce new section of a
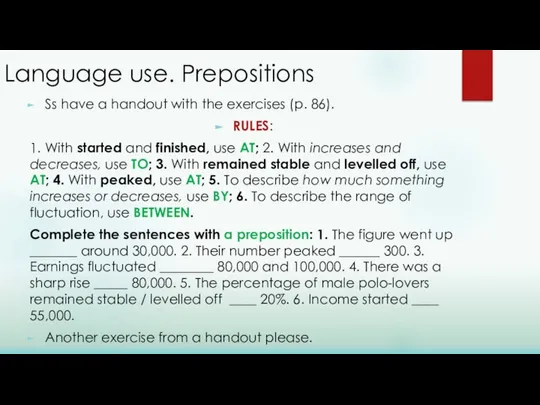
Language use. Prepositions
Ss have a handout with the exercises (p. 86).
RULES:
Language use. Prepositions
Ss have a handout with the exercises (p. 86).
RULES:
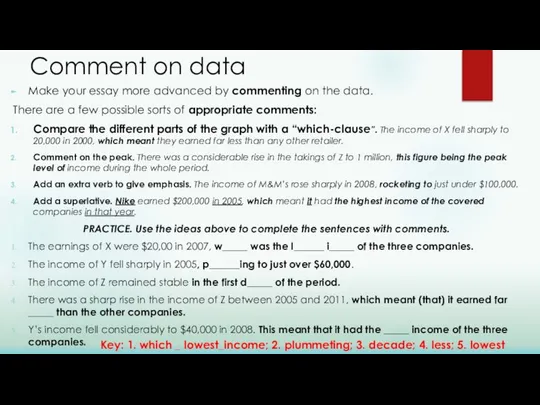
Comment on data
Make your essay more advanced by commenting on the
Comment on data
Make your essay more advanced by commenting on the

More practice
Look at he graph and complete the sentences below.
48% of
More practice
Look at he graph and complete the sentences below.
48% of
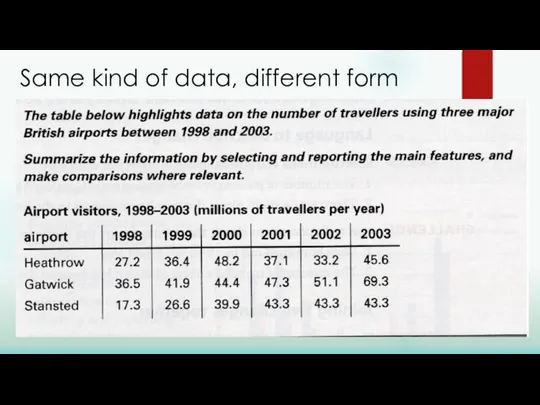
Same kind of data, different form
Same kind of data, different form
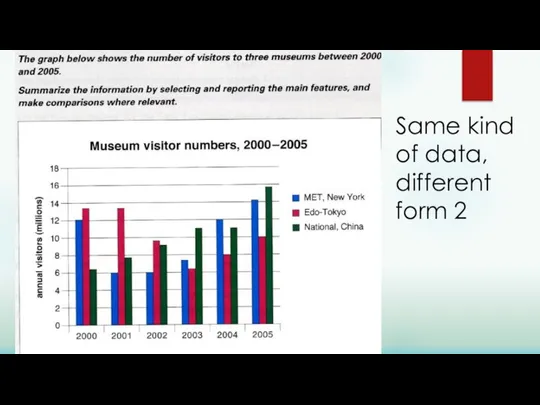
Same kind
of data,
different
form 2
Same kind
of data,
different
form 2
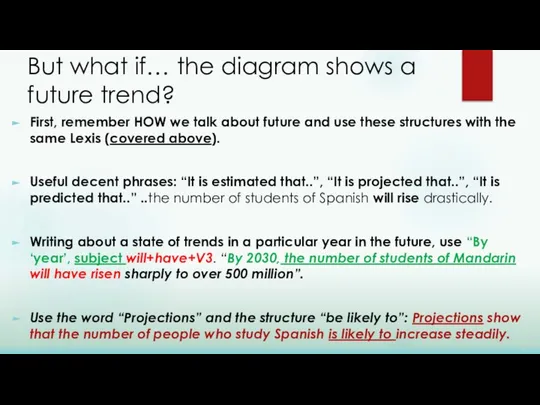
But what if… the diagram shows a future trend?
First, remember HOW
But what if… the diagram shows a future trend?
First, remember HOW
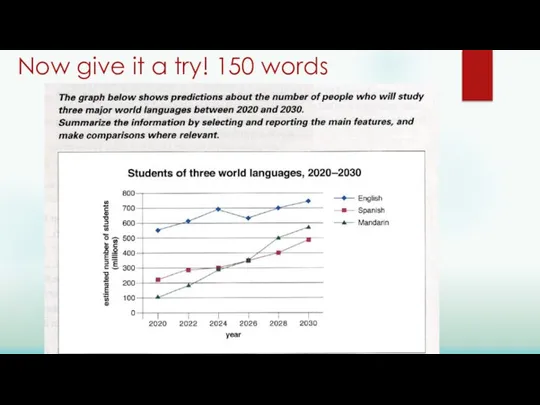
Now give it a try! 150 words
Now give it a try! 150 words
Feel like practicing?
Burnaby Public Library –
Employment rates in the UK
Feel like practicing?
Burnaby Public Library –
Employment rates in the UK
 ARE YOU GOING TO LIVE TO 100?
 Early Industry and Inventions
 LEWIS CARROLL YEARS OF LIFE 1832—1898
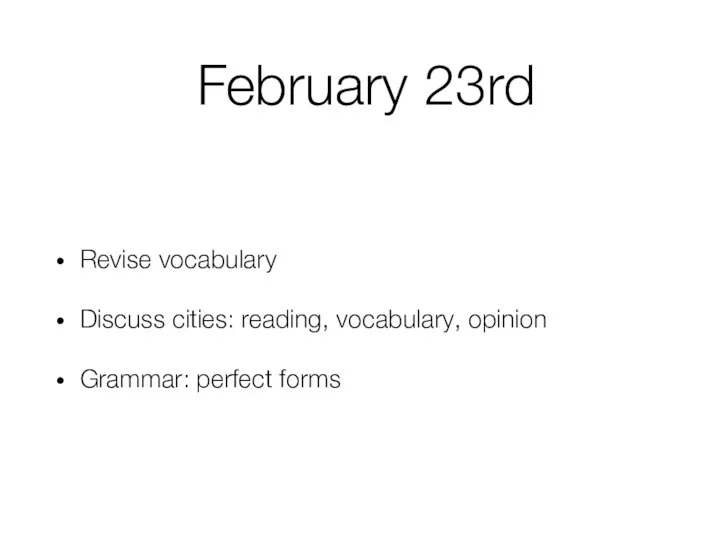 Revise vocabulary Discuss cities: reading, vocabulary, opinion Grammar: perfect forms
 Travel, trip, journey, voyage, crossing
 Презентация к уроку английского языка "Welcome to our Winnie the Witch Party!" - скачать
  Презентация к уроку английского языка "Как правильно задать вопрос" - скачать бесплатно
 Презентация на тему: « Famous British People» Автор разработки: ученица 7-В класса ГБОУ СОШ №797 ВАО города Москвы,Давыдова Елена Константино
 МОУ «Береговская СОШ» учитель иностранного языка Жирнова Наталья Леонидовна. Презентация по теме «Известные люди Урала» для зан
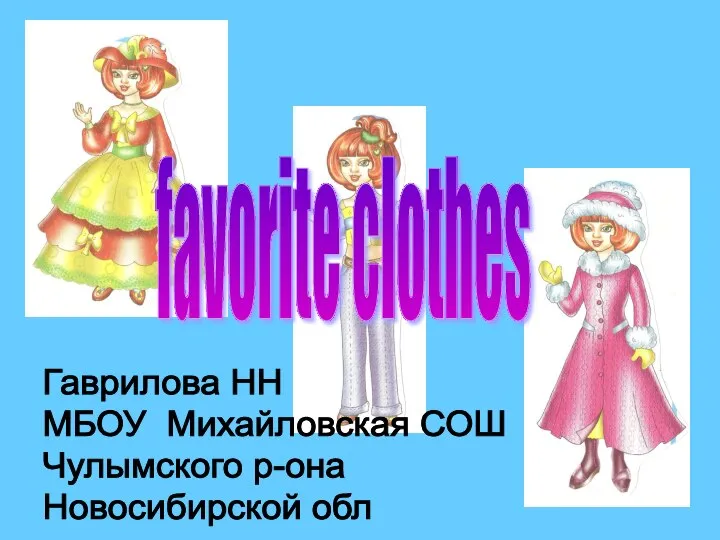 Презентация к уроку английского языка "FAVORITE CLOTHES (ЛЮБИМАЯ ОДЕЖДА)" - скачать бесплатно
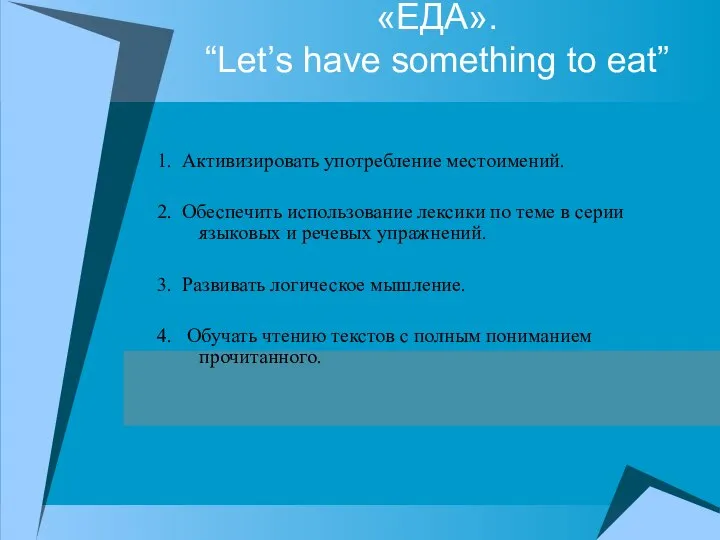 «ЕДА». “Let’s have something to eat” 1. Активизировать употребление местоимений. 2. Обеспечить использование лексики по теме в серии языковых и речевых упражнений. 3. Развивать логическое мышление. 4. Обучать чтению текстов с полным пониман
 Лексические проблемы перевода
 Презентация к уроку английского языка "Словообразование с помощью суффиксов в английском языке" - скачать
  Презентация к уроку английского языка "Glamour" - скачать бесплатно
 Family and friends (unit 11)
 Verbs
Verbs Psychoactive substances and drugs. Antidepressants Zvereva Mila school of pharmacy
 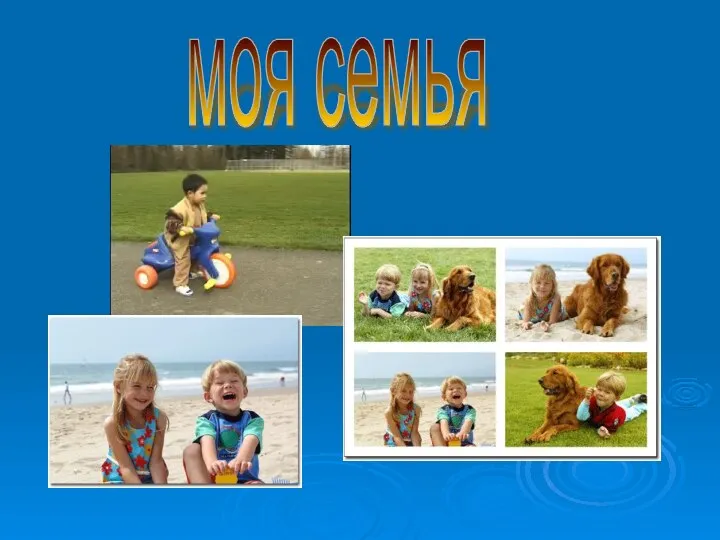 моя семья - Презентация к уроку английского языка_
 My dream house
 English
 Billy Goats scavenger hunt
 Презентация к уроку английского языка "Традиции России" - скачать бесплатно
 МОУ Юрцовская средняя общеобразовательная школа Егорьевского района Московской области
 NO RISK -- NO FUN!
 Презентация выполнила ученица г.Нижневартовска 5б класса мосш №29 Яковлева Анастасия
 Pickpocketing
 SPEAKING ABOUT THE PAST
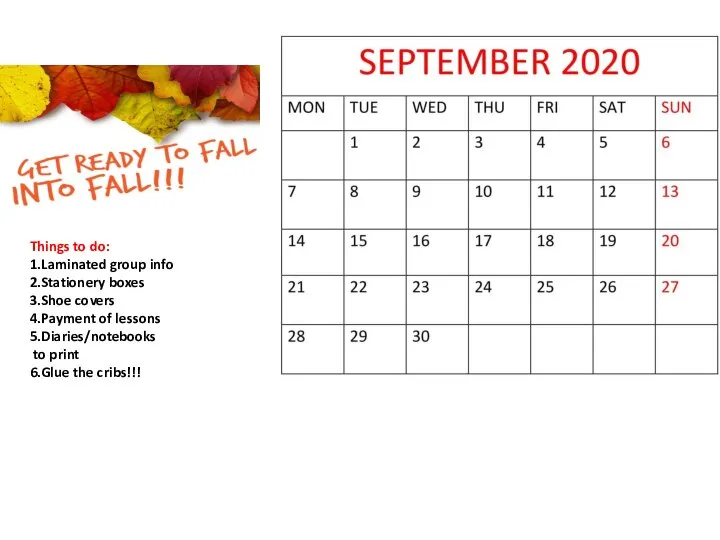 Things to do