- Economics and management of network. Industries

Содержание
- 2. I. Cost structure of the Electricity Business. II. Capital Cost Analysis. III. Economic and Financial Analysis.
- 3. III. ECONOMIC & FINANCIAL ANALYSIS. RATIOS
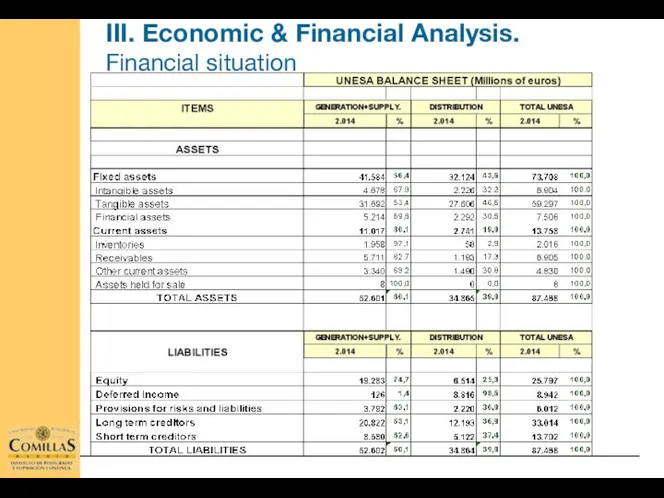
- 4. III. Economic & Financial Analysis. Financial situation
- 5. ELECTRICITY BUSINESS Permanent Financing – 84.4% Current Liabilities – 15.6% Assets - 15.7% Equity – 39.7%
- 6. ELECTRICITY BUSINESS Equity Working capital* Fixed assets Net Debt III. Economic & Financial Analysis. Financial situation
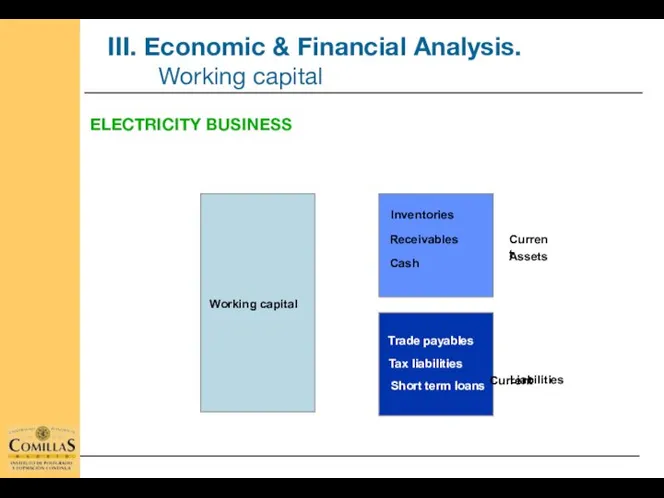
- 7. ELECTRICITY BUSINESS Inventories Working capital III. Economic & Financial Analysis. Working capital Trade payables Tax liabilities
- 8. Current ratio = Current assets / Current liabilities LIQUIDITY RATIOS Quick ratio = (Current assets –
- 9. LIQUIDITY CHART AT YEAR END 2013
- 10. The business return is the main performance indicator and the most frequently used by stake holders.
- 11. FINANCIAL RETURN Relationship between earnings after taxes (net income) and equity. Return indicator to be used
- 12. R.O.A = EBIT (1-t) / Total net assets EBIT : Earnings before interest and Corporate Tax.
- 13. RETURN ON EQUITY DEBT
- 14. ECONOMIC RETURN R.O.A. = x = x EBIT / Sales = Sale margin Sales / Net
- 15. FINANCIAL RETURN AND FINANCIAL LEVERAGE (1) R.O.E. = R.O.E. = x x x x R.O.E. =
- 16. FINANCIAL RETURN AND FINANCIAL LEVERAGE (2) = Asset Rotation = Sales margin = Financial Leverage =
- 17. FINANCIAL RETURN AND FINANCIAL LEVERAGE (3) Financial Return (i.e. Equity Return) can be also analysed as
- 18. FINANCIAL RETURN AND FINANCIAL LEVERAGE (4) R.O.E. = = EBT Equity = = - = =
- 19. I. Cost structure of the Electricity Business. II. Capital Cost Analysis. III. Economic and Financial Analysis.
- 20. III. ECONOMIC & FINANCIAL ANALYSIS. STOCK MARKET RATIOS
- 21. Earnings per share Dividend per share Yield Pay - out PER EV / Sales EV /
- 22. STOCK MARKET RATIOS: Earnings per share Earnings = Net income Net income ENEL(1) = 3,032 €m.
- 23. STOCK EXCHANGE RATIOS : Dividend per share Dividend = Distributed income Dividends ENEL = 1,506 €m
- 24. STOCK EXCHANGE RATIOS: Pay - out Pay - out = Distributed income / Net income Distributed
- 25. STOCK EXCHANGE RATIOS: Price Earning Ratio (PER) Net income Market Capitalisation ENEL = 39,739 €m Net
- 26. P.E.R. and E.P.S. Growth expectations
- 27. STOCK EXCHANGE RATIOS: EV / EBITDA Enterprise Value = Average Ratio x EBITDA IBE EV /
- 28. EV / Ebitda and Ebitda Growth expectations
- 29. I. Cost structure of the Electricity Business. II. Capital Cost Analysis. III. Economic and Financial Analysis.
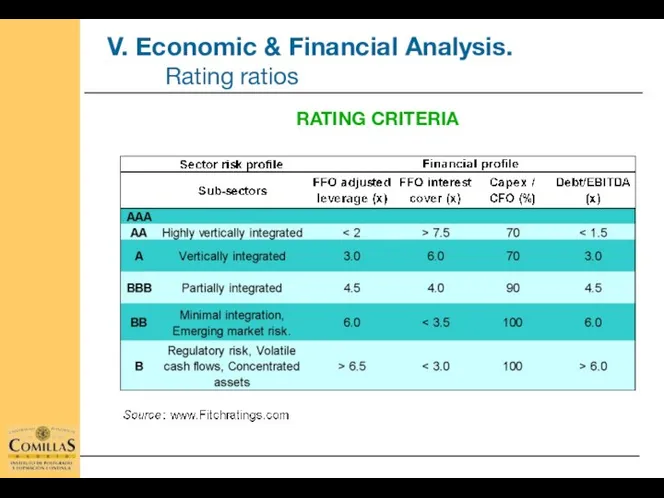
- 30. RATING CRITERIA
- 31. FFO adjusted leverage (x) FFO interest cover (x) Capex / FFO (%) Debt / Ebitda (x)
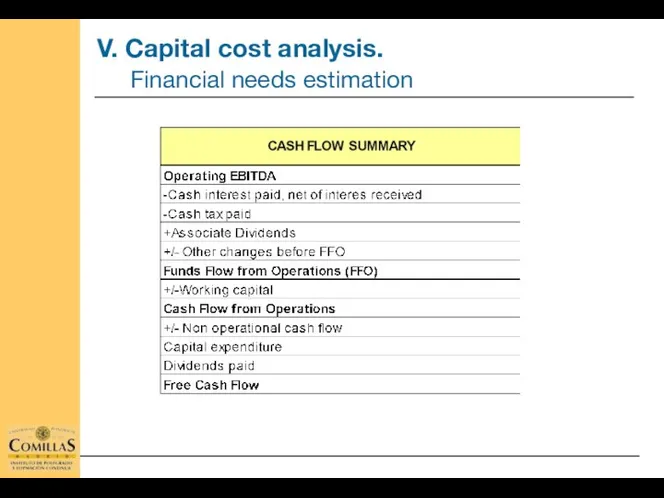
- 32. V. Capital cost analysis. Financial needs estimation
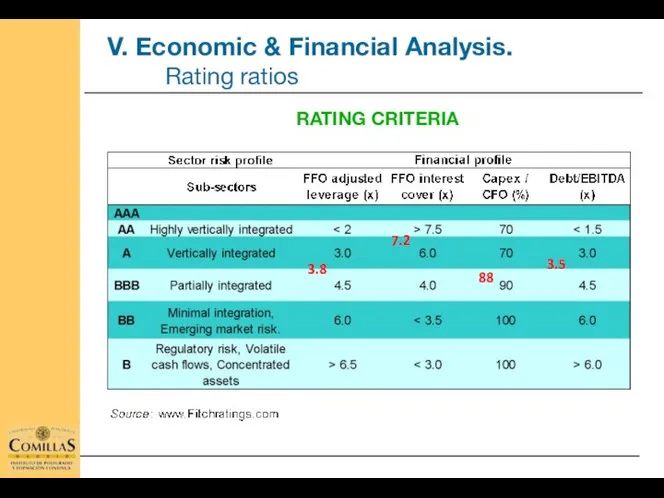
- 33. FFO adjusted leverage = = 3.8 FFO interest cover = = 7.2 Capex / FFO =
- 34. RATING CRITERIA 3.5 88 7.2 3.8
- 36. Скачать презентацию

I. Cost structure of the Electricity Business.
II. Capital Cost Analysis.
III. Economic and Financial
I. Cost structure of the Electricity Business.
II. Capital Cost Analysis.
III. Economic and Financial
III. ECONOMIC & FINANCIAL ANALYSIS. RATIOS
III. ECONOMIC & FINANCIAL ANALYSIS. RATIOS
III. Economic & Financial Analysis.
Financial situation
III. Economic & Financial Analysis.
Financial situation
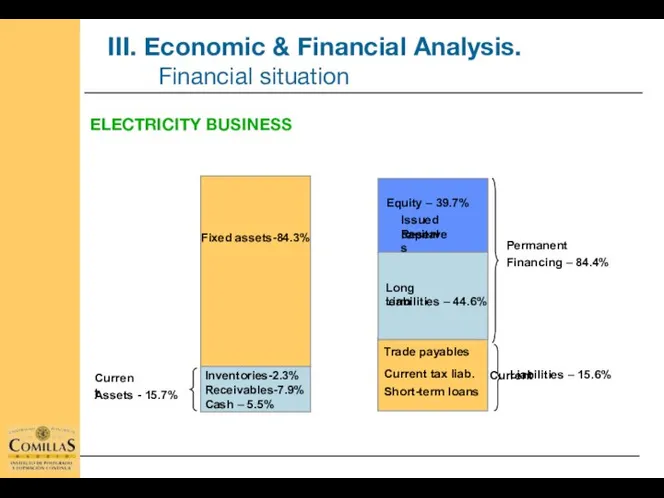
ELECTRICITY BUSINESS
Permanent
Financing – 84.4%
Current
Liabilities – 15.6%
Assets -
ELECTRICITY BUSINESS
Permanent
Financing – 84.4%
Current
Liabilities – 15.6%
Assets -

ELECTRICITY BUSINESS
Equity
Working capital*
Fixed assets
Net Debt
III. Economic & Financial Analysis.
Financial situation
(*)
ELECTRICITY BUSINESS
Equity
Working capital*
Fixed assets
Net Debt
III. Economic & Financial Analysis.
Financial situation
(*)
ELECTRICITY BUSINESS
Inventories
Working capital
III. Economic & Financial Analysis.
Working capital
Trade payables
Tax liabilities
Short term
ELECTRICITY BUSINESS
Inventories
Working capital
III. Economic & Financial Analysis.
Working capital
Trade payables
Tax liabilities
Short term
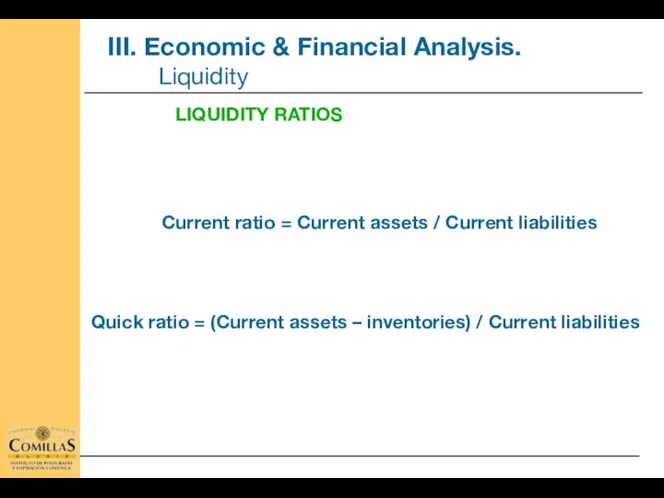
Current ratio = Current assets / Current liabilities
LIQUIDITY RATIOS
Quick ratio =
LIQUIDITY RATIOS
Quick ratio =
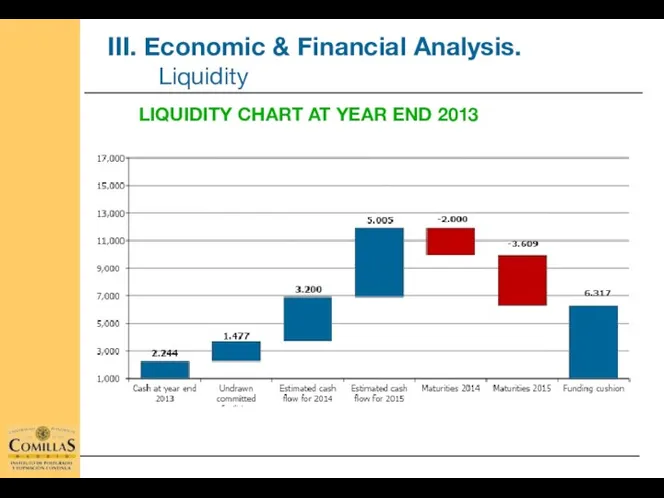
LIQUIDITY CHART AT YEAR END 2013
LIQUIDITY CHART AT YEAR END 2013

The business return is the main performance indicator and the most

FINANCIAL RETURN
Relationship between earnings after taxes (net income) and equity.
Return indicator
FINANCIAL RETURN
Relationship between earnings after taxes (net income) and equity.
Return indicator
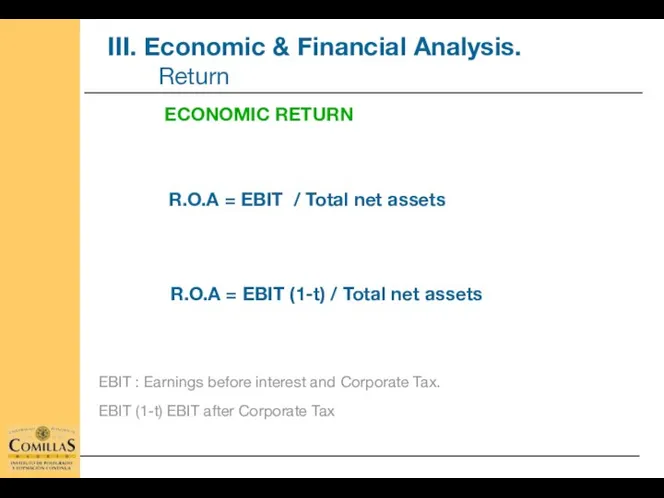
R.O.A = EBIT (1-t) / Total net assets
EBIT : Earnings before
EBIT : Earnings before
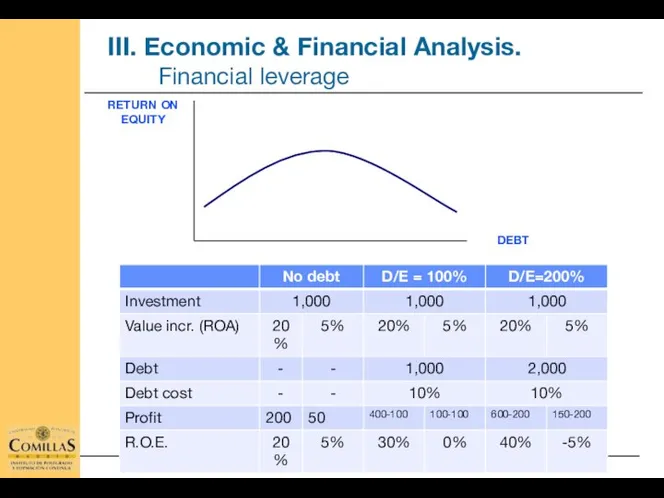
RETURN ON EQUITY
DEBT
RETURN ON EQUITY
DEBT

ECONOMIC RETURN
R.O.A. = x = x
EBIT / Sales =
ECONOMIC RETURN
R.O.A. = x = x
EBIT / Sales =

FINANCIAL RETURN AND FINANCIAL LEVERAGE (1)
R.O.E. =
R.O.E. = x x x
FINANCIAL RETURN AND FINANCIAL LEVERAGE (1)
R.O.E. =
R.O.E. = x x x

FINANCIAL RETURN AND FINANCIAL LEVERAGE (2)
= Asset Rotation
= Sales margin
= Financial
= Asset Rotation
= Sales margin
= Financial

FINANCIAL RETURN AND FINANCIAL LEVERAGE (3)
Financial Return (i.e. Equity Return) can
FINANCIAL RETURN AND FINANCIAL LEVERAGE (3)
Financial Return (i.e. Equity Return) can

FINANCIAL RETURN AND FINANCIAL LEVERAGE (4)
R.O.E. = =
EBT
Equity
=
=
-
=
=
-
=
x
-
=
+
R.O.E.
FINANCIAL RETURN AND FINANCIAL LEVERAGE (4)
R.O.E. = =
EBT
Equity
=
=
-
=
=
-
=
x
-
=
+
R.O.E.

I. Cost structure of the Electricity Business.
II. Capital Cost Analysis.
III. Economic and Financial
I. Cost structure of the Electricity Business.
II. Capital Cost Analysis.
III. Economic and Financial

III. ECONOMIC & FINANCIAL ANALYSIS. STOCK MARKET RATIOS
III. ECONOMIC & FINANCIAL ANALYSIS. STOCK MARKET RATIOS

Earnings per share
Dividend per share
Yield
Pay - out
PER
EV / Sales
EV / EBITDA
Price
Earnings per share
Dividend per share
Yield
Pay - out
PER
EV / Sales
EV / EBITDA
Price
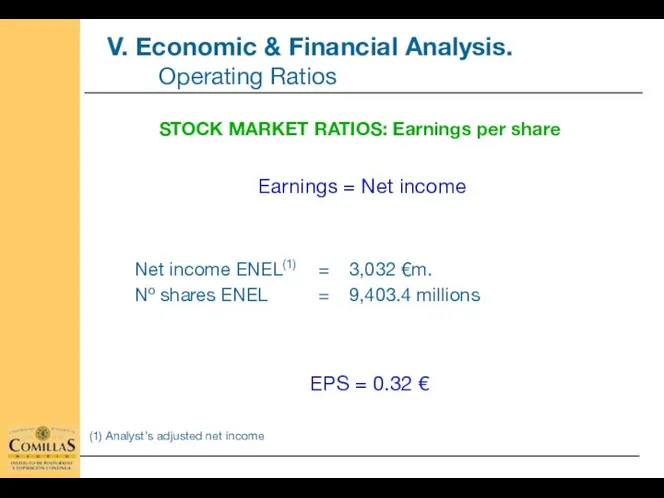
STOCK MARKET RATIOS: Earnings per share
Earnings = Net income
Net income ENEL(1)
STOCK MARKET RATIOS: Earnings per share
Earnings = Net income
Net income ENEL(1)
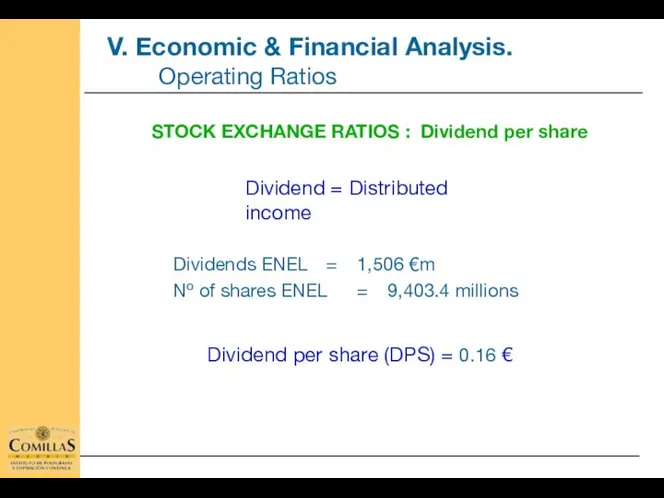
STOCK EXCHANGE RATIOS : Dividend per share
Dividend = Distributed income
Dividends ENEL
STOCK EXCHANGE RATIOS : Dividend per share
Dividend = Distributed income
Dividends ENEL

STOCK EXCHANGE RATIOS: Pay - out
Pay - out = Distributed income
STOCK EXCHANGE RATIOS: Pay - out
Pay - out = Distributed income
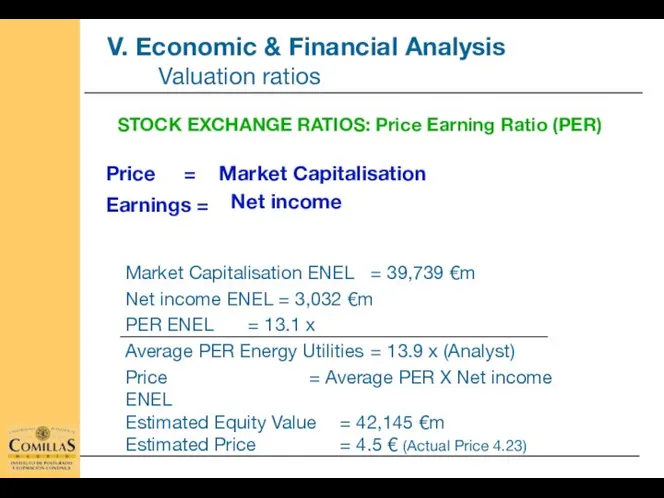
STOCK EXCHANGE RATIOS: Price Earning Ratio (PER)
Net income
Market Capitalisation ENEL = 39,739
STOCK EXCHANGE RATIOS: Price Earning Ratio (PER)
Net income
Market Capitalisation ENEL = 39,739

P.E.R. and E.P.S. Growth expectations
P.E.R. and E.P.S. Growth expectations

STOCK EXCHANGE RATIOS: EV / EBITDA
Enterprise Value = Average Ratio x
STOCK EXCHANGE RATIOS: EV / EBITDA
Enterprise Value = Average Ratio x
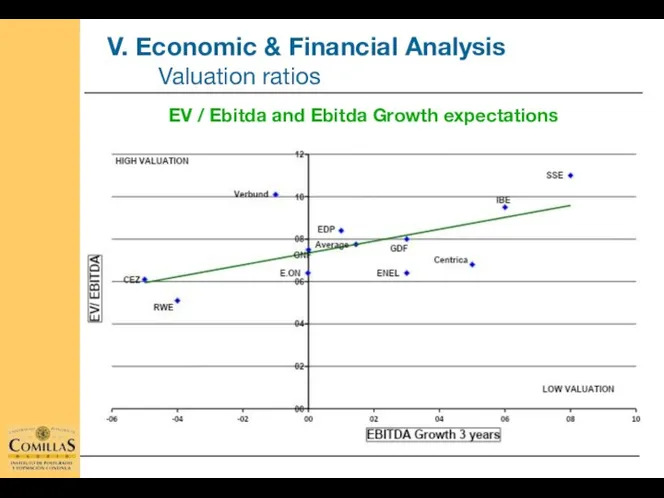
EV / Ebitda and Ebitda Growth expectations
EV / Ebitda and Ebitda Growth expectations

I. Cost structure of the Electricity Business.
II. Capital Cost Analysis.
III. Economic and Financial
I. Cost structure of the Electricity Business.
II. Capital Cost Analysis.
III. Economic and Financial
RATING CRITERIA
RATING CRITERIA

FFO adjusted leverage (x)
FFO interest cover (x)
Capex / FFO (%)
Debt /
FFO adjusted leverage (x)
FFO interest cover (x)
Capex / FFO (%)
Debt /
V. Capital cost analysis.
Financial needs estimation
V. Capital cost analysis.
Financial needs estimation

FFO adjusted leverage = = 3.8
FFO interest cover = =
FFO interest cover = =
RATING CRITERIA
3.5
88
7.2
3.8
RATING CRITERIA
3.5
88
7.2
3.8
 Заключительные положения управления проектами. Эффективность управления проектами
 Понятие и виды агропромышленной интеграции
 Проблемы реализации государственной программы РФ «Социально-экономическое развитие Калининградской области»
 Лозанская школа маржинализма
 Применение имитационного моделирования в экономике
 International Trade: Theory and Policy. Differences between countries. Lecture 8
 Производство на предприятии. Производственный цикл
 Рынок, цена и конкуренция
 Тест по философии Средневековая философия
 Планирование процессов управления качеством на машиностроительном предприятии
 Экономика и управление организацией (отраслевой аспект). Магистерская программа
 Определение эконометрики
 Independence work
 Проблема преодоления отсталости развивающихся стран
 Теорії конкурентоспроможності регіону
 Экономика. Что изучает экономика
 Эффективная модель передачи технологий
 Реализованные инвестиционные проекты
 Спрос. Величина спроса
 Трудовая миграция в Чехии
 Валовий внутрішній продукт та інші макроекономічні показники. (Тема 2)
 Презентация-тренажёр для подготовки к ГИА по обществознанию
 Унікальність ресурсного потенціалу Одеської області
 Державне регулювання розвитку промислового виробництва і агропромислового комплексу. (Тема 2)
 Научно-техническая революция (НТР)
 Институциональный анализ прав собственности
 Презентация Блиц-опрос Дипломатия
 Презентация по экономике косвенные налоги