- Production and growth

Содержание
- 2. Economic Growth Economic growth is a long-term expansion of the productive potential of the economy. Growth
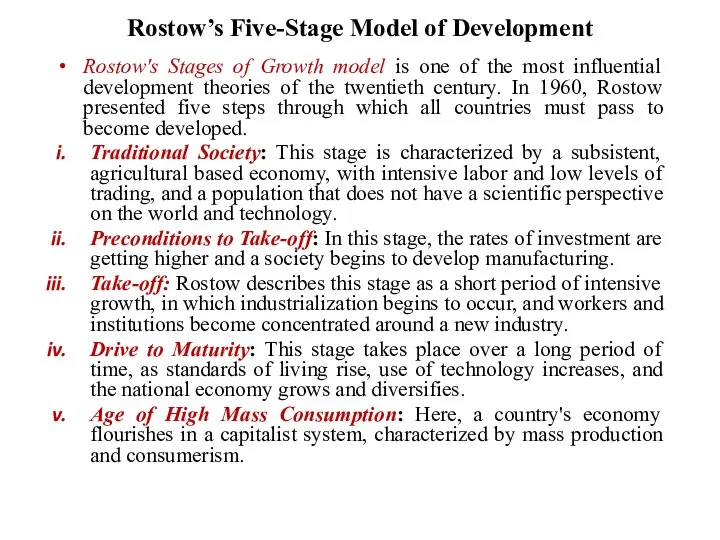
- 3. Rostow’s Five-Stage Model of Development Rostow's Stages of Growth model is one of the most influential
- 4. Rostow’s Five-Stage Model of Development
- 5. Modernization Theory Linear stages of development
- 6. Economic Growth Growth rate How rapidly real GDP per person grew in the typical year. Growth
- 7. The Variety of Growth Experiences
- 8. Productivity Productivity Quantity of goods and services Produced from each unit of labor input Why productivity
- 9. Productivity Determinants of productivity Physical capital Stock of equipment and structures Used to produce goods and
- 10. Productivity Determinants of productivity Natural resources Inputs into the production of goods and services Provided by
- 11. Additionally, other explanations have highlighted the significant role of non-economic factors. These include institutional economics which
- 12. Solow's Neoclassical Model or Exogenous Growth Model The Sources of Economic Growth Production function Y= AF(K,
- 13. This can be transformed into a linear model by taking natural logs of both sides: ln
- 14. The slope coefficients can be interpreted as elasticities. If (α + β) = 1, we have
- 16. Neoclassical Production Functions The Cobb-Douglas production function is expressed as: Hence, now have y = output
- 17. GDP per worker and k Assume A and L constant (no technology growth or labour force
- 18. Diminishing Returns The neo-classical growth theory of Solow (1956) and Swan (1956) postulates that capital accumulations
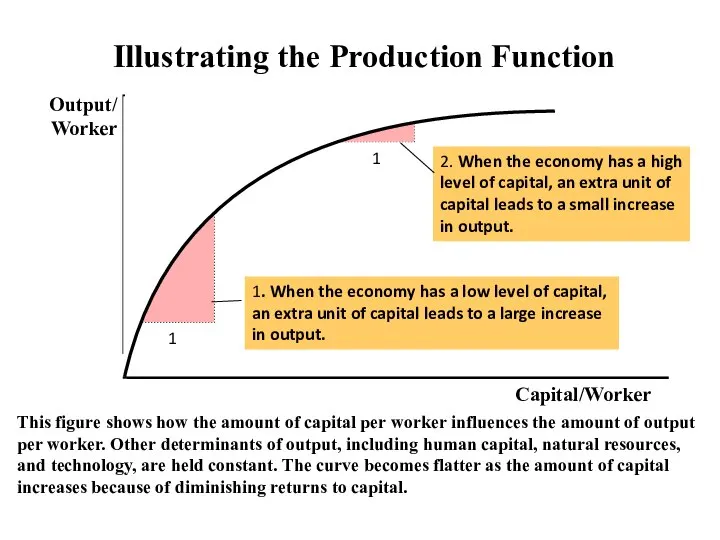
- 19. Illustrating the Production Function This figure shows how the amount of capital per worker influences the
- 20. Diminishing Returns If the variable factor of production increases, the output will increase up to a
- 21. Catch-up effect (Convergence) Countries that start off poor tend to grow more rapidly than countries that
- 22. A second approach explains convergence as resulting primarily from cross- country knowledge spillovers. The process of
- 23. World’s ten fastest-growing economies
- 24. What causes the differences in income over time and across countries? The Solow growth model shows
- 25. Investment refers to the expenditure on new plant and equipment, and it causes the capital stock
- 26. Depreciation is the amount of capital that wears out each period ~ 10 percent/year. kt+1 =kt
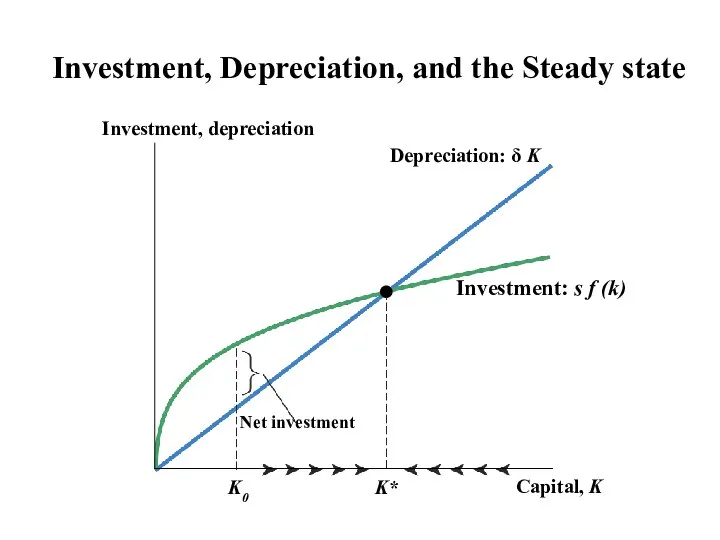
- 27. Depreciation: δ K Investment: s f (k) Investment, Depreciation, and the Steady state
- 28. The steady-state level of capital K* is the level at which investment equals depreciation, indicating that
- 29. The major accomplishment of the Solow model is the principle of transition dynamics, which states that
- 30. Investment, Depreciation and Output Output: Y Depreciation: δ K Investment: s Y
- 31. Solving Mathematically for the Steady State In the steady state, investment equals depreciation and we can
- 32. Understanding Differences in Growth Rates OECD countries that were relatively poor in 1960 grew quickly while
- 33. Some Things to Notice The farther the economy starts below the steady state level of capital,
- 36. Investment in South Korea and the Philippines, 1950-2000
- 37. Brazil, S. Korea, Philippines Source: Penn World Table 6.1 (http://pwt.econ.upenn.edu/aboutpwt.html)
- 38. Application: Do Economies Converge? Unconditional (Absolute) convergence (α-Convergence) occurs when poor countries will eventually catch up
- 39. Imagine that at the end of their first year, some students have A averages, whereas others
- 40. According to the traditional neoclassical growth theory: Output growth results either from increases in labor, increases
- 41. Endogenous Growth Theory The neo-classical growth theory of Solow (1956) and Swan (1956) postulates that capital
- 42. Endogenous growth states that long-run economic growth is determined by forces that are internal to the
- 43. To introduce endogenous growth, it is necessary to have increasing (or at least non-decreasing) returns to
- 44. The largest difference between these two economic growth models is that the endogenous growth theory argues
- 45. Correlation between Educational Attainment and Growth Rate in Real GDP per Worker
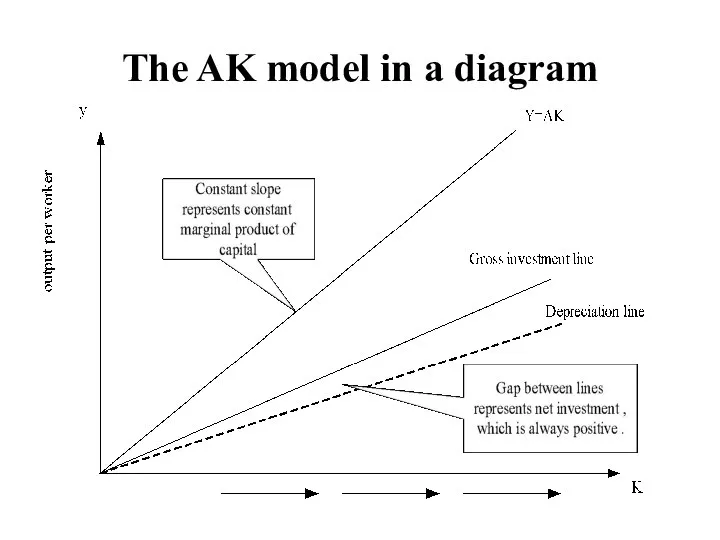
- 46. The AK model The ‘AK model’ is sometimes termed an ‘endogenous growth model’ The model has
- 47. The AK model in a diagram Where, investment (i)=s f(k) and depreciation= δ k
- 48. Endogenous Technology Growth (by Ken Arrow (1962) Suppose that technology depends on past investment (i.e. the
- 49. Assuming A=g(K) is Ken Arrow’s (1962) learning-by-doing paper The intuition is that learning about technology prevents
- 50. No Convergence Neoclassical growth theory predicts: Conditional convergence for economies with equal rates of saving and
- 51. Consumption and Output Paths of the Rich and Poor Countries
- 52. Convergence Robert Barro tested these competing theories, and found that: Countries with higher levels of investment
- 53. Transformation of the Korean Economy (1945-2005)
- 54. Policy Choice and Quality of Institutions Matter: The Korean Experiment Source: Aye M. Alemu (2015)
- 55. Flying geese’ pattern of economic development in East Asia The phrase “flying geese pattern of development”
- 56. Japan succeeded first in modernizing its economy during the latter half of the 19th century. Despite
- 57. Structural Transformation in East Asia
- 58. Are natural resources a limit to growth? Argument Natural resources - will eventually limit how much
- 59. Are natural resources a limit to growth? Technological progress Often yields ways to avoid these limits
- 60. Are natural resources a limit to growth? Prices of natural resources Scarcity - reflected in market
- 61. Saving and Investment Raise future productivity Invest more current resources in the production of capital. Trade-off
- 62. Higher savings rate Fewer resources – used to make consumption goods More resources – to make
- 63. Investment from Abroad Investment from abroad Another way for a country to invest in new capital
- 64. Investment from Abroad Benefits from investment Some flow back to the foreign capital owners. Increase the
- 65. Investment from Abroad World Bank Encourages flow of capital to poor countries Funds from world’s advanced
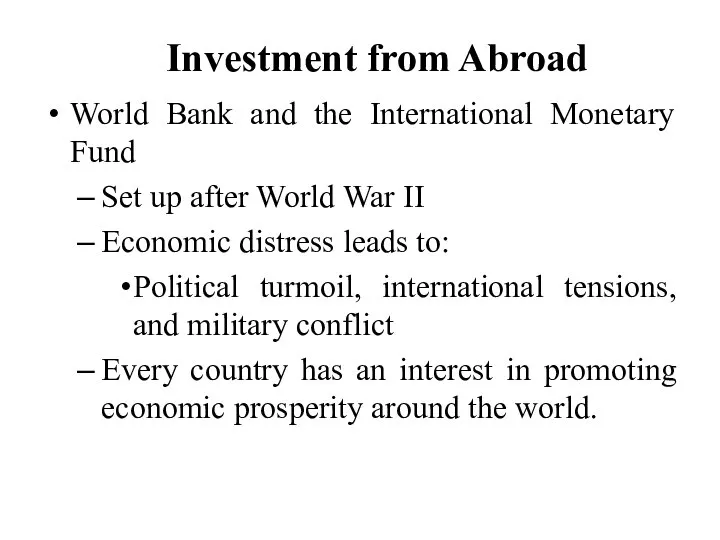
- 66. Investment from Abroad World Bank and the International Monetary Fund Set up after World War II
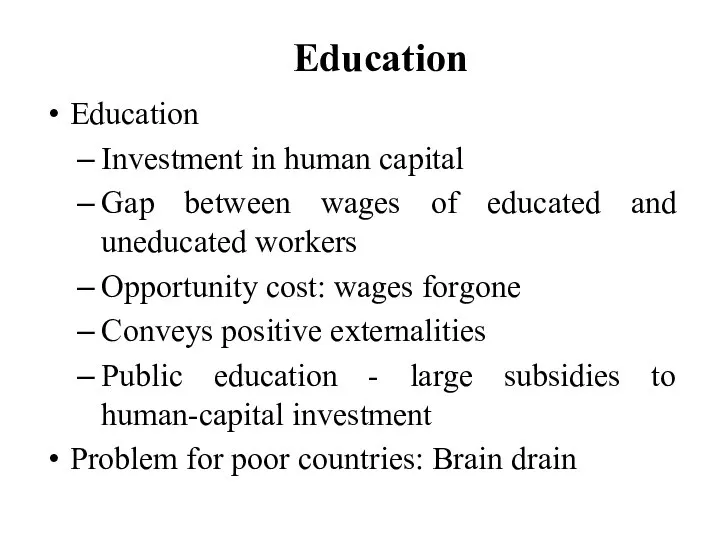
- 67. Education Education Investment in human capital Gap between wages of educated and uneducated workers Opportunity cost:
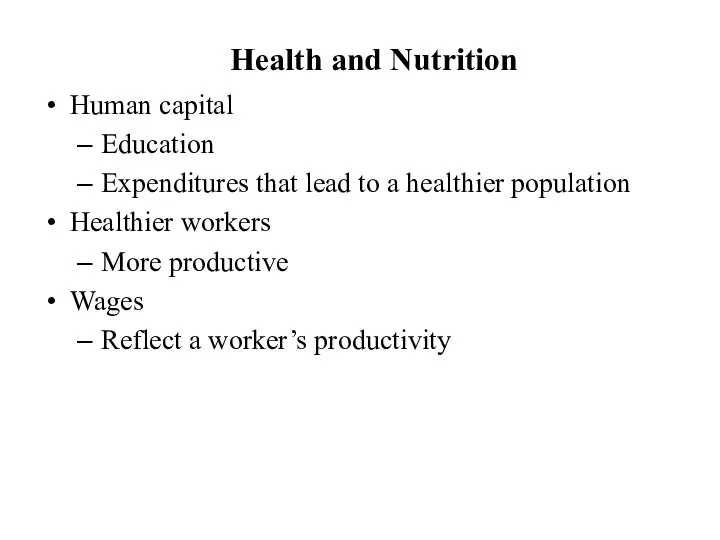
- 68. Health and Nutrition Human capital Education Expenditures that lead to a healthier population Healthier workers More
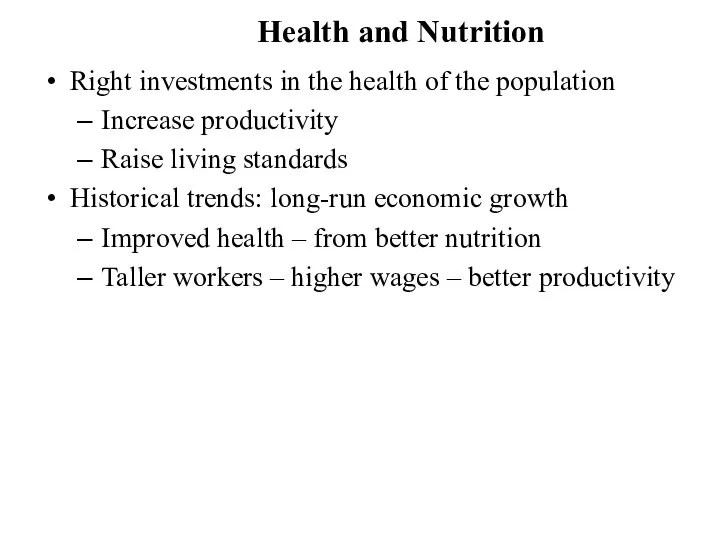
- 69. Health and Nutrition Right investments in the health of the population Increase productivity Raise living standards
- 70. Health and Nutrition Vicious circle in poor countries Poor countries are poor Because their populations are
- 71. Health and Nutrition Virtuous circle Policies that lead to more rapid economic growth Would naturally improve
- 72. Property Rights & Political Stability To foster economic growth Protect property rights Ability of people to
- 73. Property Rights & Political Stability Lack of property rights Major problem Contracts are hard to enforce
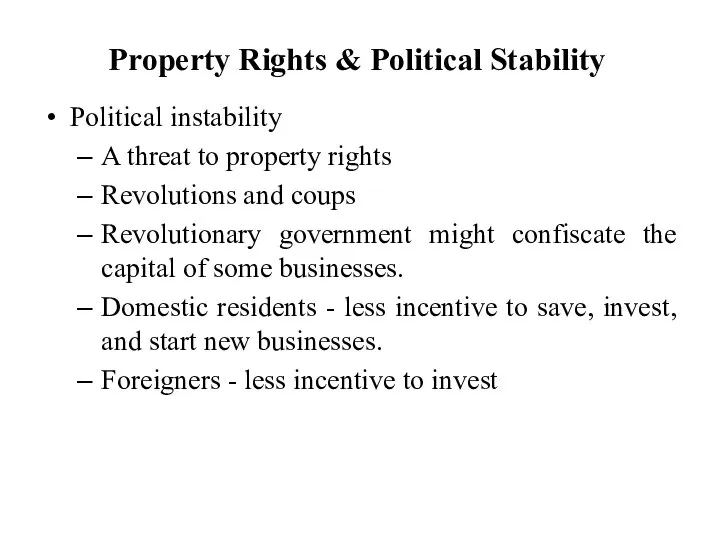
- 74. Property Rights & Political Stability Political instability A threat to property rights Revolutions and coups Revolutionary
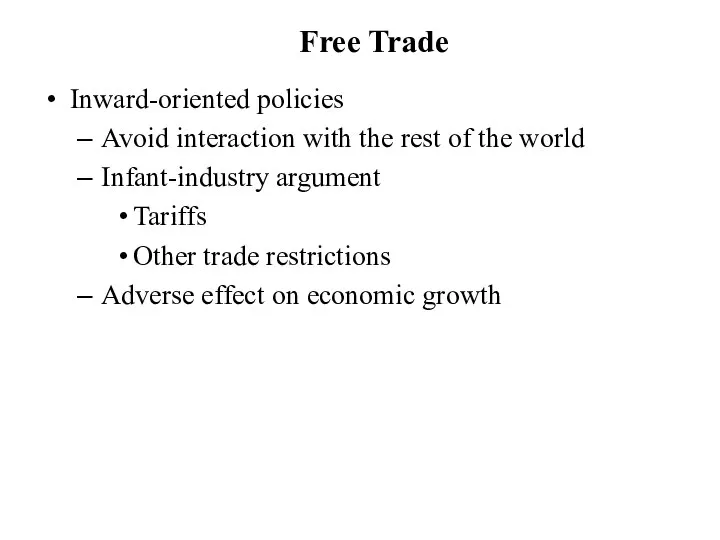
- 75. Free Trade Inward-oriented policies Avoid interaction with the rest of the world Infant-industry argument Tariffs Other
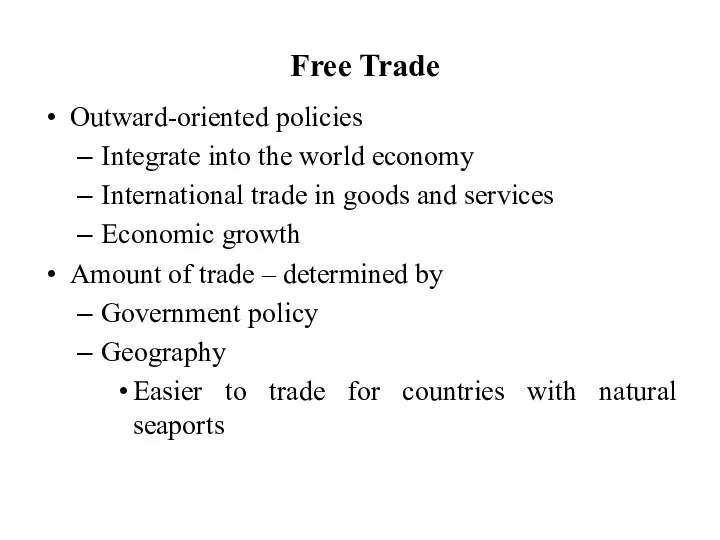
- 76. Free Trade Outward-oriented policies Integrate into the world economy International trade in goods and services Economic
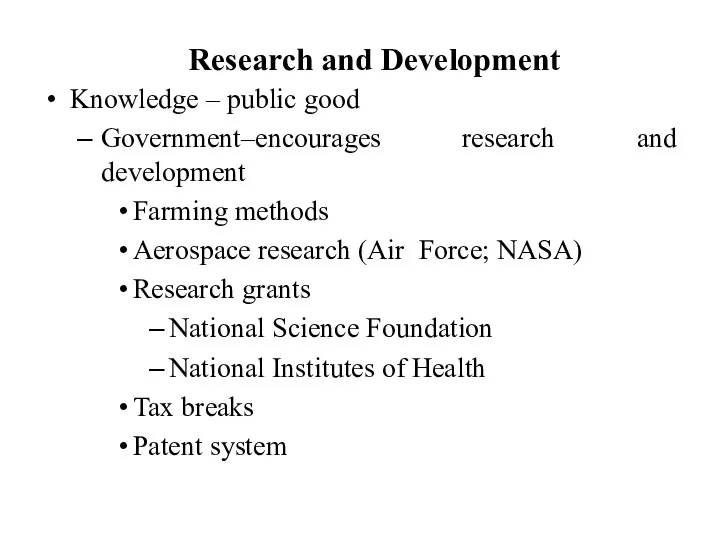
- 77. Research and Development Knowledge – public good Government–encourages research and development Farming methods Aerospace research (Air
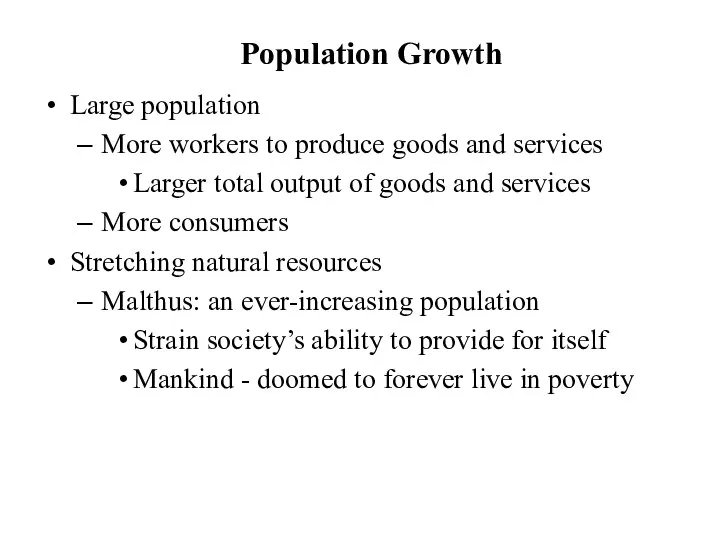
- 78. Population Growth Large population More workers to produce goods and services Larger total output of goods
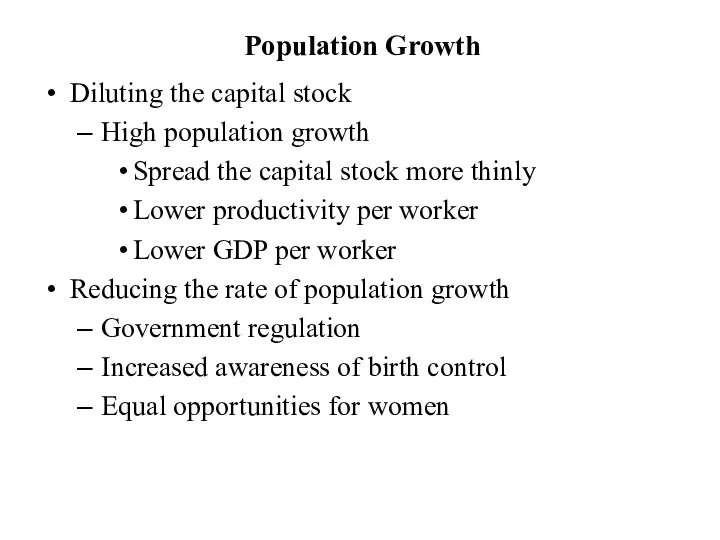
- 79. Population Growth Diluting the capital stock High population growth Spread the capital stock more thinly Lower
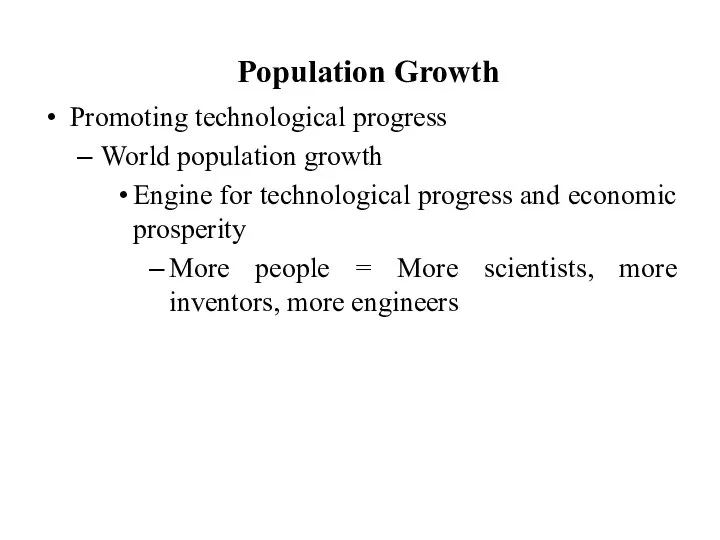
- 80. Population Growth Promoting technological progress World population growth Engine for technological progress and economic prosperity More
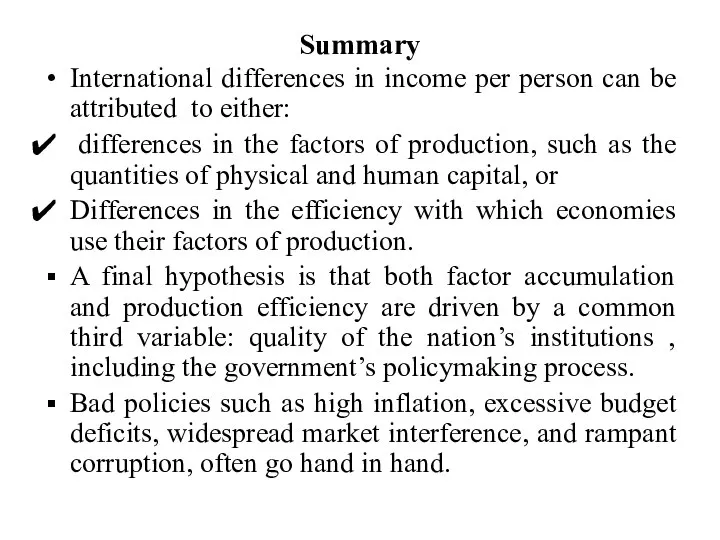
- 81. Summary International differences in income per person can be attributed to either: differences in the factors
- 82. Summary The Solow growth model has emphasized the importance of savings or investment ratio as the
- 83. Technological progress, though important in the long-run, is regarded as exogenous to the economic system. The
- 84. Investment, Depreciation and Output Output: Y Depreciation: δ K Investment: s Y
- 85. The Endogenous growth theory believe that human capital and innovation capacity are the main sources of
- 86. The AK model in a diagram
- 87. Generally, the following are growth drivers: Growth in physical capital stock (capital deepening) Growth in the
- 89. Скачать презентацию
Economic Growth
Economic growth is a long-term expansion of the productive potential
Economic Growth
Economic growth is a long-term expansion of the productive potential
Rostow’s Five-Stage Model of Development
Rostow's Stages of Growth model is one
Rostow’s Five-Stage Model of Development
Rostow's Stages of Growth model is one
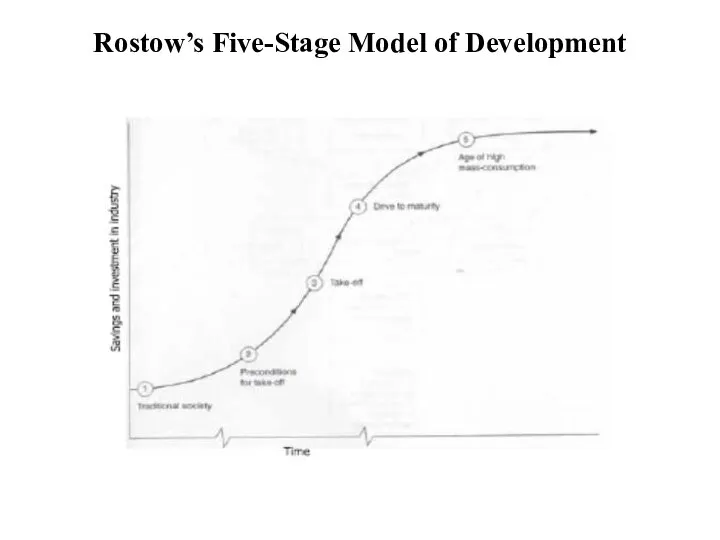
Rostow’s Five-Stage Model of Development
Rostow’s Five-Stage Model of Development
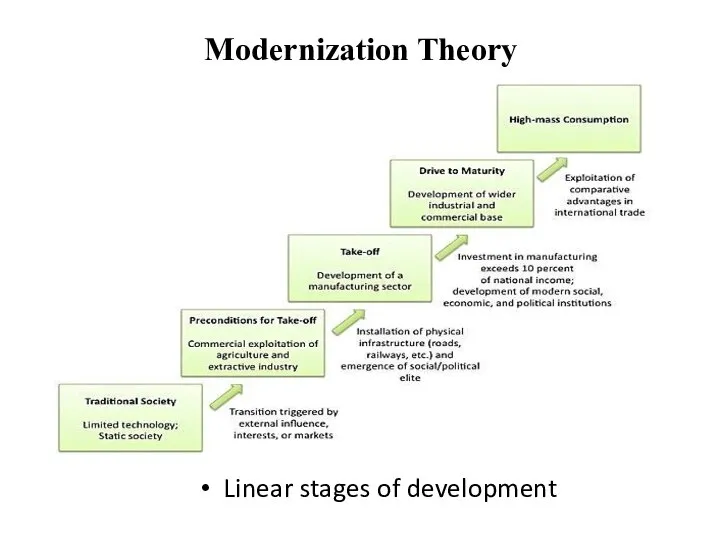
Modernization Theory
Linear stages of development
Modernization Theory
Linear stages of development
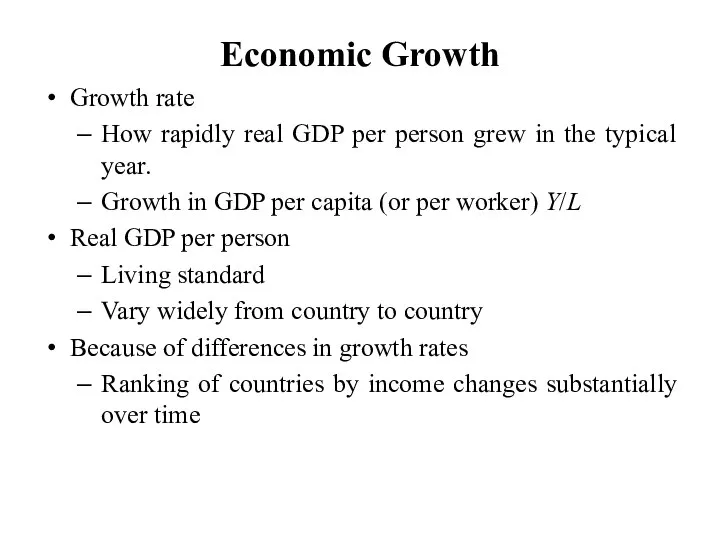
Economic Growth
Growth rate
How rapidly real GDP per person grew in the
Economic Growth
Growth rate
How rapidly real GDP per person grew in the
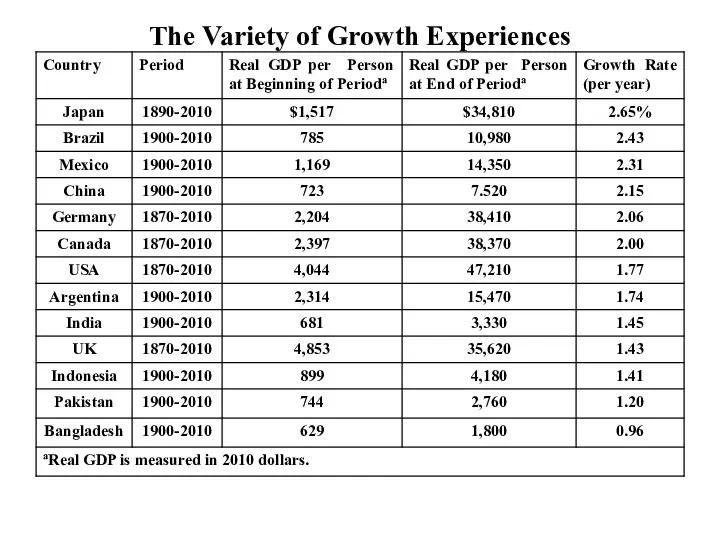
The Variety of Growth Experiences
The Variety of Growth Experiences
Productivity
Productivity
Quantity of goods and services
Produced from each unit of labor input
Why
Productivity
Productivity
Quantity of goods and services
Produced from each unit of labor input
Why
Productivity
Determinants of productivity
Physical capital
Stock of equipment and structures
Used to produce
Productivity
Determinants of productivity
Physical capital
Stock of equipment and structures
Used to produce
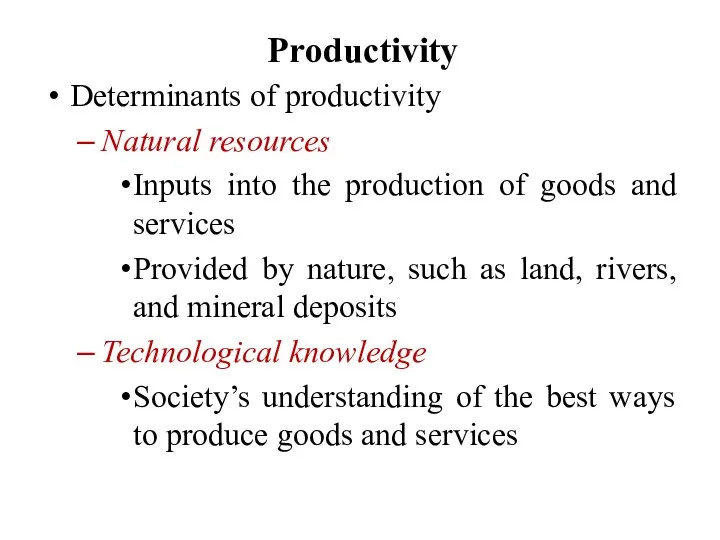
Productivity
Determinants of productivity
Natural resources
Inputs into the production of goods and
Productivity
Determinants of productivity
Natural resources
Inputs into the production of goods and
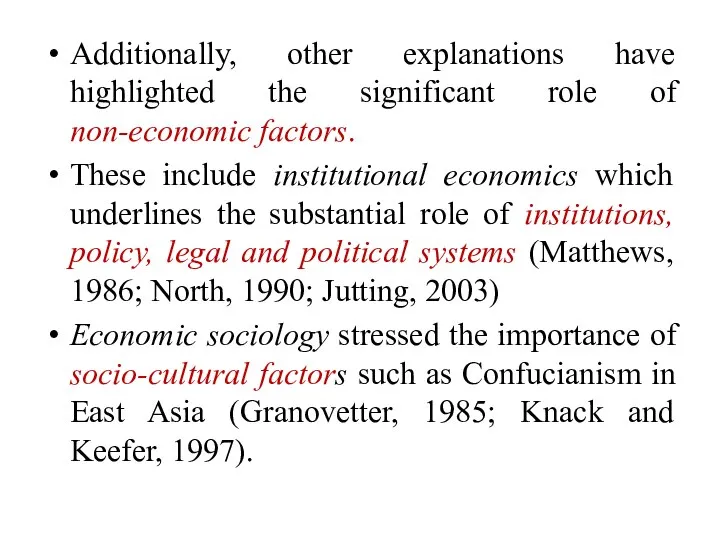
Additionally, other explanations have highlighted the significant role of non-economic factors.
These
Additionally, other explanations have highlighted the significant role of non-economic factors.
These
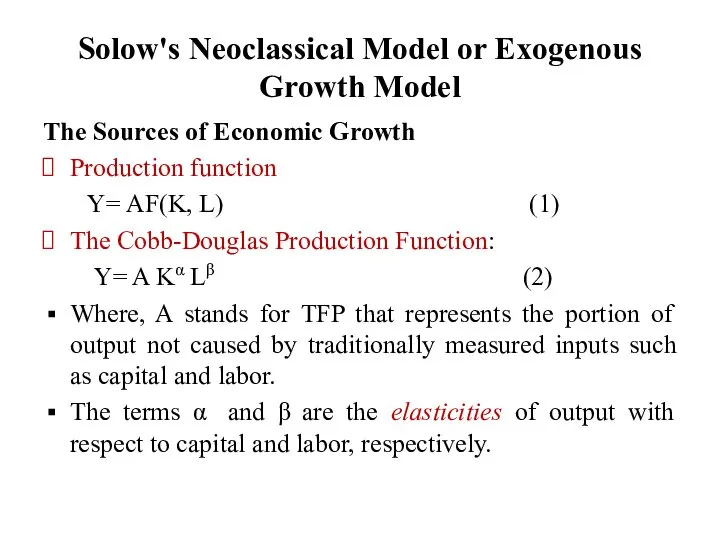
Solow's Neoclassical Model or Exogenous Growth Model
The Sources of Economic Growth
Production
Solow's Neoclassical Model or Exogenous Growth Model
The Sources of Economic Growth
Production
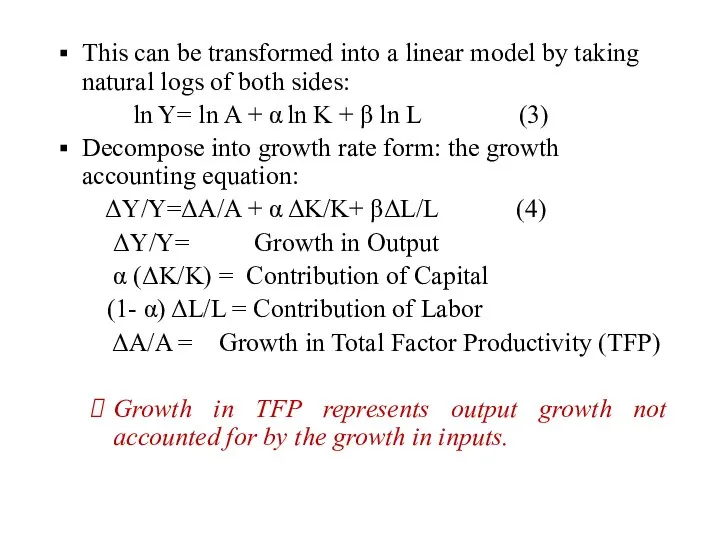
This can be transformed into a linear model by taking natural
This can be transformed into a linear model by taking natural
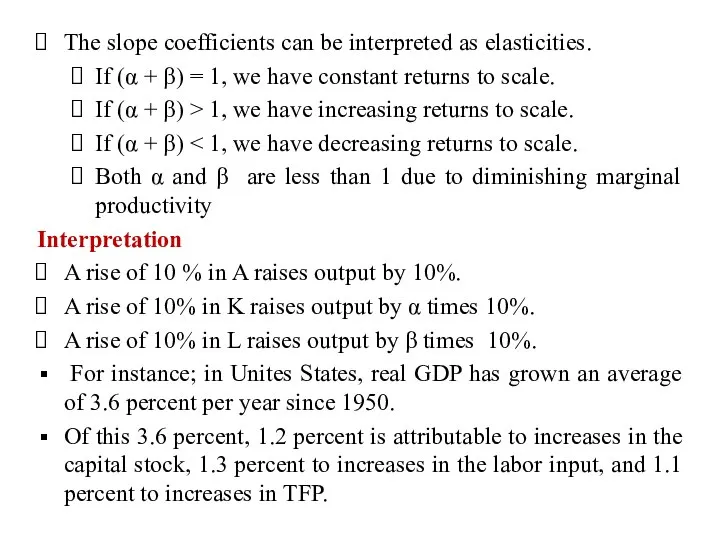
The slope coefficients can be interpreted as elasticities.
If (α + β)
The slope coefficients can be interpreted as elasticities.
If (α + β)
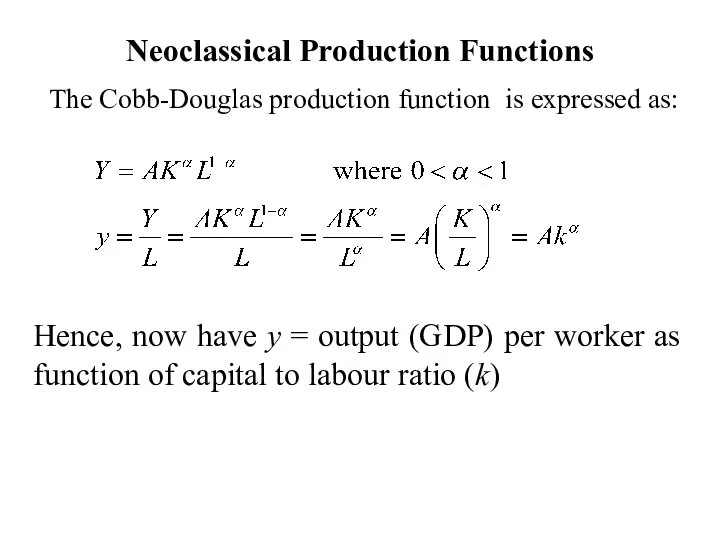
Neoclassical Production Functions
The Cobb-Douglas production function is expressed as:
Hence, now have
Neoclassical Production Functions
The Cobb-Douglas production function is expressed as:
Hence, now have
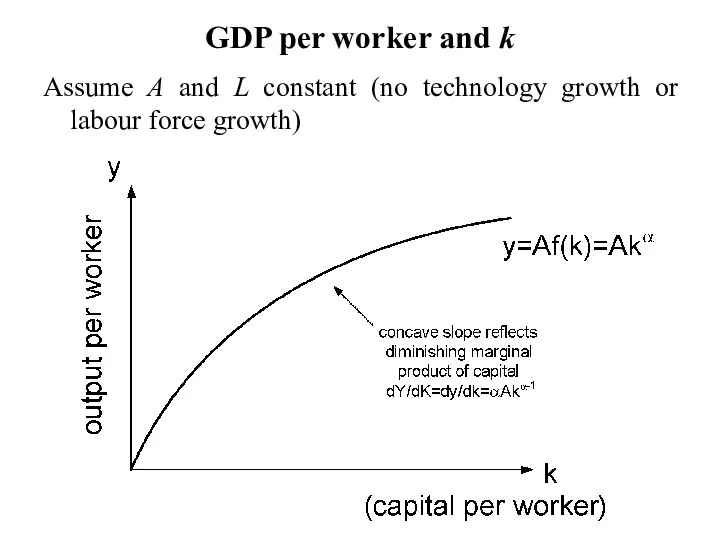
GDP per worker and k
Assume A and L constant (no technology
GDP per worker and k
Assume A and L constant (no technology
Diminishing Returns
The neo-classical growth theory of Solow (1956) and Swan (1956)
Diminishing Returns
The neo-classical growth theory of Solow (1956) and Swan (1956)
Illustrating the Production Function
This figure shows how the amount of
Illustrating the Production Function
This figure shows how the amount of
Diminishing Returns
If the variable factor of production increases, the output will
Diminishing Returns
If the variable factor of production increases, the output will
Catch-up effect (Convergence)
Countries that start off poor tend to grow more
Catch-up effect (Convergence)
Countries that start off poor tend to grow more
A second approach explains convergence as resulting primarily from cross- country
A second approach explains convergence as resulting primarily from cross- country
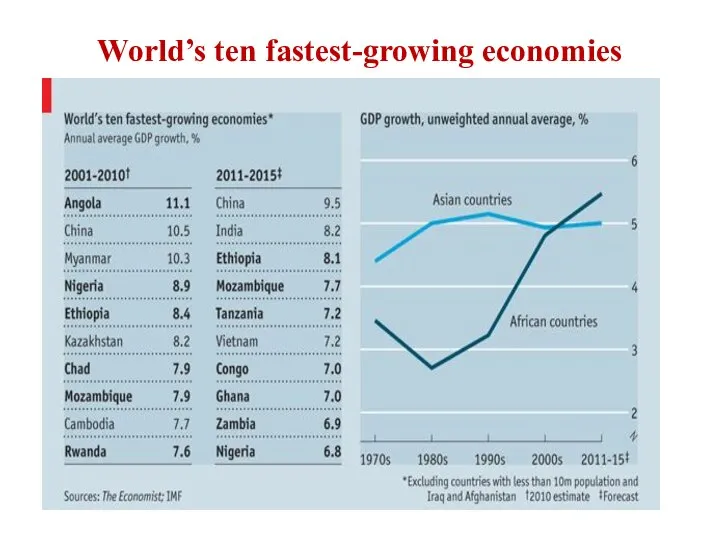
World’s ten fastest-growing economies
World’s ten fastest-growing economies
What causes the differences in income over time and across countries?
The
What causes the differences in income over time and across countries?
The
Investment refers to the expenditure on new plant and equipment, and
Investment refers to the expenditure on new plant and equipment, and
Depreciation is the amount of capital that wears out each period
Depreciation is the amount of capital that wears out each period
Depreciation: δ K
Investment: s f (k)
Investment, Depreciation, and the Steady state
Depreciation: δ K
Investment: s f (k)
Investment, Depreciation, and the Steady state
The steady-state level of capital K* is the level at which
The steady-state level of capital K* is the level at which
The major accomplishment of the Solow model is the principle of
The major accomplishment of the Solow model is the principle of
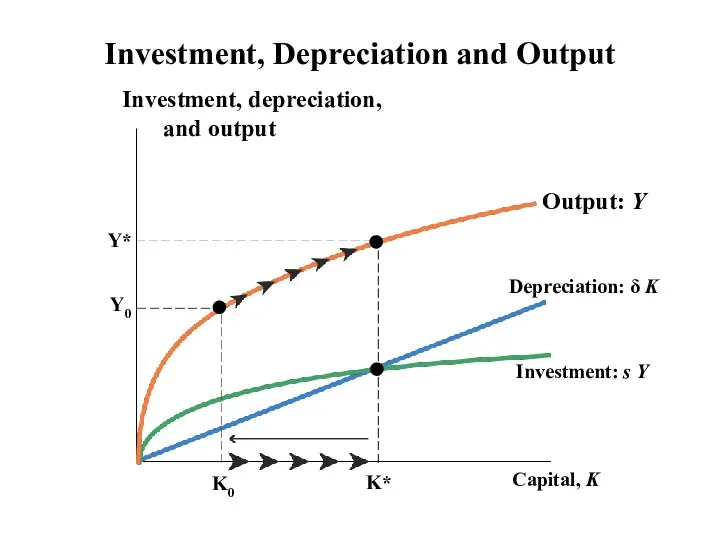
Investment, Depreciation and Output
Output: Y
Depreciation: δ K
Investment: s Y
Investment, Depreciation and Output
Output: Y
Depreciation: δ K
Investment: s Y
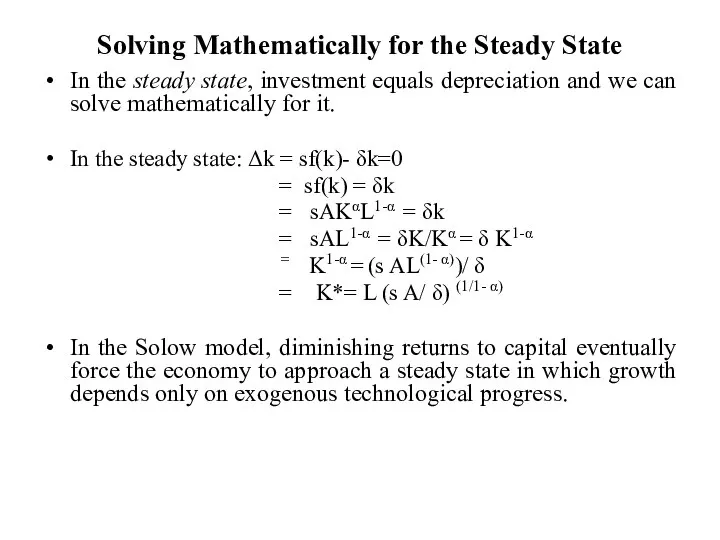
Solving Mathematically for the Steady State
In the steady state, investment equals
Solving Mathematically for the Steady State
In the steady state, investment equals
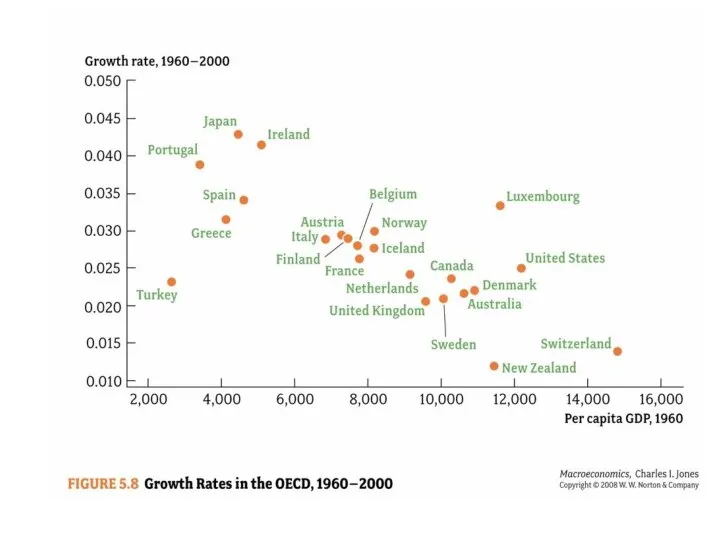
Understanding Differences in Growth Rates
OECD countries that were relatively poor in
Understanding Differences in Growth Rates
OECD countries that were relatively poor in
Some Things to Notice
The farther the economy starts below the steady
Some Things to Notice
The farther the economy starts below the steady
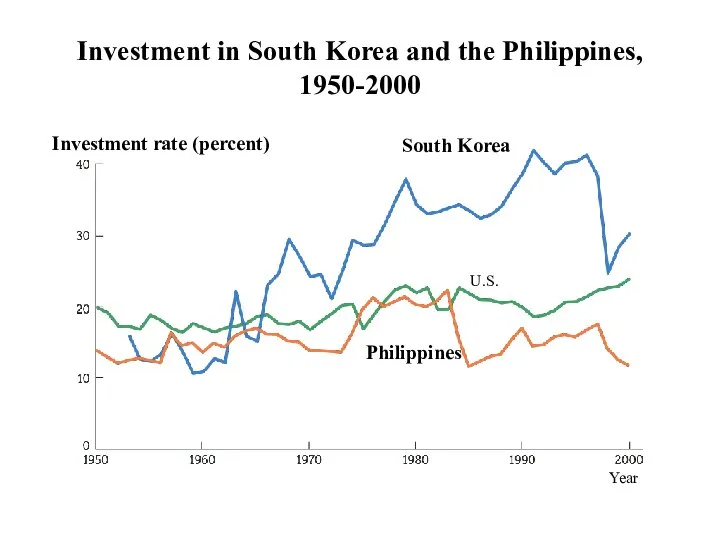
Investment in South Korea and the Philippines,
1950-2000
Investment in South Korea and the Philippines,
1950-2000
Brazil, S. Korea, Philippines
Source: Penn World Table 6.1 (http://pwt.econ.upenn.edu/aboutpwt.html)
Brazil, S. Korea, Philippines
Source: Penn World Table 6.1 (http://pwt.econ.upenn.edu/aboutpwt.html)
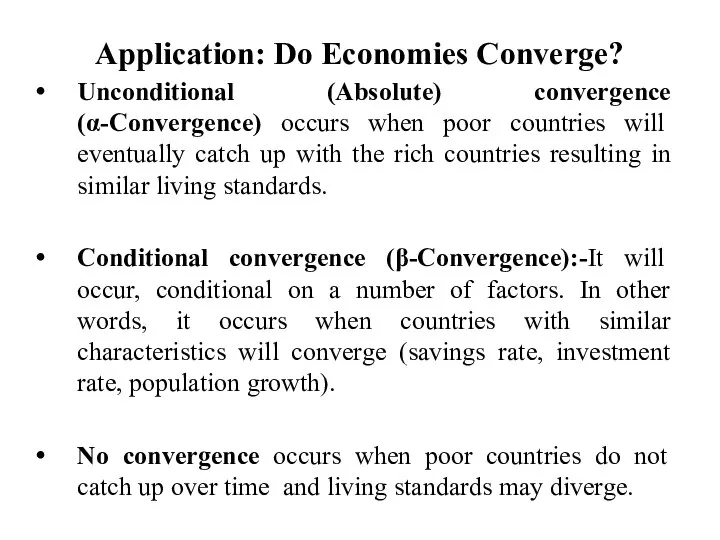
Application: Do Economies Converge?
Unconditional (Absolute) convergence (α-Convergence) occurs when poor
Application: Do Economies Converge?
Unconditional (Absolute) convergence (α-Convergence) occurs when poor
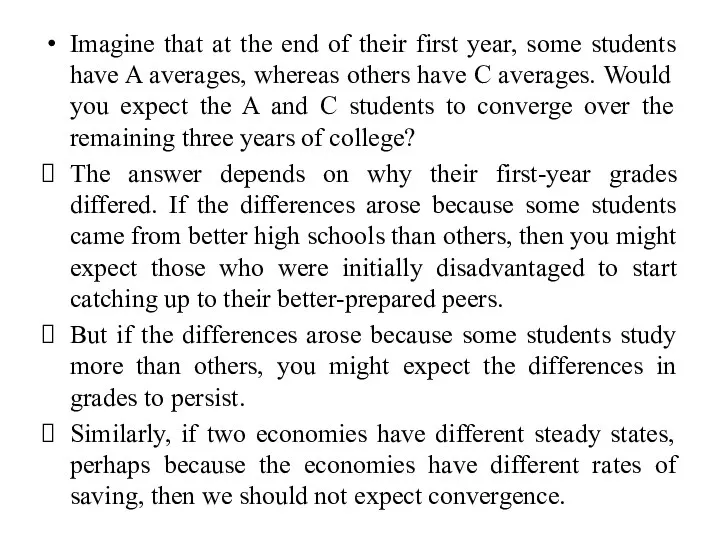
Imagine that at the end of their first year, some students
Imagine that at the end of their first year, some students
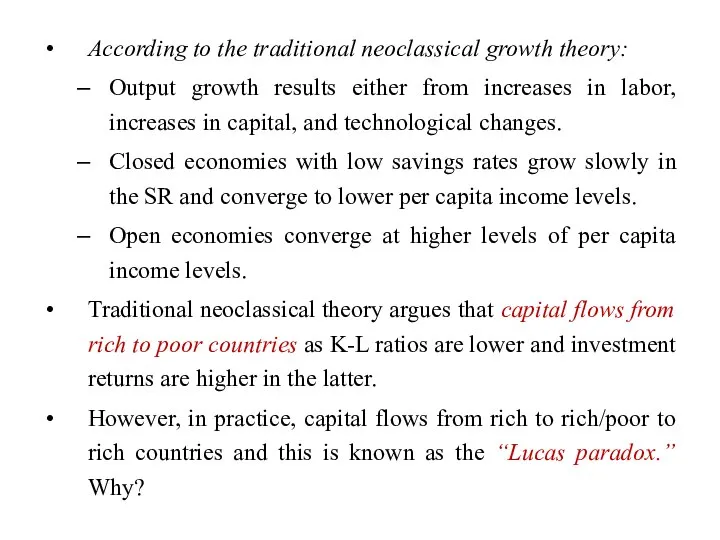
According to the traditional neoclassical growth theory:
Output growth results either
According to the traditional neoclassical growth theory:
Output growth results either
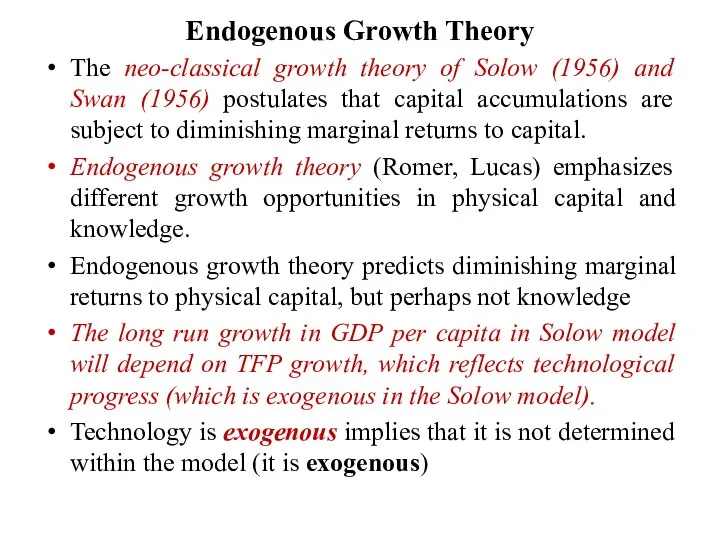
Endogenous Growth Theory
The neo-classical growth theory of Solow (1956) and Swan
Endogenous Growth Theory
The neo-classical growth theory of Solow (1956) and Swan
Endogenous growth states that long-run economic growth is determined by forces
Endogenous growth states that long-run economic growth is determined by forces
To introduce endogenous growth, it is necessary to have increasing (or
To introduce endogenous growth, it is necessary to have increasing (or
The largest difference between these two economic growth models is that
The largest difference between these two economic growth models is that
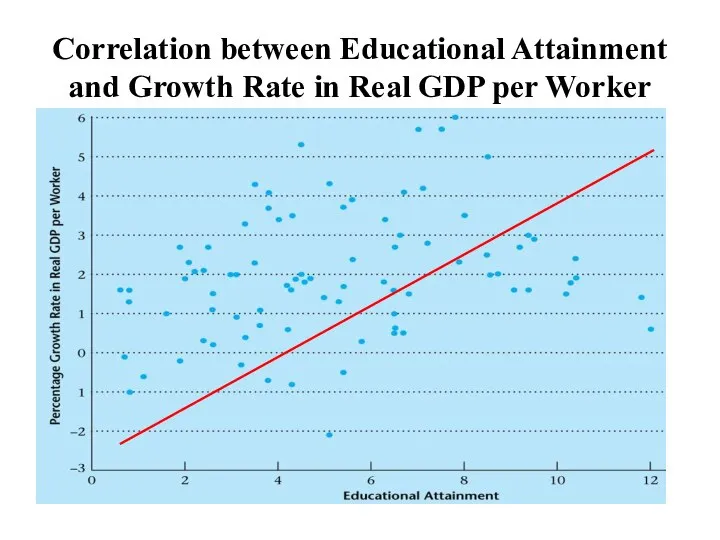
Correlation between Educational Attainment and Growth Rate in Real GDP per
Correlation between Educational Attainment and Growth Rate in Real GDP per
The AK model
The ‘AK model’ is sometimes termed an ‘endogenous growth
The AK model
The ‘AK model’ is sometimes termed an ‘endogenous growth
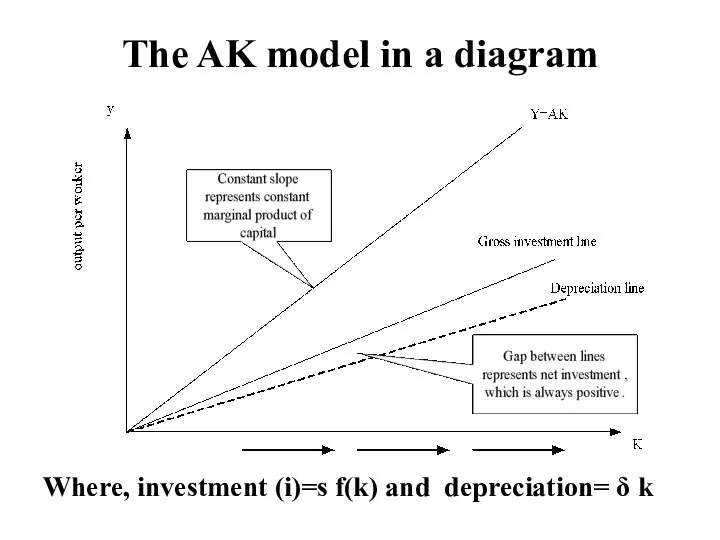
The AK model in a diagram
Where, investment (i)=s f(k) and
The AK model in a diagram
Where, investment (i)=s f(k) and
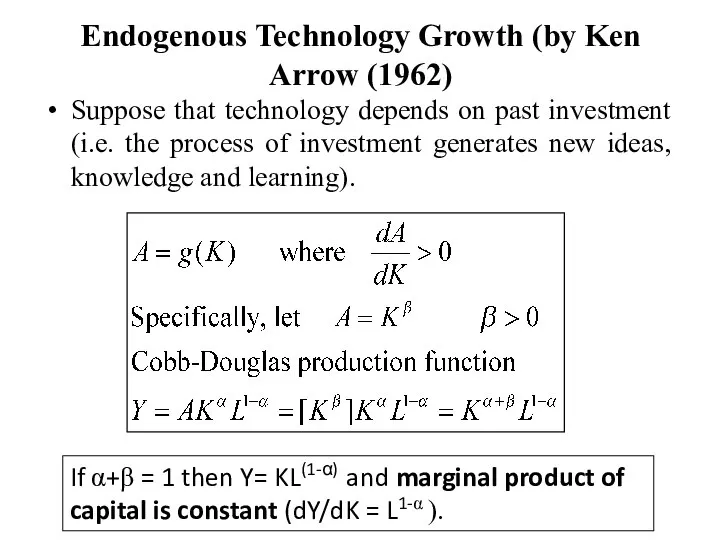
Endogenous Technology Growth (by Ken Arrow (1962)
Suppose that technology depends
Endogenous Technology Growth (by Ken Arrow (1962)
Suppose that technology depends
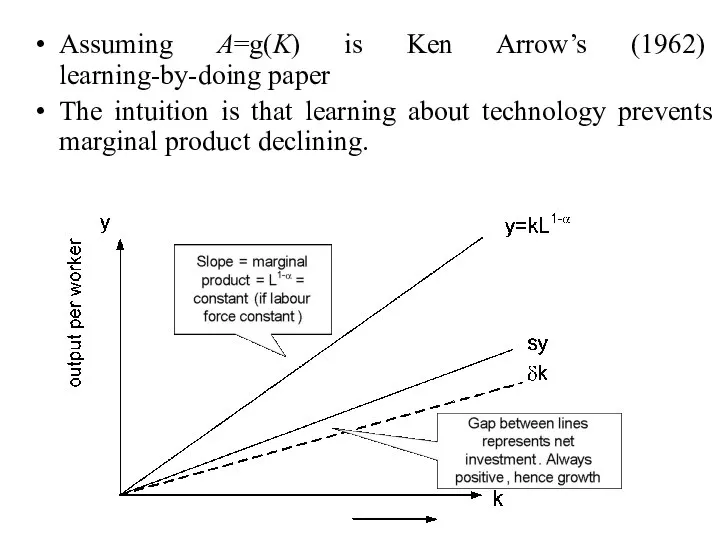
Assuming A=g(K) is Ken Arrow’s (1962) learning-by-doing paper
The intuition is that
Assuming A=g(K) is Ken Arrow’s (1962) learning-by-doing paper
The intuition is that
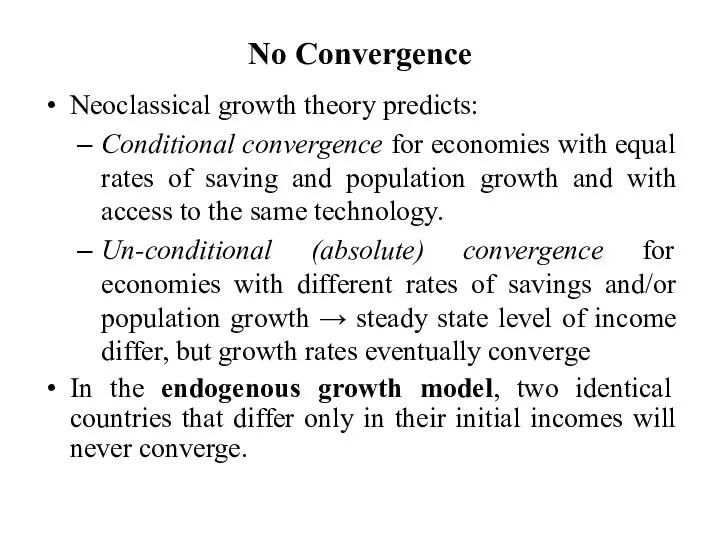
No Convergence
Neoclassical growth theory predicts:
Conditional convergence for economies with equal
No Convergence
Neoclassical growth theory predicts:
Conditional convergence for economies with equal
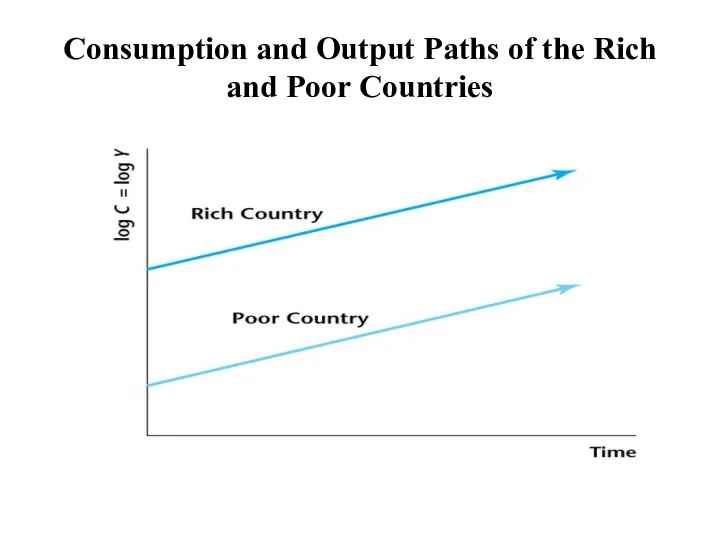
Consumption and Output Paths of the Rich and Poor Countries
Consumption and Output Paths of the Rich and Poor Countries
Convergence
Robert Barro tested these competing theories, and found that:
Countries with higher
Convergence
Robert Barro tested these competing theories, and found that:
Countries with higher
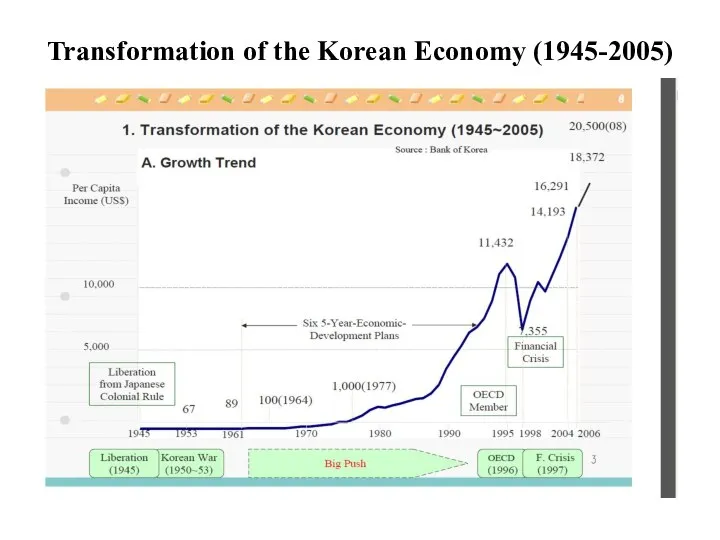
Transformation of the Korean Economy (1945-2005)
Transformation of the Korean Economy (1945-2005)
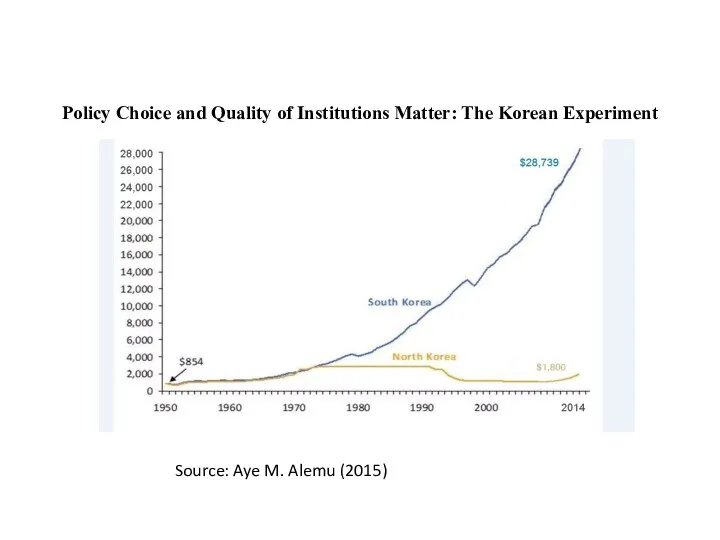
Policy Choice and Quality of Institutions Matter: The Korean Experiment
Source: Aye
Policy Choice and Quality of Institutions Matter: The Korean Experiment
Source: Aye
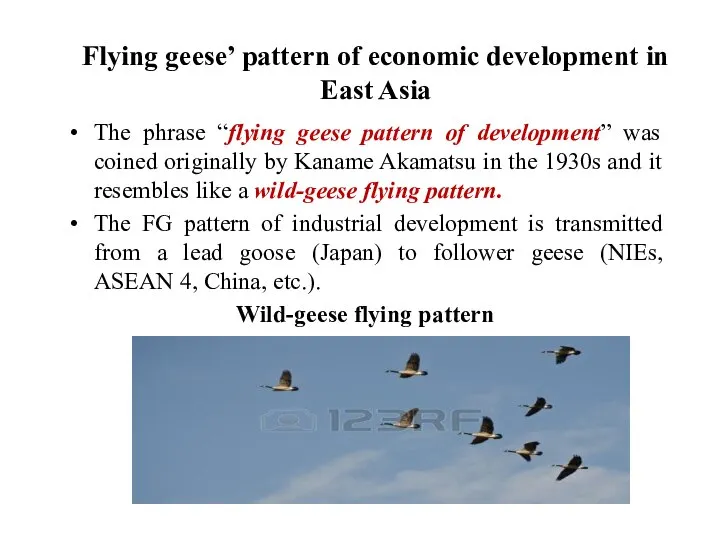
Flying geese’ pattern of economic development in East Asia
The phrase “flying
Flying geese’ pattern of economic development in East Asia
The phrase “flying
Japan succeeded first in modernizing its economy during the latter half
Japan succeeded first in modernizing its economy during the latter half
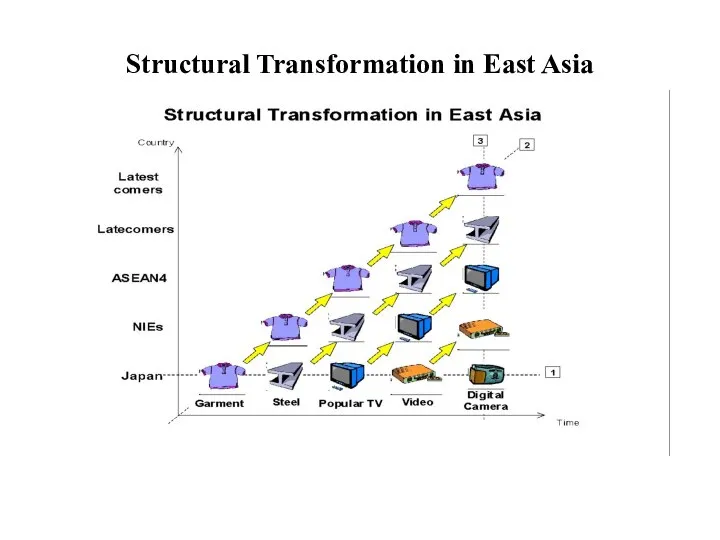
Structural Transformation in East Asia
Structural Transformation in East Asia
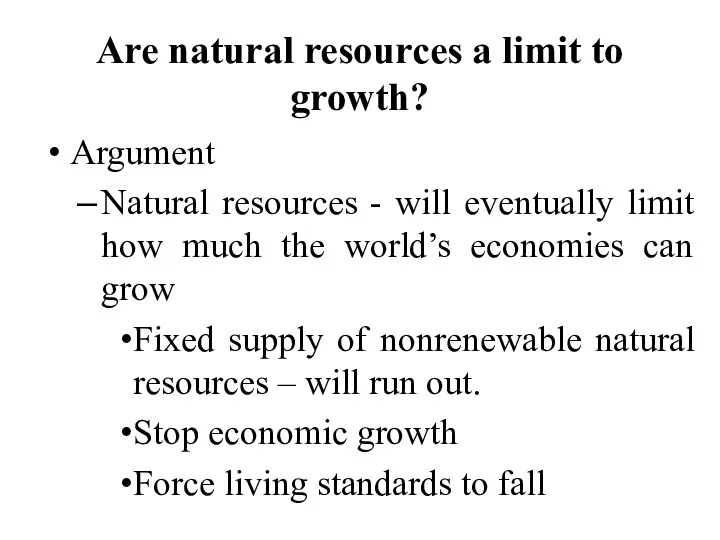
Are natural resources a limit to growth?
Argument
Natural resources - will eventually
Are natural resources a limit to growth?
Argument
Natural resources - will eventually
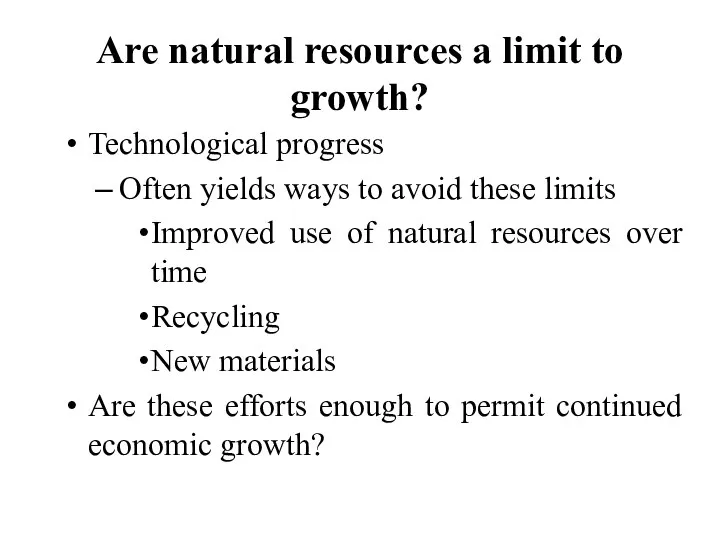
Are natural resources a limit to growth?
Technological progress
Often yields ways to
Are natural resources a limit to growth?
Technological progress
Often yields ways to
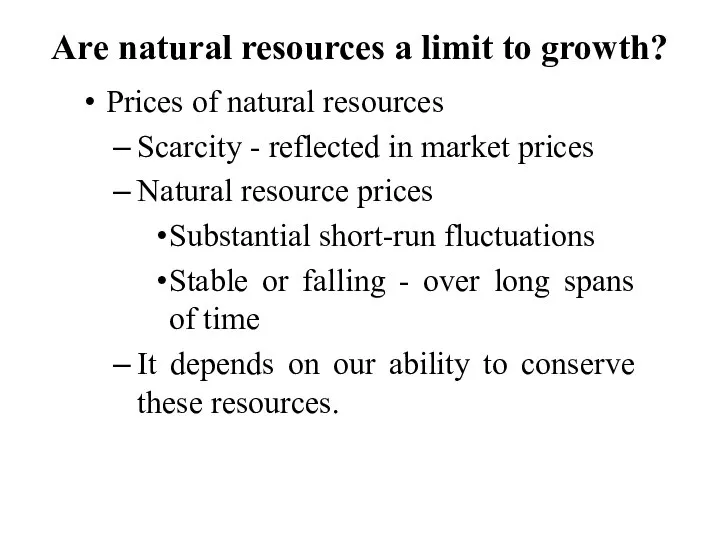
Are natural resources a limit to growth?
Prices of natural resources
Scarcity -
Are natural resources a limit to growth?
Prices of natural resources
Scarcity -
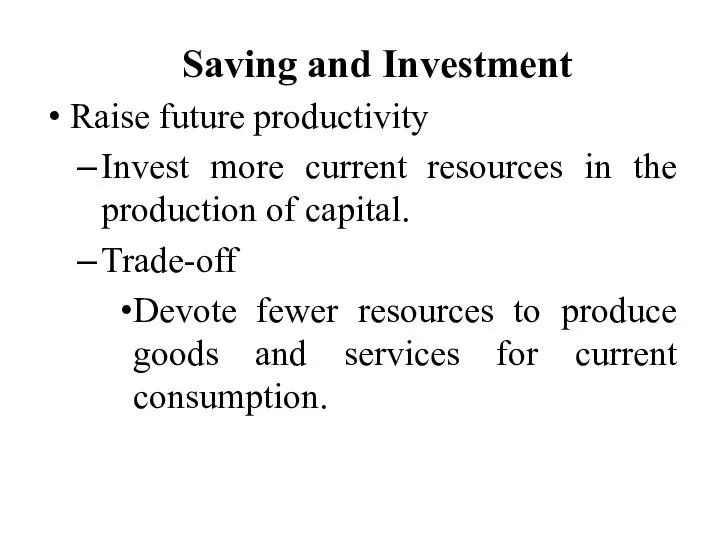
Saving and Investment
Raise future productivity
Invest more current resources in the production
Saving and Investment
Raise future productivity
Invest more current resources in the production
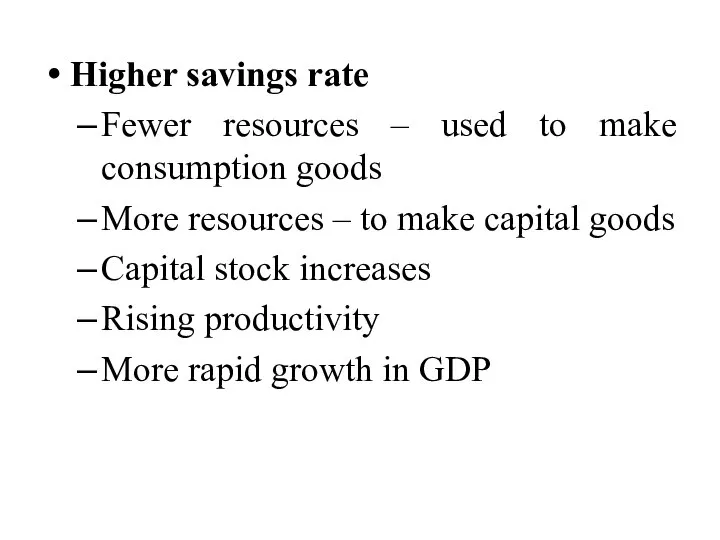
Higher savings rate
Fewer resources – used to make consumption goods
More resources
Higher savings rate
Fewer resources – used to make consumption goods
More resources
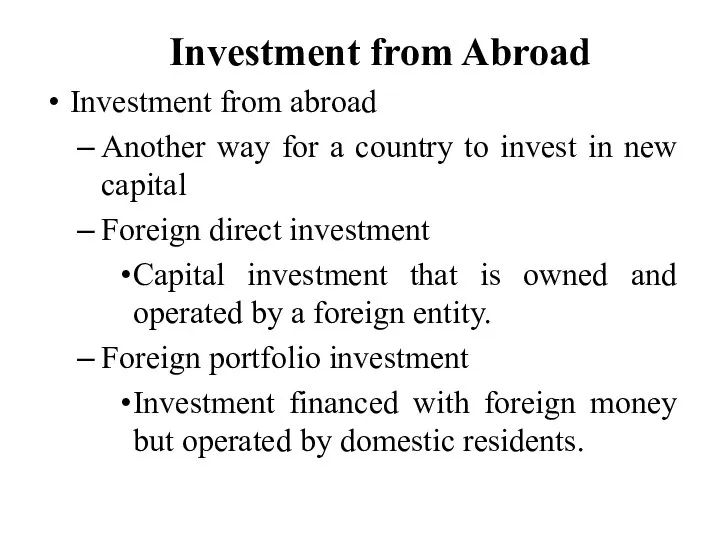
Investment from Abroad
Investment from abroad
Another way for a country to invest
Investment from Abroad
Investment from abroad
Another way for a country to invest
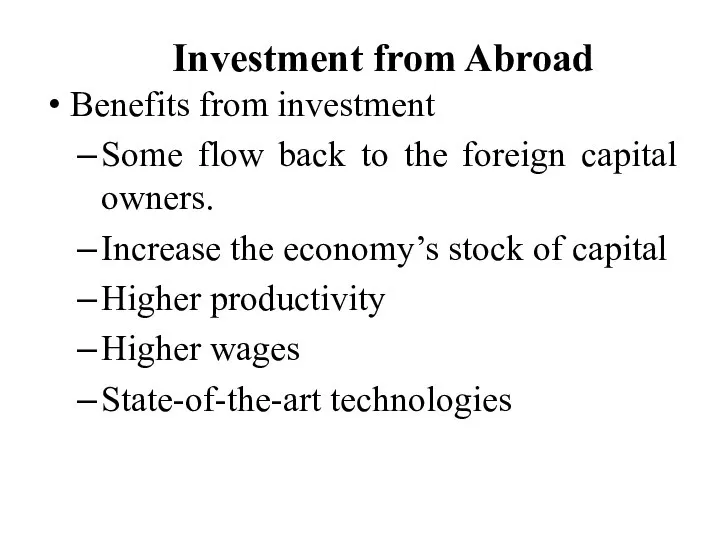
Investment from Abroad
Benefits from investment
Some flow back to the foreign capital
Investment from Abroad
Benefits from investment
Some flow back to the foreign capital
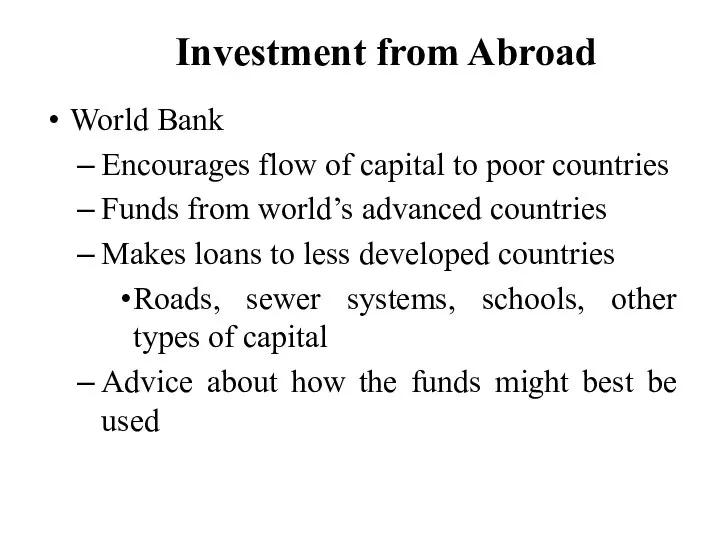
Investment from Abroad
World Bank
Encourages flow of capital to poor countries
Funds from
Investment from Abroad
World Bank
Encourages flow of capital to poor countries
Funds from
Investment from Abroad
World Bank and the International Monetary Fund
Set up after
Investment from Abroad
World Bank and the International Monetary Fund
Set up after
Education
Education
Investment in human capital
Gap between wages of educated and
Education
Education
Investment in human capital
Gap between wages of educated and
Health and Nutrition
Human capital
Education
Expenditures that lead to a healthier population
Healthier workers
More
Health and Nutrition
Human capital
Education
Expenditures that lead to a healthier population
Healthier workers
More
Health and Nutrition
Right investments in the health of the population
Increase productivity
Raise
Health and Nutrition
Right investments in the health of the population
Increase productivity
Raise
Health and Nutrition
Vicious circle in poor countries
Poor countries are poor
Because their
Health and Nutrition
Vicious circle in poor countries
Poor countries are poor
Because their
Health and Nutrition
Virtuous circle
Policies that lead to more rapid economic growth
Health and Nutrition
Virtuous circle
Policies that lead to more rapid economic growth
Property Rights & Political Stability
To foster economic growth
Protect property rights
Ability of
Property Rights & Political Stability
To foster economic growth
Protect property rights
Ability of
Property Rights & Political Stability
Lack of property rights
Major problem
Contracts are hard
Property Rights & Political Stability
Lack of property rights
Major problem
Contracts are hard
Property Rights & Political Stability
Political instability
A threat to property rights
Revolutions and
Property Rights & Political Stability
Political instability
A threat to property rights
Revolutions and
Free Trade
Inward-oriented policies
Avoid interaction with the rest of the world
Infant-industry argument
Tariffs
Other
Free Trade
Inward-oriented policies
Avoid interaction with the rest of the world
Infant-industry argument
Tariffs
Other
Free Trade
Outward-oriented policies
Integrate into the world economy
International trade in goods and
Free Trade
Outward-oriented policies
Integrate into the world economy
International trade in goods and
Research and Development
Knowledge – public good
Government–encourages research and development
Farming methods
Aerospace
Research and Development
Knowledge – public good
Government–encourages research and development
Farming methods
Aerospace
Population Growth
Large population
More workers to produce goods and services
Larger total output
Population Growth
Large population
More workers to produce goods and services
Larger total output
Population Growth
Diluting the capital stock
High population growth
Spread the capital stock more
Population Growth
Diluting the capital stock
High population growth
Spread the capital stock more
Population Growth
Promoting technological progress
World population growth
Engine for technological progress and economic
Population Growth
Promoting technological progress
World population growth
Engine for technological progress and economic
Summary
International differences in income per person can be attributed to either:
Summary
International differences in income per person can be attributed to either:
Summary
The Solow growth model has emphasized the importance of savings or
Summary
The Solow growth model has emphasized the importance of savings or
Technological progress, though important in the long-run, is regarded as exogenous
Technological progress, though important in the long-run, is regarded as exogenous

Investment, Depreciation and Output
Output: Y
Depreciation: δ K
Investment: s Y
Investment, Depreciation and Output
Output: Y
Depreciation: δ K
Investment: s Y
The Endogenous growth theory believe that human capital and innovation capacity
The Endogenous growth theory believe that human capital and innovation capacity
The AK model in a diagram
The AK model in a diagram
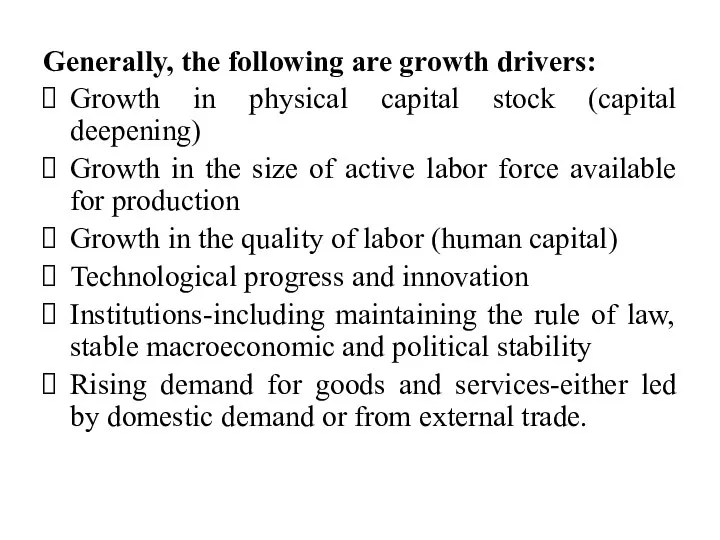
Generally, the following are growth drivers:
Growth in physical capital stock (capital
Generally, the following are growth drivers:
Growth in physical capital stock (capital
 Экономикалық жүйе
 Несовешенства рынка. Общественные блага. Спрос и предложение на общественные блага. Трансакционные издержки
 Индекс стоимости жизни
 Трудовая теория стоимости. А.Смит, Д.Рикардо, К.Маркс
 Разработка мероприятий по повышению эффективности хозяйственной деятельности АО «Плава»
 Тема научной статьи – ракурс, в котором рассматривается проблема
 Прибыль предприятия и пути ее максимизации на примере ООО «Лента»
 Aboriginal Affairs and Northern Development Canada
 Инновационная деятельность
 Северо-Кавказский федеральный округ
 Презентация Виды научных публикаций
 Институциональная экономика. Лекция 12-13. Институциональная теория государств
 Планирование и управление инновациями
 Американский и русский институционализм начала ХХ века
 Основы регионального управления
 Таур қорын,қаржыны және басқа да активтерді нормалау. Тауардың босатылу көлемін қамтамасыз ету
 Классификация методов товароведения
 Las mercancías & las aduanas
 Бюджетные путешествия
 Международные аспекты экономического развития
 История и методология экономической науки
 International Trade: Theory and Policy. Lecture 10
 Технология разработки прогнозов разных уровней. Макроэкономическое прогнозирование
 Презентация Маркетинг человеческих ресурсов
 Cost-volume-profit (cvp) analysis
 Ұлттық экономика жүйе ретінде. Есептер мен тапсырмалар
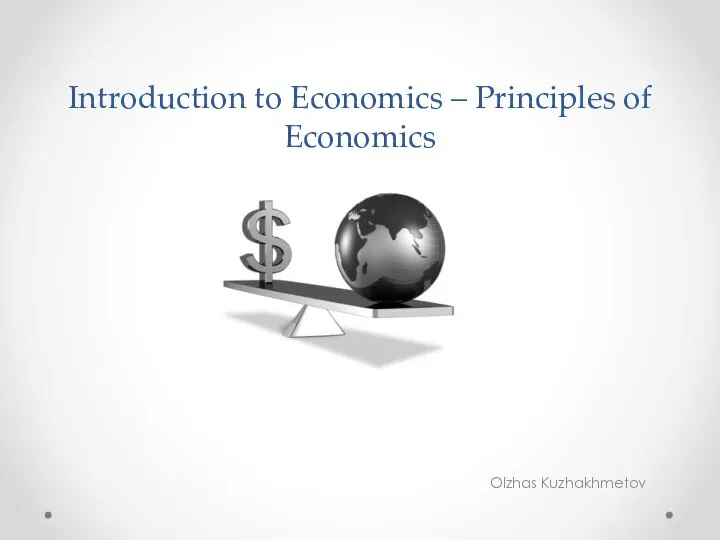 Introduction to Economics – Principles of Economics. Introductory lecture. Olzhas Kuzhakhmetov
 Эффективные способы взаимодействия бизнеса и власти для развития моногородов