- Financial Statement Analysis

Содержание
- 2. Financial Statement Analysis Financial Statements A Possible Framework for Analysis Ratio Analysis Trend Analysis Common-Size and
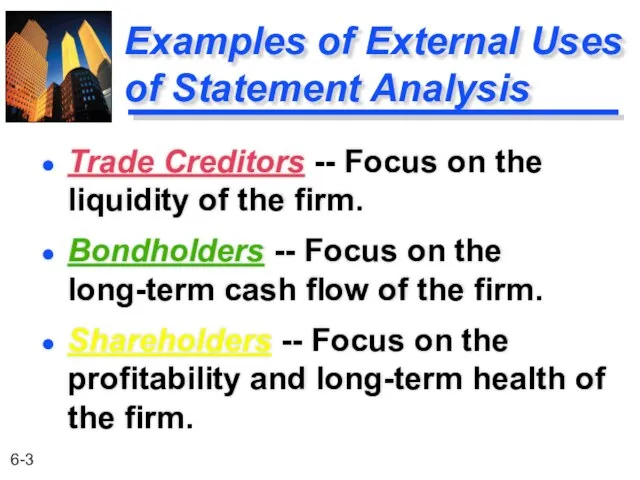
- 3. Examples of External Uses of Statement Analysis Trade Creditors -- Focus on the liquidity of the
- 4. Examples of Internal Uses of Statement Analysis Plan -- Focus on assessing the current financial position
- 5. Primary Types of Financial Statements Income Statement A summary of a firm’s revenues and expenses over
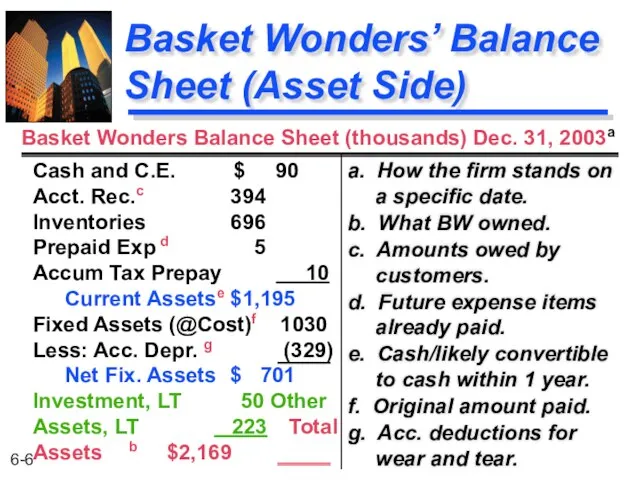
- 6. Basket Wonders’ Balance Sheet (Asset Side) a. How the firm stands on a specific date. b.
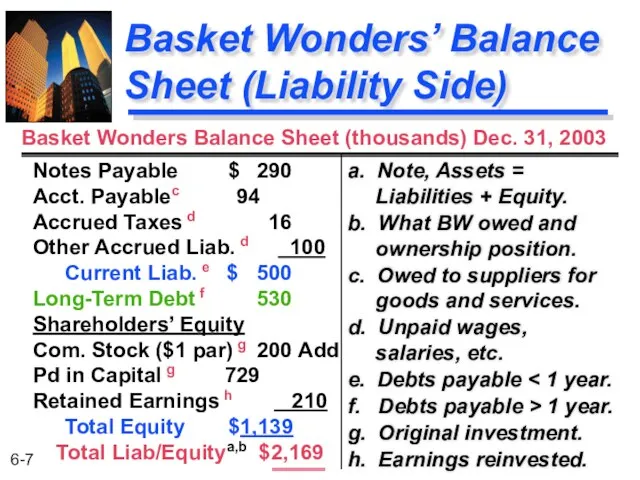
- 7. Basket Wonders’ Balance Sheet (Liability Side) a. Note, Assets = Liabilities + Equity. b. What BW
- 8. Basket Wonders’ Income Statement a. Measures profitability over a time period. b. Received, or receivable, from
- 9. Framework for Financial Analysis Analytical Tools Used Sources and Uses Statement Statement of Cash Flows Cash
- 10. Framework for Financial Analysis Health of a Firm Financial Ratios 1. Individually 2. Over time 3.
- 11. Framework for Financial Analysis Examples: Volatility in sales Volatility in costs Proximity to break-even point 1.
- 12. Framework for Financial Analysis A Financial Manager must consider all three jointly when determining the financing
- 13. Framework for Financial Analysis Negotiations with suppliers of capital. Determining the financing needs of the firm.
- 14. Use of Financial Ratios Types of Comparisons Internal Comparisons External Comparisons A Financial Ratio is an
- 15. External Comparisons and Sources of Industry Ratios Examples: Robert Morris Associates Dun & Bradstreet Almanac of
- 16. Liquidity Ratios Current Current Assets Current Liabilities For Basket Wonders December 31, 2003 Shows a firm’s
- 17. Liquidity Ratio Comparisons BW Industry 2.39 2.15 2.26 2.09 1.91 2.01 Year 2003 2002 2001 Current
- 18. Liquidity Ratios Acid-Test (Quick) Current Assets - Inv Current Liabilities For Basket Wonders December 31, 2003
- 19. Liquidity Ratio Comparisons BW Industry 1.00 1.25 1.04 1.23 1.11 1.25 Year 2003 2002 2001 Acid-Test
- 20. Summary of the Liquidity Ratio Comparisons Strong current ratio and weak acid-test ratio indicates a potential
- 21. Current Ratio -- Trend Analysis Comparison
- 22. Acid-Test Ratio -- Trend Analysis Comparison
- 23. Summary of the Liquidity Trend Analyses The current ratio for the industry has been rising slowly
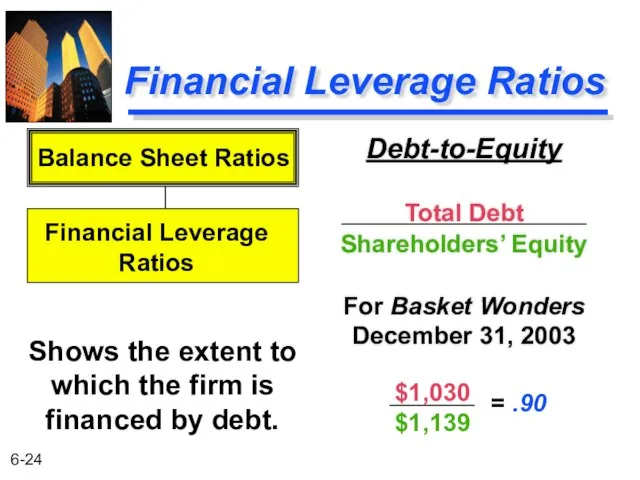
- 24. Financial Leverage Ratios Debt-to-Equity Total Debt Shareholders’ Equity For Basket Wonders December 31, 2003 Shows the
- 25. Financial Leverage Ratio Comparisons BW Industry .90 .90 .88 .90 .81 .89 Year 2003 2002 2001
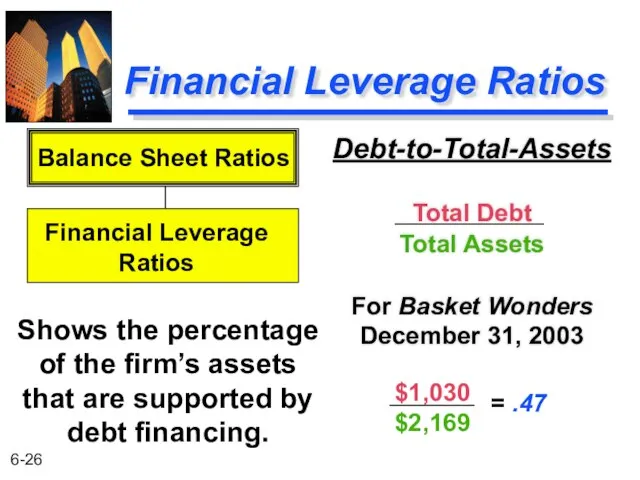
- 26. Financial Leverage Ratios Debt-to-Total-Assets Total Debt Total Assets For Basket Wonders December 31, 2003 Shows the
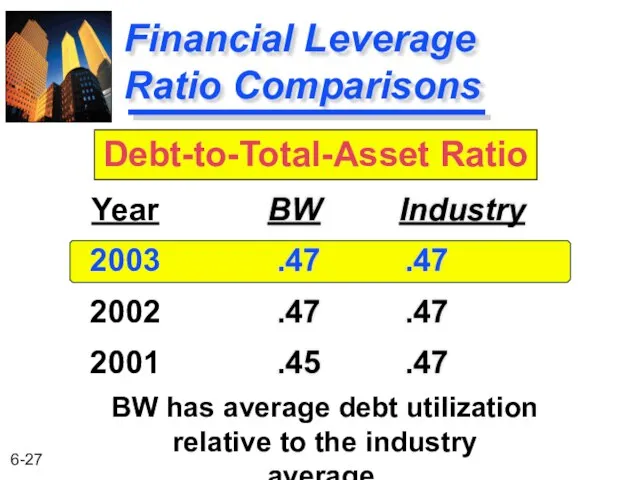
- 27. Financial Leverage Ratio Comparisons BW Industry .47 .47 .47 .47 .45 .47 Year 2003 2002 2001
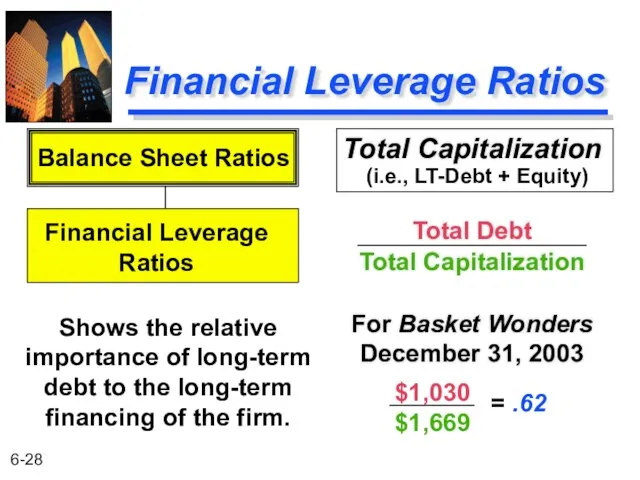
- 28. Financial Leverage Ratios Total Capitalization Total Debt Total Capitalization For Basket Wonders December 31, 2003 Shows
- 29. Financial Leverage Ratio Comparisons BW Industry .62 .60 .62 .61 .67 .62 Year 2003 2002 2001
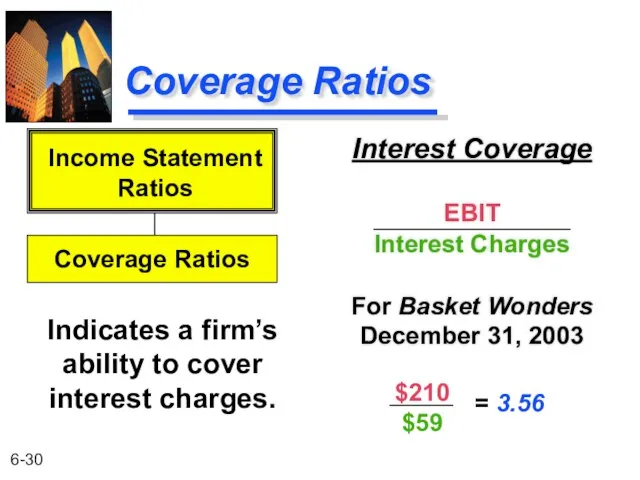
- 30. Coverage Ratios Interest Coverage EBIT Interest Charges For Basket Wonders December 31, 2003 Indicates a firm’s
- 31. Coverage Ratio Comparisons BW Industry 3.56 5.19 4.35 5.02 10.30 4.66 Year 2003 2002 2001 Interest
- 32. Coverage Ratio -- Trend Analysis Comparison
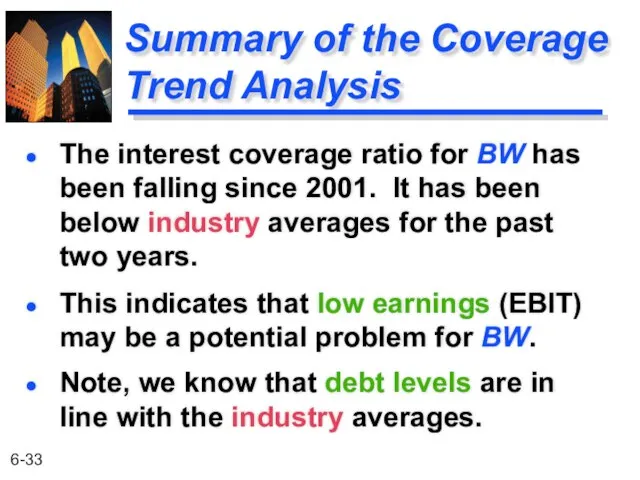
- 33. Summary of the Coverage Trend Analysis This indicates that low earnings (EBIT) may be a potential
- 34. Activity Ratios Receivable Turnover Annual Net Credit Sales Receivables For Basket Wonders December 31, 2003 Indicates
- 35. Activity Ratios Avg Collection Period Days in the Year Receivable Turnover For Basket Wonders December 31,
- 36. Activity Ratio Comparisons BW Industry 65.0 65.7 71.1 66.3 83.6 69.2 Year 2003 2002 2001 Average
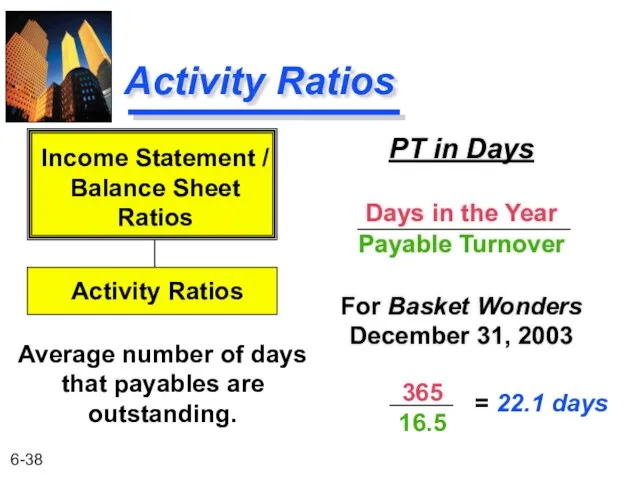
- 37. Activity Ratios Payable Turnover (PT) Annual Credit Purchases Accounts Payable For Basket Wonders December 31, 2003
- 38. Activity Ratios PT in Days Days in the Year Payable Turnover For Basket Wonders December 31,
- 39. Activity Ratio Comparisons BW Industry 22.1 46.7 25.4 51.1 43.5 48.5 Year 2003 2002 2001 Payable
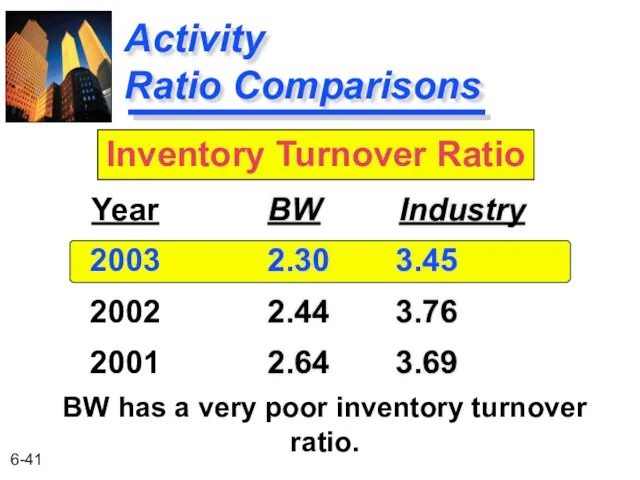
- 40. Activity Ratios Inventory Turnover Cost of Goods Sold Inventory For Basket Wonders December 31, 2003 Indicates
- 41. Activity Ratio Comparisons BW Industry 2.30 3.45 2.44 3.76 2.64 3.69 Year 2003 2002 2001 Inventory
- 42. Inventory Turnover Ratio --Trend Analysis Comparison
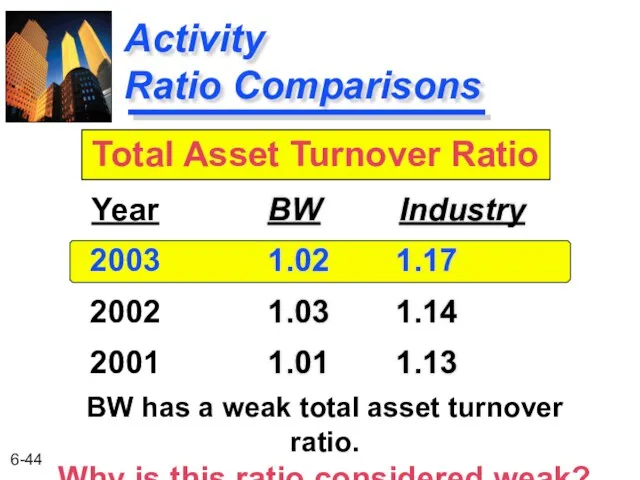
- 43. Activity Ratios Total Asset Turnover Net Sales Total Assets For Basket Wonders December 31, 2003 Indicates
- 44. Activity Ratio Comparisons BW Industry 1.02 1.17 1.03 1.14 1.01 1.13 Year 2003 2002 2001 Total
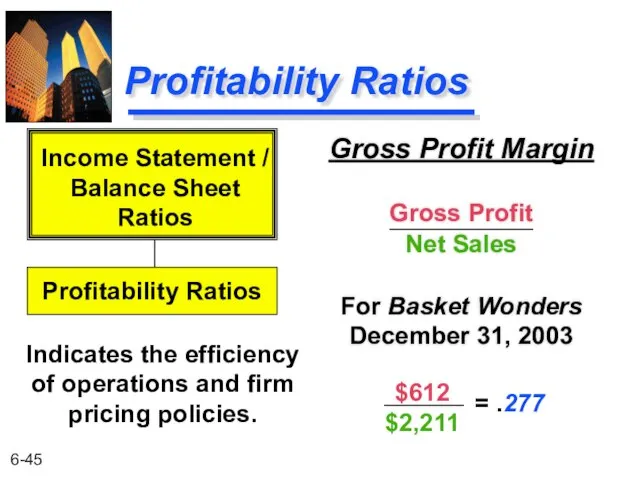
- 45. Profitability Ratios Gross Profit Margin Gross Profit Net Sales For Basket Wonders December 31, 2003 Indicates
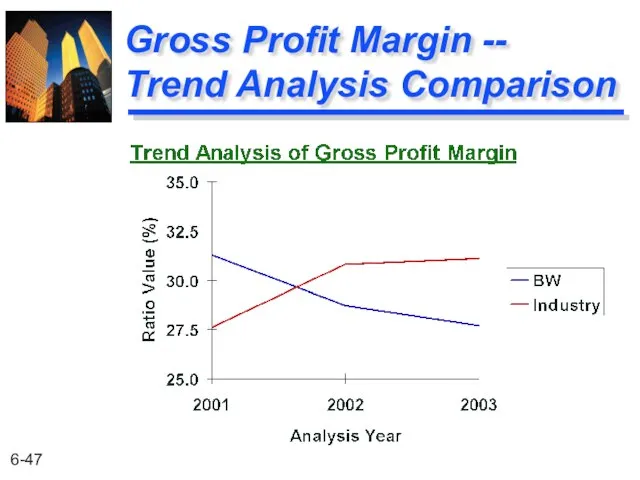
- 46. Profitability Ratio Comparisons BW Industry 27.7% 31.1% 28.7 30.8 31.3 27.6 Year 2003 2002 2001 Gross
- 47. Gross Profit Margin -- Trend Analysis Comparison
- 48. Profitability Ratios Net Profit Margin Net Profit after Taxes Net Sales For Basket Wonders December 31,
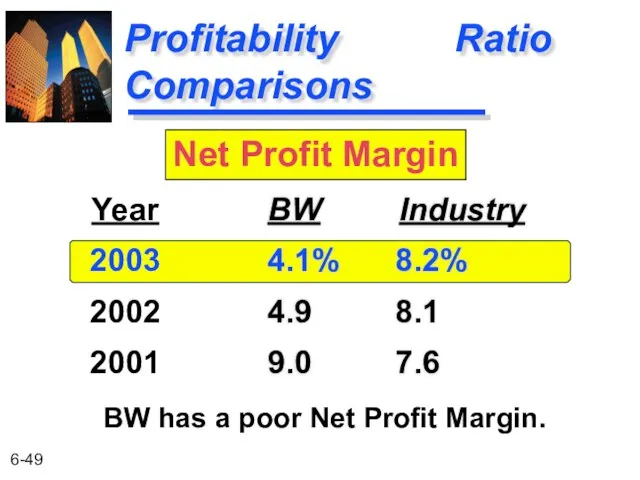
- 49. Profitability Ratio Comparisons BW Industry 4.1% 8.2% 4.9 8.1 9.0 7.6 Year 2003 2002 2001 Net
- 50. Net Profit Margin -- Trend Analysis Comparison
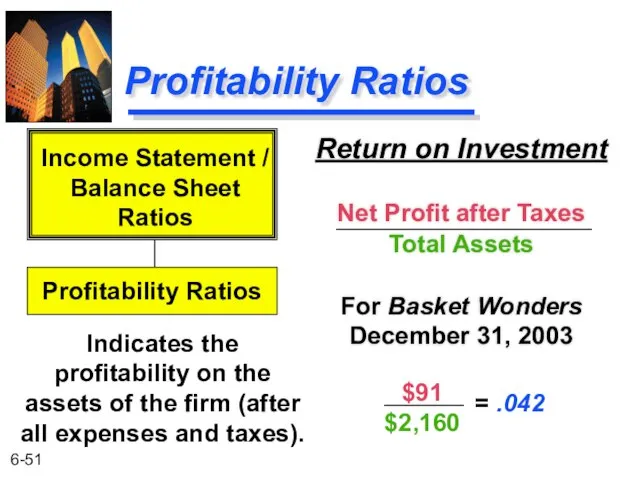
- 51. Profitability Ratios Return on Investment Net Profit after Taxes Total Assets For Basket Wonders December 31,
- 52. Profitability Ratio Comparisons BW Industry 4.2% 9.8% 5.0 9.1 9.1 10.8 Year 2003 2002 2001 Return
- 53. Return on Investment – Trend Analysis Comparison
- 54. Profitability Ratios Return on Equity Net Profit after Taxes Shareholders’ Equity For Basket Wonders December 31,
- 55. Profitability Ratio Comparisons BW Industry 8.0% 17.9% 9.4 17.2 16.6 20.4 Year 2003 2002 2001 Return
- 56. Return on Equity -- Trend Analysis Comparison
- 57. Return on Investment and the Du Pont Approach ROI2003 = .041 x 1.02 = .042 or
- 58. Return on Equity and the Du Pont Approach ROE2003 = .041 x 1.02 x 1.90 =
- 59. Summary of the Profitability Trend Analyses The profitability ratios for BW have ALL been falling since
- 60. Summary of Ratio Analyses Inventories are too high. May be paying off creditors (accounts payable) too
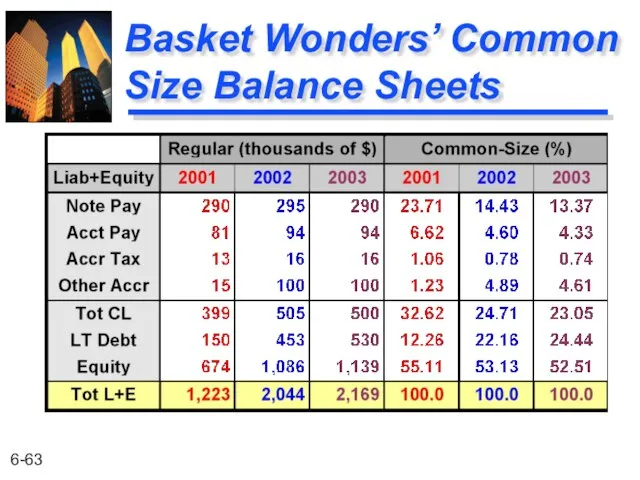
- 61. Common-size Analysis An analysis of percentage financial statements where all balance sheet items are divided by
- 62. Basket Wonders’ Common Size Balance Sheets
- 63. Basket Wonders’ Common Size Balance Sheets
- 64. Basket Wonders’ Common Size Income Statements
- 65. Index Analyses An analysis of percentage financial statements where all balance sheet or income statement figures
- 66. Basket Wonders’ Indexed Balance Sheets
- 67. Basket Wonders’ Indexed Balance Sheets
- 69. Скачать презентацию
Financial
Statement Analysis
Financial Statements
A Possible Framework for Analysis
Ratio Analysis
Trend Analysis
Common-Size and
Financial
Statement Analysis
Financial Statements
A Possible Framework for Analysis
Ratio Analysis
Trend Analysis
Common-Size and
Examples of External Uses of Statement Analysis
Trade Creditors -- Focus on
Examples of External Uses of Statement Analysis
Trade Creditors -- Focus on

Examples of Internal Uses of Statement Analysis
Plan -- Focus on assessing
Examples of Internal Uses of Statement Analysis
Plan -- Focus on assessing

Primary Types of Financial Statements
Income Statement
A summary of a firm’s revenues
Primary Types of Financial Statements
Income Statement
A summary of a firm’s revenues
Basket Wonders’ Balance Sheet (Asset Side)
a. How the firm stands on
Basket Wonders’ Balance Sheet (Asset Side)
a. How the firm stands on
Basket Wonders’ Balance Sheet (Liability Side)
a. Note, Assets = Liabilities +
Basket Wonders’ Balance Sheet (Liability Side)
a. Note, Assets = Liabilities +
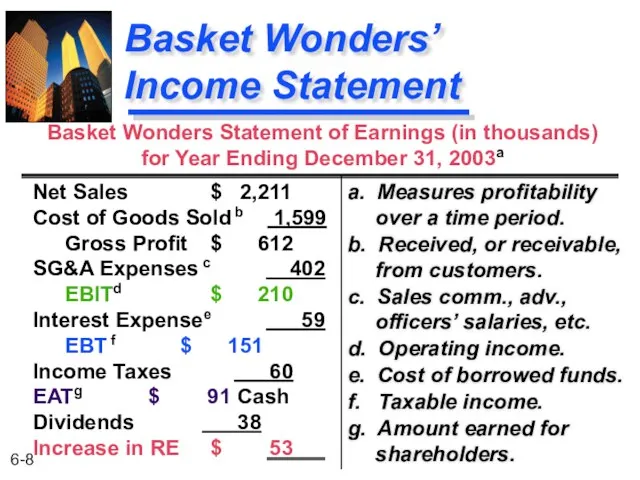
Basket Wonders’ Income Statement
a. Measures profitability over a time period.
b. Received,
Basket Wonders’ Income Statement
a. Measures profitability over a time period.
b. Received,
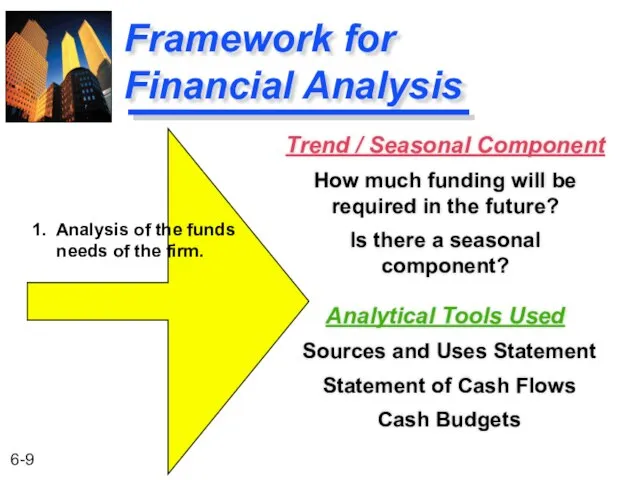
Framework for Financial Analysis
Analytical Tools Used
Sources and Uses Statement
Statement of Cash
Framework for Financial Analysis
Analytical Tools Used
Sources and Uses Statement
Statement of Cash
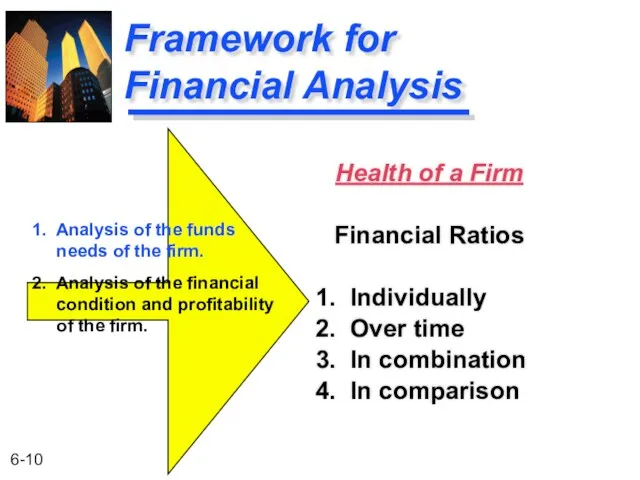
Framework for Financial Analysis
Health of a Firm
Financial Ratios
1. Individually
2. Over time
3.
Framework for Financial Analysis
Health of a Firm
Financial Ratios
1. Individually
2. Over time
3.

Framework for Financial Analysis
Examples:
Volatility in sales
Volatility in costs
Proximity to break-even point
1.
Framework for Financial Analysis
Examples:
Volatility in sales
Volatility in costs
Proximity to break-even point
1.

Framework for Financial Analysis
A Financial Manager must consider all three jointly
Framework for Financial Analysis
A Financial Manager must consider all three jointly
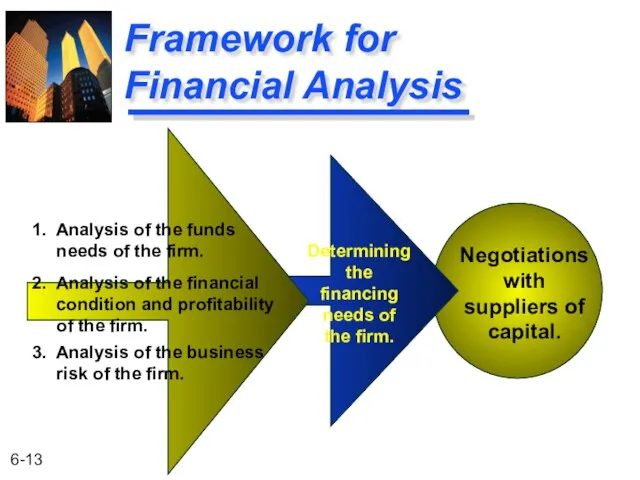
Framework for Financial Analysis
Negotiations
with
suppliers of
capital.
Determining
the
financing
needs of
the firm.
1. Analysis of
Framework for Financial Analysis
Negotiations
with
suppliers of
capital.
Determining
the
financing
needs of
the firm.
1. Analysis of
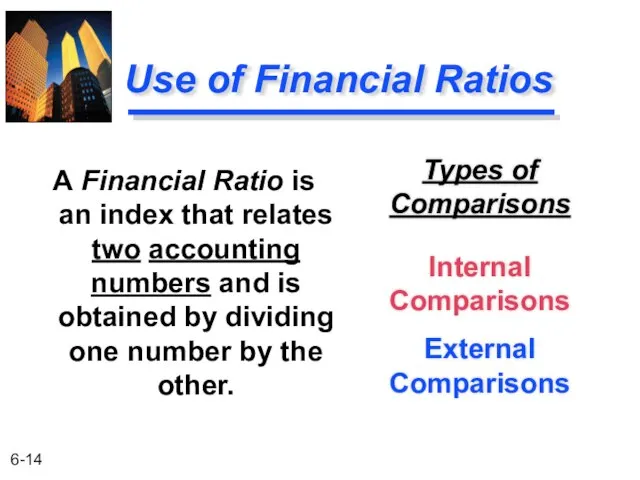
Use of Financial Ratios
Types of Comparisons
Internal Comparisons
External Comparisons
A Financial Ratio is
Use of Financial Ratios
Types of Comparisons
Internal Comparisons
External Comparisons
A Financial Ratio is
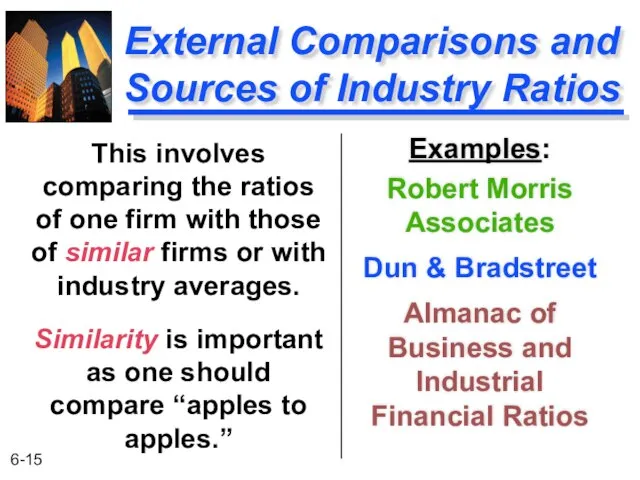
External Comparisons and Sources of Industry Ratios
Examples:
Robert Morris Associates
Dun & Bradstreet
Almanac
External Comparisons and Sources of Industry Ratios
Examples:
Robert Morris Associates
Dun & Bradstreet
Almanac

Liquidity Ratios
Current
Current Assets
Current Liabilities
For Basket Wonders December 31, 2003
Shows a firm’s
Liquidity Ratios
Current
Current Assets
Current Liabilities
For Basket Wonders December 31, 2003
Shows a firm’s

Liquidity Ratio Comparisons
BW Industry
2.39 2.15
2.26 2.09
1.91 2.01
Year
2003
2002
2001
Current Ratio
Ratio is stronger than the industry average.
Liquidity Ratio Comparisons
BW Industry
2.39 2.15
2.26 2.09
1.91 2.01
Year
2003
2002
2001
Current Ratio
Ratio is stronger than the industry average.
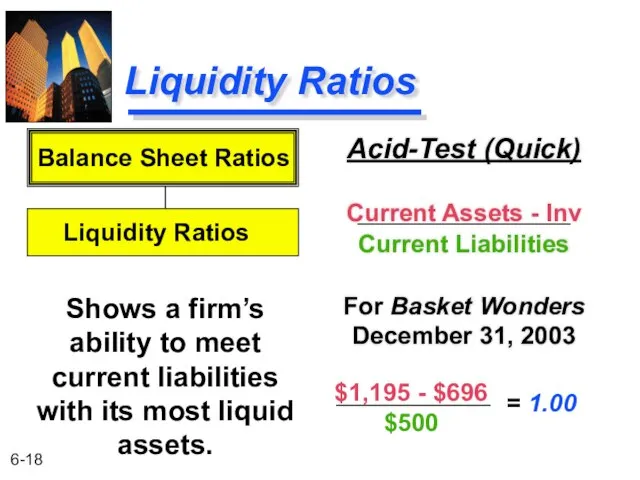
Liquidity Ratios
Acid-Test (Quick)
Current Assets - Inv
Current Liabilities
For Basket Wonders December 31,
Liquidity Ratios
Acid-Test (Quick)
Current Assets - Inv
Current Liabilities
For Basket Wonders December 31,
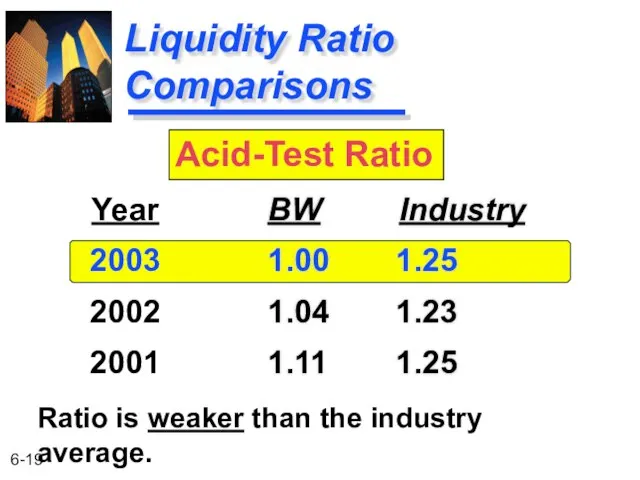
Liquidity Ratio Comparisons
BW Industry
1.00 1.25
1.04 1.23
1.11 1.25
Year
2003
2002
2001
Acid-Test Ratio
Ratio is weaker than the industry average.
Liquidity Ratio Comparisons
BW Industry
1.00 1.25
1.04 1.23
1.11 1.25
Year
2003
2002
2001
Acid-Test Ratio
Ratio is weaker than the industry average.
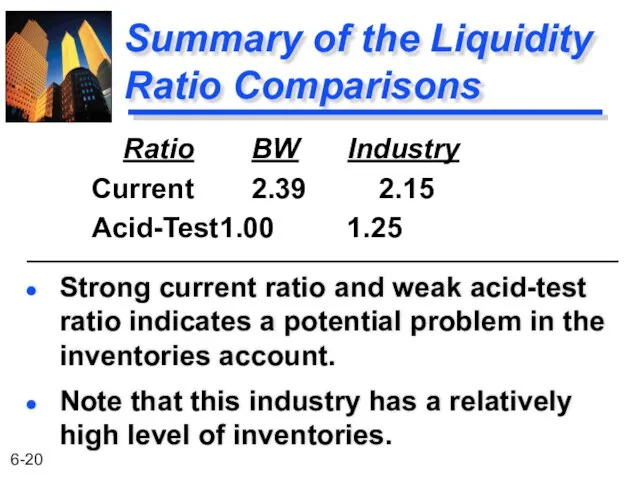
Summary of the Liquidity Ratio Comparisons
Strong current ratio and weak acid-test
Summary of the Liquidity Ratio Comparisons
Strong current ratio and weak acid-test
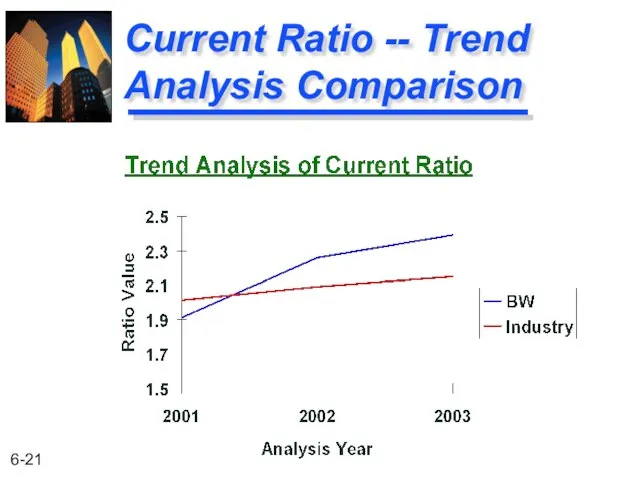
Current Ratio -- Trend Analysis Comparison
Current Ratio -- Trend Analysis Comparison

Acid-Test Ratio -- Trend Analysis Comparison
Acid-Test Ratio -- Trend Analysis Comparison
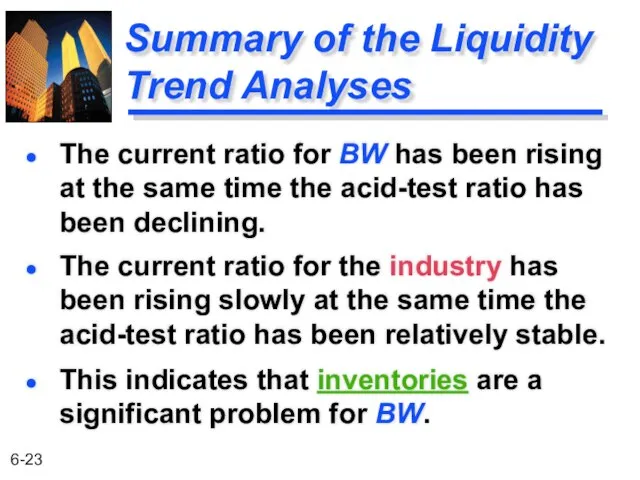
Summary of the Liquidity Trend Analyses
The current ratio for the industry
Summary of the Liquidity Trend Analyses
The current ratio for the industry
Financial Leverage Ratios
Debt-to-Equity
Total Debt
Shareholders’ Equity
For Basket Wonders December 31, 2003
Shows the
Financial Leverage Ratios
Debt-to-Equity
Total Debt
Shareholders’ Equity
For Basket Wonders December 31, 2003
Shows the

Financial Leverage
Ratio Comparisons
BW Industry
.90 .90
.88 .90
.81 .89
Year
2003
2002
2001
Debt-to-Equity
Financial Leverage
Ratio Comparisons
BW Industry
.90 .90
.88 .90
.81 .89
Year
2003
2002
2001
Debt-to-Equity
Financial Leverage Ratios
Debt-to-Total-Assets
Total Debt
Total Assets
For Basket Wonders December 31, 2003
Shows the
Financial Leverage Ratios
Debt-to-Total-Assets
Total Debt
Total Assets
For Basket Wonders December 31, 2003
Shows the
Financial Leverage
Ratio Comparisons
BW Industry
.47 .47
.47 .47
.45 .47
Year
2003
2002
2001
Debt-to-Total-Asset
Financial Leverage
Ratio Comparisons
BW Industry
.47 .47
.47 .47
.45 .47
Year
2003
2002
2001
Debt-to-Total-Asset
Financial Leverage Ratios
Total Capitalization
Total Debt
Total Capitalization
For Basket Wonders December 31, 2003
Shows
Financial Leverage Ratios
Total Capitalization
Total Debt
Total Capitalization
For Basket Wonders December 31, 2003
Shows

Financial Leverage
Ratio Comparisons
BW Industry
.62 .60
.62 .61
.67 .62
Year
2003
2002
2001
Total
Financial Leverage
Ratio Comparisons
BW Industry
.62 .60
.62 .61
.67 .62
Year
2003
2002
2001
Total
Coverage Ratios
Interest Coverage
EBIT
Interest Charges
For Basket Wonders December 31, 2003
Indicates a firm’s
Coverage Ratios
Interest Coverage
EBIT
Interest Charges
For Basket Wonders December 31, 2003
Indicates a firm’s

Coverage
Ratio Comparisons
BW Industry
3.56 5.19
4.35 5.02
10.30 4.66
Year
2003
2002
2001
Interest Coverage Ratio
BW has below average
Coverage
Ratio Comparisons
BW Industry
3.56 5.19
4.35 5.02
10.30 4.66
Year
2003
2002
2001
Interest Coverage Ratio
BW has below average
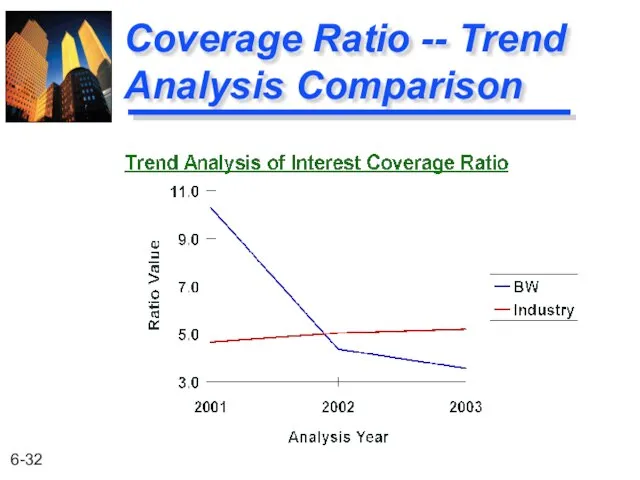
Coverage Ratio -- Trend Analysis Comparison
Coverage Ratio -- Trend Analysis Comparison
Summary of the Coverage Trend Analysis
This indicates that low earnings (EBIT)
Summary of the Coverage Trend Analysis
This indicates that low earnings (EBIT)
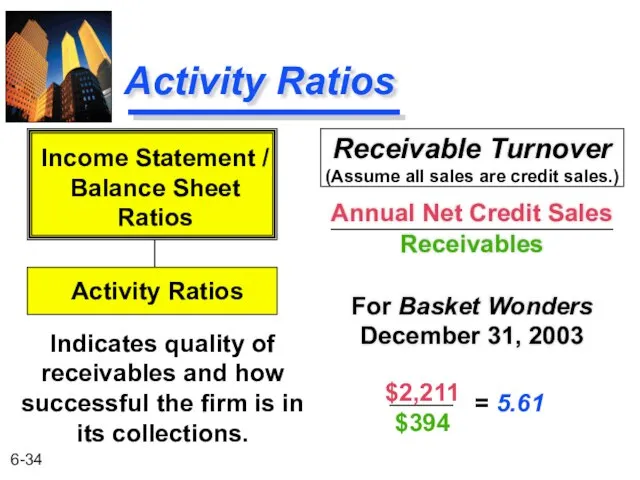
Activity Ratios
Receivable Turnover
Annual Net Credit Sales
Receivables
For Basket Wonders December 31, 2003
Indicates
Activity Ratios
Receivable Turnover
Annual Net Credit Sales
Receivables
For Basket Wonders December 31, 2003
Indicates

Activity Ratios
Avg Collection Period
Days in the Year
Receivable Turnover
For Basket Wonders December
Activity Ratios
Avg Collection Period
Days in the Year
Receivable Turnover
For Basket Wonders December

Activity
Ratio Comparisons
BW Industry
65.0 65.7
71.1 66.3
83.6 69.2
Year
2003
2002
2001
Average Collection Period
BW has improved the average collection
period
Activity
Ratio Comparisons
BW Industry
65.0 65.7
71.1 66.3
83.6 69.2
Year
2003
2002
2001
Average Collection Period
BW has improved the average collection
period
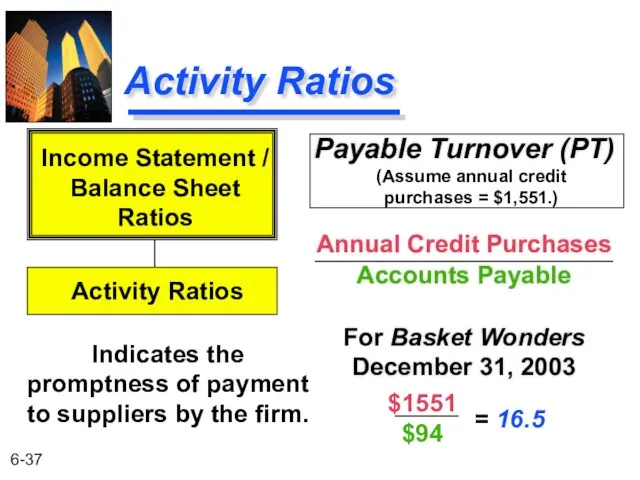
Activity Ratios
Payable Turnover (PT)
Annual Credit Purchases
Accounts Payable
For Basket Wonders December 31,
Activity Ratios
Payable Turnover (PT)
Annual Credit Purchases
Accounts Payable
For Basket Wonders December 31,
Activity Ratios
PT in Days
Days in the Year
Payable Turnover
For Basket Wonders December
Activity Ratios
PT in Days
Days in the Year
Payable Turnover
For Basket Wonders December

Activity
Ratio Comparisons
BW Industry
22.1 46.7
25.4 51.1
43.5 48.5
Year
2003
2002
2001
Payable Turnover in Days
BW has improved the PT in
Activity
Ratio Comparisons
BW Industry
22.1 46.7
25.4 51.1
43.5 48.5
Year
2003
2002
2001
Payable Turnover in Days
BW has improved the PT in

Activity Ratios
Inventory Turnover
Cost of Goods Sold
Inventory
For Basket Wonders December 31, 2003
Indicates
Activity Ratios
Inventory Turnover
Cost of Goods Sold
Inventory
For Basket Wonders December 31, 2003
Indicates
Activity
Ratio Comparisons
BW Industry
2.30 3.45
2.44 3.76
2.64 3.69
Year
2003
2002
2001
Inventory Turnover Ratio
BW has a very poor inventory turnover
Activity
Ratio Comparisons
BW Industry
2.30 3.45
2.44 3.76
2.64 3.69
Year
2003
2002
2001
Inventory Turnover Ratio
BW has a very poor inventory turnover
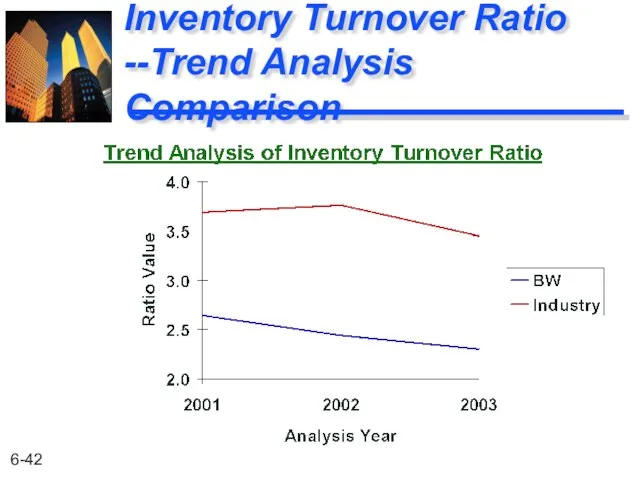
Inventory Turnover Ratio --Trend Analysis Comparison
Inventory Turnover Ratio --Trend Analysis Comparison

Activity Ratios
Total Asset Turnover
Net Sales
Total Assets
For Basket Wonders December 31, 2003
Indicates
Activity Ratios
Total Asset Turnover
Net Sales
Total Assets
For Basket Wonders December 31, 2003
Indicates
Activity
Ratio Comparisons
BW Industry
1.02 1.17
1.03 1.14
1.01 1.13
Year
2003
2002
2001
Total Asset Turnover Ratio
BW has a weak total asset
Activity
Ratio Comparisons
BW Industry
1.02 1.17
1.03 1.14
1.01 1.13
Year
2003
2002
2001
Total Asset Turnover Ratio
BW has a weak total asset
Profitability Ratios
Gross Profit Margin
Gross Profit
Net Sales
For Basket Wonders December 31, 2003
Indicates
Profitability Ratios
Gross Profit Margin
Gross Profit
Net Sales
For Basket Wonders December 31, 2003
Indicates

Profitability
Ratio Comparisons
BW Industry
27.7% 31.1%
28.7 30.8
31.3 27.6
Year
2003
2002
2001
Gross Profit Margin
BW has a weak Gross Profit Margin.
Profitability
Ratio Comparisons
BW Industry
27.7% 31.1%
28.7 30.8
31.3 27.6
Year
2003
2002
2001
Gross Profit Margin
BW has a weak Gross Profit Margin.
Gross Profit Margin --
Trend Analysis Comparison
Gross Profit Margin --
Trend Analysis Comparison

Profitability Ratios
Net Profit Margin
Net Profit after Taxes
Net Sales
For Basket Wonders December
Profitability Ratios
Net Profit Margin
Net Profit after Taxes
Net Sales
For Basket Wonders December
Profitability Ratio Comparisons
BW Industry
4.1% 8.2%
4.9 8.1
9.0 7.6
Year
2003
2002
2001
Net Profit Margin
BW has a poor Net Profit
Profitability Ratio Comparisons
BW Industry
4.1% 8.2%
4.9 8.1
9.0 7.6
Year
2003
2002
2001
Net Profit Margin
BW has a poor Net Profit

Net Profit Margin --
Trend Analysis Comparison
Net Profit Margin --
Trend Analysis Comparison
Profitability Ratios
Return on Investment
Net Profit after Taxes
Total Assets
For Basket Wonders December
Profitability Ratios
Return on Investment
Net Profit after Taxes
Total Assets
For Basket Wonders December

Profitability Ratio Comparisons
BW Industry
4.2% 9.8%
5.0 9.1
9.1 10.8
Year
2003
2002
2001
Return on Investment
BW has a poor
Profitability Ratio Comparisons
BW Industry
4.2% 9.8%
5.0 9.1
9.1 10.8
Year
2003
2002
2001
Return on Investment
BW has a poor

Return on Investment –
Trend Analysis Comparison
Return on Investment –
Trend Analysis Comparison

Profitability Ratios
Return on Equity
Net Profit after Taxes
Shareholders’ Equity
For Basket Wonders December
Profitability Ratios
Return on Equity
Net Profit after Taxes
Shareholders’ Equity
For Basket Wonders December

Profitability Ratio Comparisons
BW Industry
8.0% 17.9%
9.4 17.2
16.6 20.4
Year
2003
2002
2001
Return on Equity
BW has a
Profitability Ratio Comparisons
BW Industry
8.0% 17.9%
9.4 17.2
16.6 20.4
Year
2003
2002
2001
Return on Equity
BW has a

Return on Equity --
Trend Analysis Comparison
Return on Equity --
Trend Analysis Comparison
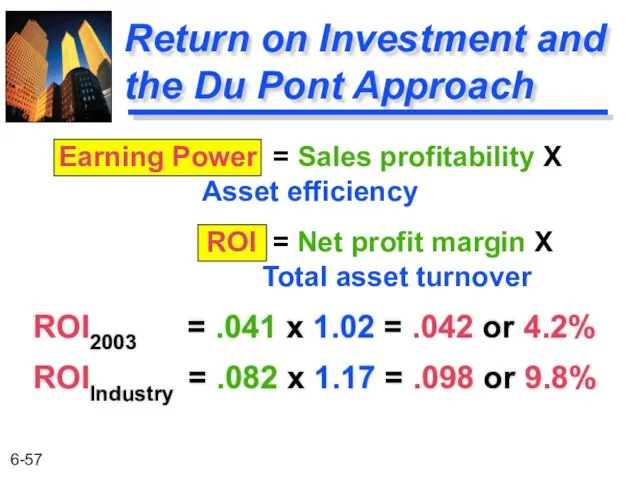
Return on Investment and the Du Pont Approach
ROI2003 = .041 x
Return on Investment and the Du Pont Approach
ROI2003 = .041 x
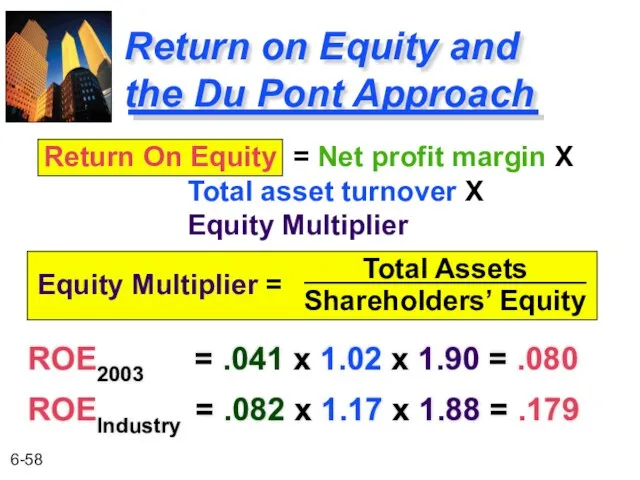
Return on Equity and
the Du Pont Approach
ROE2003 = .041 x
Return on Equity and
the Du Pont Approach
ROE2003 = .041 x
Summary of the Profitability Trend Analyses
The profitability ratios for BW have
Summary of the Profitability Trend Analyses
The profitability ratios for BW have

Summary of Ratio Analyses
Inventories are too high.
May be paying off creditors
Summary of Ratio Analyses
Inventories are too high.
May be paying off creditors

Common-size Analysis
An analysis of percentage financial statements where all balance sheet
Common-size Analysis
An analysis of percentage financial statements where all balance sheet
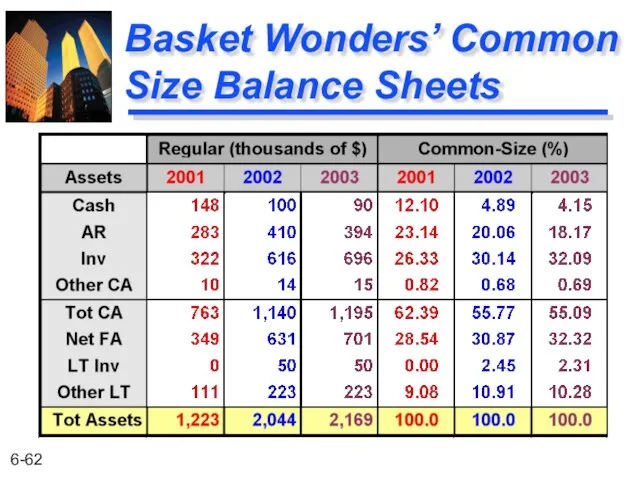
Basket Wonders’ Common Size Balance Sheets
Basket Wonders’ Common Size Balance Sheets
Basket Wonders’ Common Size Balance Sheets
Basket Wonders’ Common Size Balance Sheets

Basket Wonders’ Common Size Income Statements
Basket Wonders’ Common Size Income Statements

Index Analyses
An analysis of percentage financial statements where all balance sheet
Index Analyses
An analysis of percentage financial statements where all balance sheet
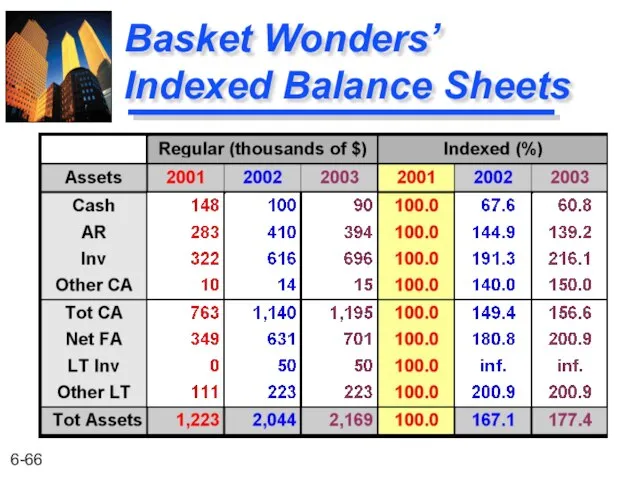
Basket Wonders’
Indexed Balance Sheets
Basket Wonders’
Indexed Balance Sheets

Basket Wonders’
Indexed Balance Sheets
Basket Wonders’
Indexed Balance Sheets
 Портфельное инвестрование. Сущность и виды инвестиционного портфеля
 Понятие себестоимости. Роль себестоимости в обеспечении конкурентоспособности продукции предприятия
 Источники финансирования инвестиционной деятельности
 Государственный долг. Долговая политика РФ на современном этапе
 VentureMeet_МИК_общая_18-08-22-1 (3)
 Деньги. Кредит. Банки
 Налоги и налогообложение. Теоретические основы налогообложения. Налоговая система РФ
 Информация по выписке счет-фактуры за наличный расчет ТОО Газпром нефть-Казахстан
 Stock Market
 Расчетная работа ОАО Мечел. Аналитический баланс, вертикальный и горизонтальный анализ
 Содержание и принципы межбюджетных отношений
 Типовой вариант экзамена
 Конвенция Юнситрал о международных переводных векселях и международных простых векселях
 Кредитные карты. Кредит Европа Банк
 Программа смешанного страхования жизни Гармония жизни
 Своя игра. Налогообложение
 Ценообразование на мировом рынке товаров и услуг
 Концепция консолидированного бюджета Белгородской области
 Доходный подход
 Аудит кредиторской задолженности
 История развития страхования в 21 веке в Германии
 Учёт расчётных операций
 Дебетовые карты
 Презентация Болдинова
 Основи фінансової діяльності підприємства. Тема 6
 Программа страхования имущества при оплате коммунальных платежей
 Финансовый ликбез
 Управление дебиторской задолженностью и денежными активами предприятия