- Stock Market

Содержание
- 2. Stock Market Financial data reflect the day to day decision making of the society
- 3. Baseline We find that returns from the Google Trends strategies we tested are significantly higher overall
- 4. Google Trends Search to Sale Quantifying Trading Behavior in Financial Markets Using Google Trends. By Tobias
- 5. Results and interpretation Our Google trends algorithm slightly shows much better than the randomn model. It
- 7. Скачать презентацию

Stock Market
Financial data reflect the day to day decision making of
Stock Market
Financial data reflect the day to day decision making of

Baseline
We find that returns from the Google Trends strategies we tested
Baseline
We find that returns from the Google Trends strategies we tested

Google Trends
Search to Sale
Quantifying Trading Behavior in Financial Markets Using Google
Google Trends
Search to Sale
Quantifying Trading Behavior in Financial Markets Using Google

Results and interpretation
Our Google trends algorithm slightly shows much better than
Results and interpretation
Our Google trends algorithm slightly shows much better than
 Работа с информацией
 Финансовая стратегия компании
 Фундаментальные теоретические концепции финансового менеджмента. Тема 2
 Понятие финансового контроля
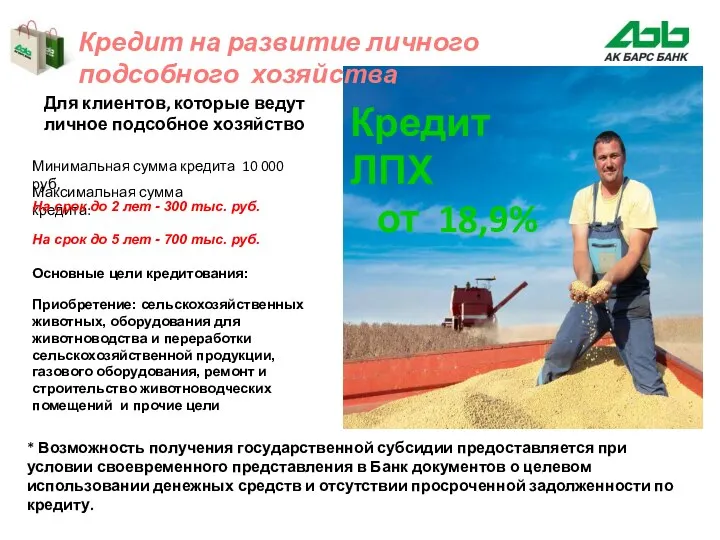 Кредит на развитие личного подсобного хозяйства
 Індивідуальна робота. Електронні банківські послуги, інструментом надання яких виступають системи дистанційного обслуговування
 Системы и формы оплаты труда
 Оператор Фискальных Данных. Процесс подключения и условия взаимодействия
 Движение и распределение денежных средств
 Банктiк қызмет көрсету шарты
 Виды, формы и системы оплаты труда. Тема 6
 Тенденции развития финансовых рынков за рубежом и их роль в финансировании экономики
 Государственные внебюджетные фонды РФ. (Лекция 3)
 Я менеджер
 Зарплатный проект ВТБ24
 Структура и инструменты современного мирового валютного рынка
 Эффективное управление личными деньгами
 Административно-правовое регулирование страховой деятельности в Российской Федерации
 Основы теории налогообложения. Основные понятия и определения
 Центральний банк у банківській системі України
 Франчайзинг, как особая форма вертикальных ограничений
 Основные средства предприятия. Основные формулы
 Наши компетенции: Мы точно знаем что надо делать, чтобы вернуть Ваши деньги
 О порядке составления годовой бюджетной и бухгалтерской отчетности за 2021 год
 ОАО Э.ОН Россия. Система вознаграждения непроизводственного персонала филиалов
 Разумный инвестор. Полное руководство по стоимостному инвестированию
 Обращение по акции. Бесплатное обслуживание Tinkoff Black
 Управління грошовими потоками підприємства на прикладі ПАТ Миронівський хлібопродукт