- Sensors and actuators

Содержание
- 2. Sensors and Transducers (definition) Pr. Nazim Mir-Nasiri Sensors are used for an element which produces a
- 3. Sensors performance terminology and specifications Pr. Nazim Mir-Nasiri Range and span Range defines the limits between
- 4. Sensors performance terminology and specifications Pr. Nazim Mir-Nasiri Accuracy is the extend to which the value
- 5. Sensors performance terminology and specifications Pr. Nazim Mir-Nasiri Sensitivity is relationship indicating how much output you
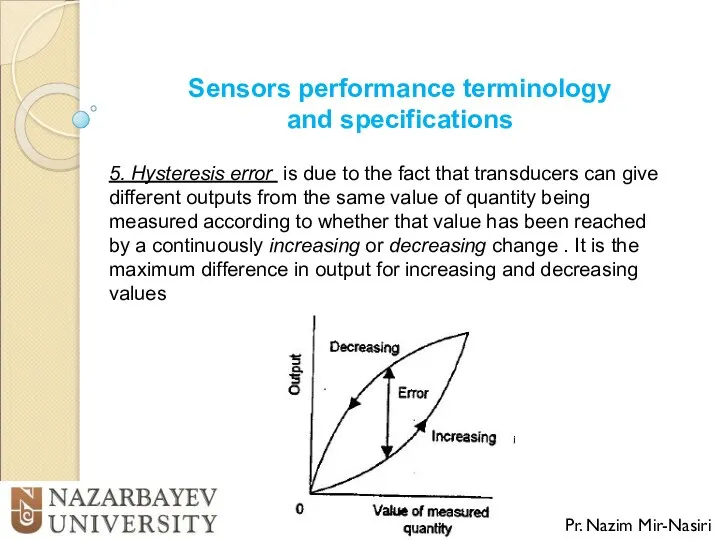
- 6. Sensors performance terminology and specifications Pr. Nazim Mir-Nasiri 5. Hysteresis error is due to the fact
- 7. Sensors performance terminology and specifications Pr. Nazim Mir-Nasiri 6. Non-linearity error is due to the fact
- 8. Sensors performance terminology and specifications Pr. Nazim Mir-Nasiri 6. Non-linearity error a. The error is defined
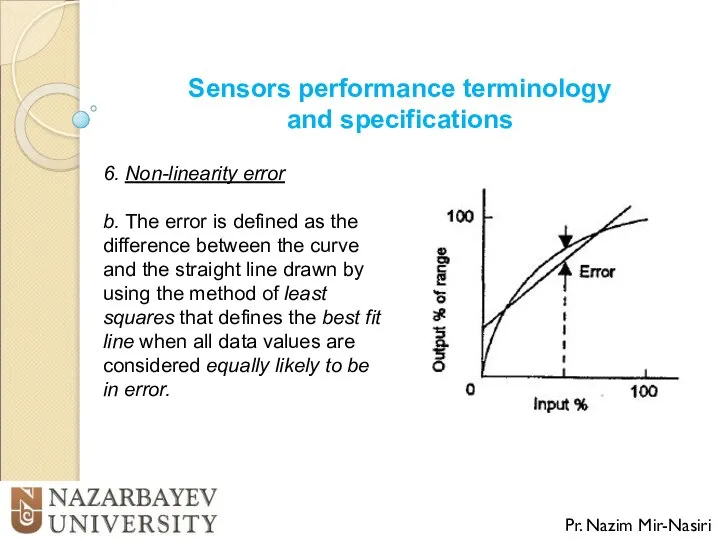
- 9. Sensors performance terminology and specifications Pr. Nazim Mir-Nasiri 6. Non-linearity error b. The error is defined
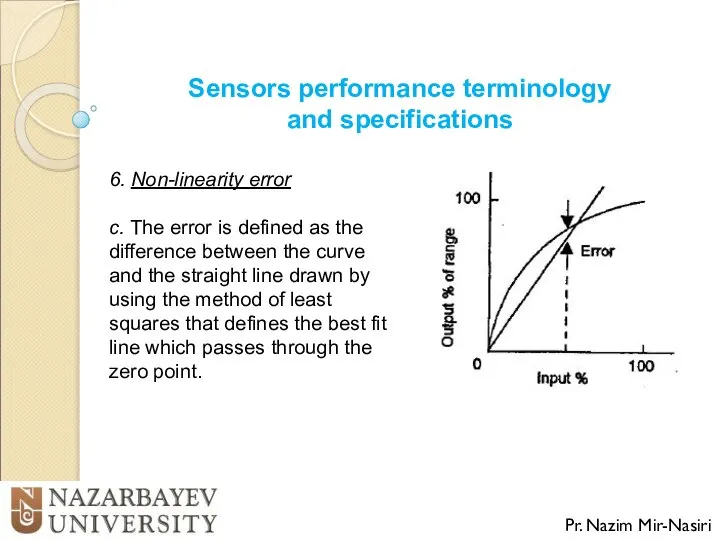
- 10. Sensors performance terminology and specifications Pr. Nazim Mir-Nasiri 6. Non-linearity error c. The error is defined
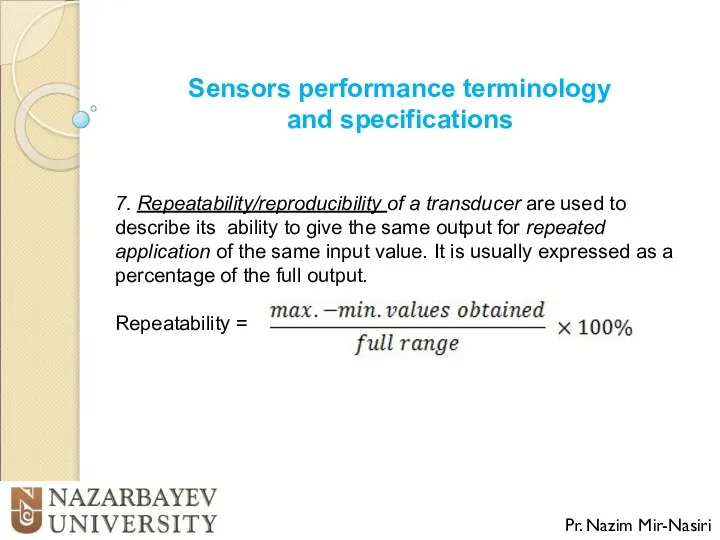
- 11. Sensors performance terminology and specifications Pr. Nazim Mir-Nasiri 7. Repeatability/reproducibility of a transducer are used to
- 12. Sensors performance terminology and specifications Pr. Nazim Mir-Nasiri 8. Stability of a transducer is its ability
- 13. Sensors performance terminology and specifications Pr. Nazim Mir-Nasiri 9. Dead band/time of a transducer is the
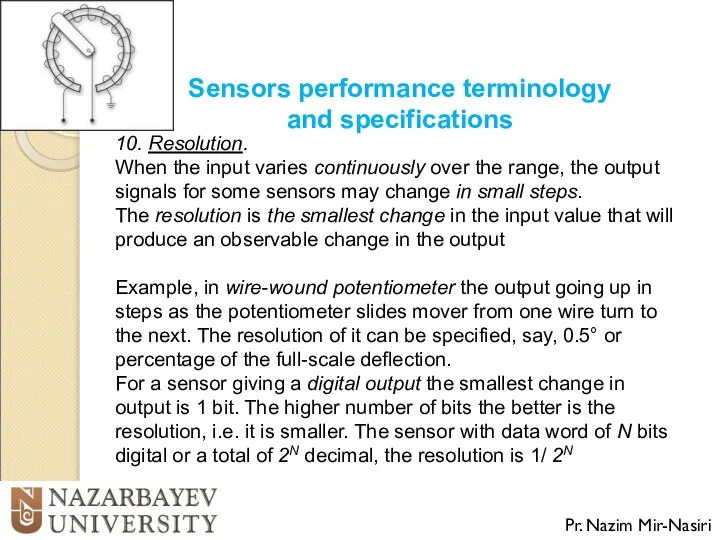
- 14. Sensors performance terminology and specifications Pr. Nazim Mir-Nasiri 10. Resolution. When the input varies continuously over
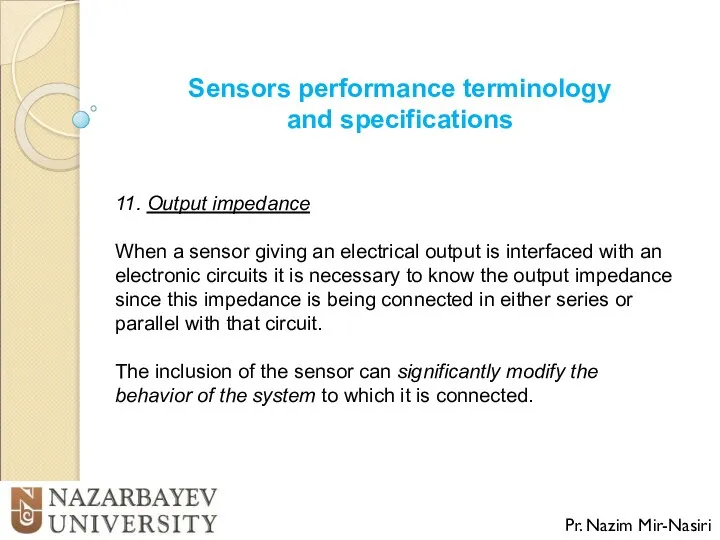
- 15. Sensors performance terminology and specifications Pr. Nazim Mir-Nasiri 11. Output impedance When a sensor giving an
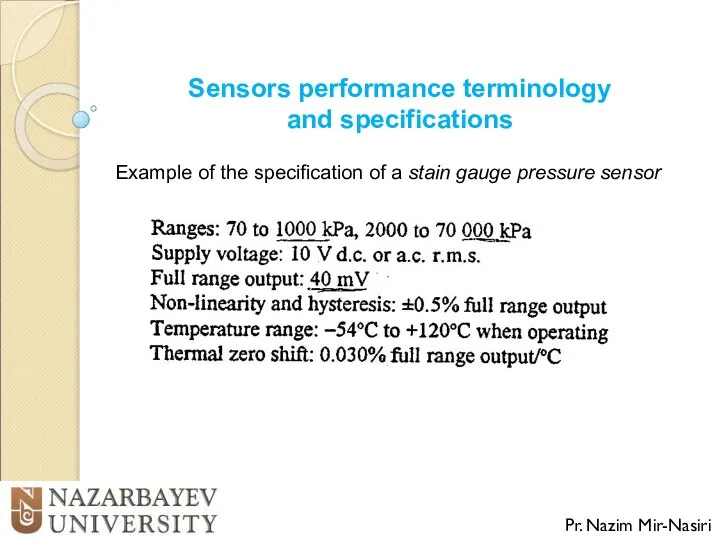
- 16. Sensors performance terminology and specifications Pr. Nazim Mir-Nasiri Example of the specification of a stain gauge
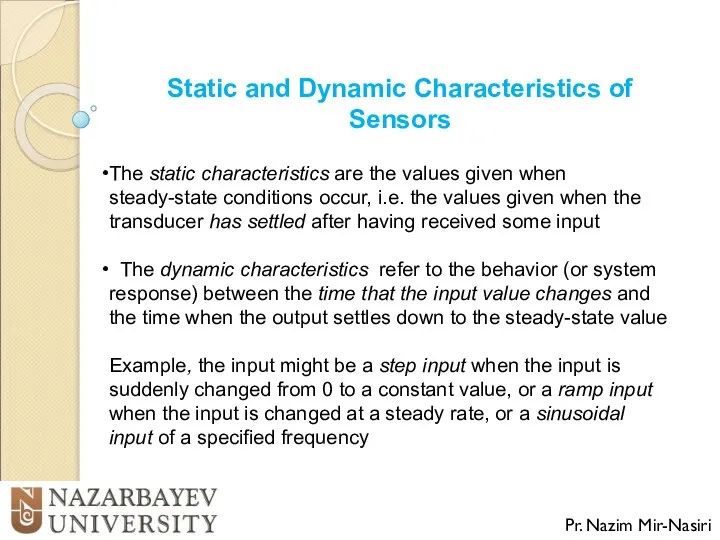
- 17. Static and Dynamic Characteristics of Sensors Pr. Nazim Mir-Nasiri The static characteristics are the values given
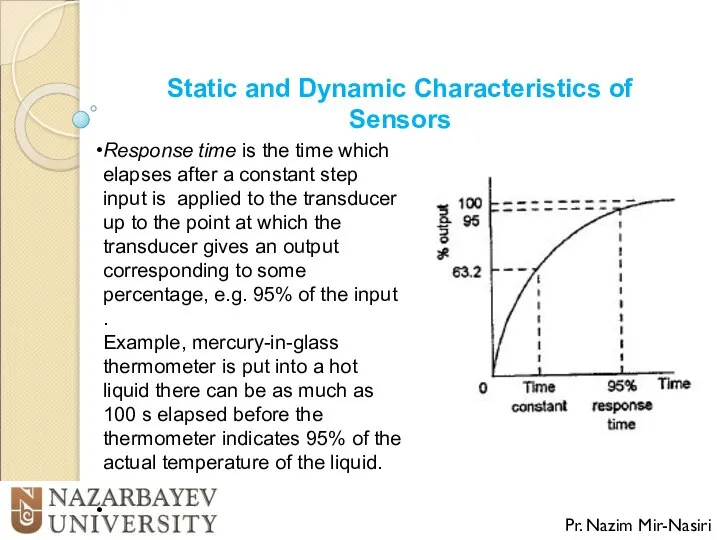
- 18. Static and Dynamic Characteristics of Sensors Pr. Nazim Mir-Nasiri Response time is the time which elapses
- 19. Static and Dynamic Characteristics of Sensors Pr. Nazim Mir-Nasiri Time constant is the 63.2% response time.
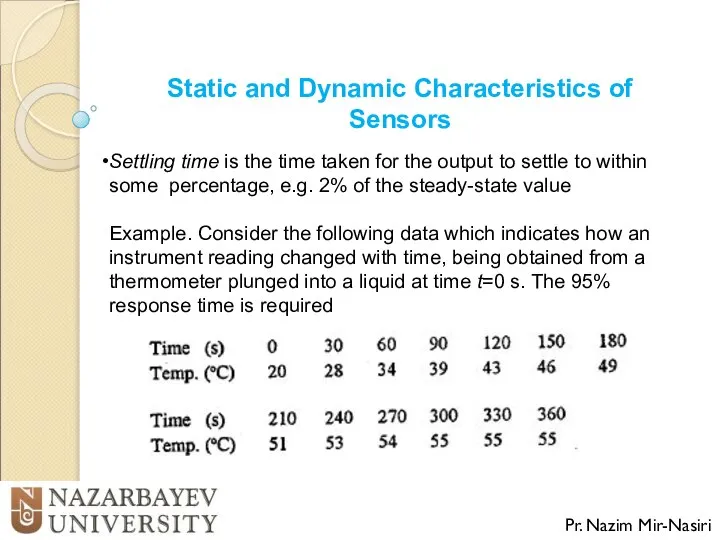
- 20. Static and Dynamic Characteristics of Sensors Pr. Nazim Mir-Nasiri Settling time is the time taken for
- 21. Static and Dynamic Characteristics of Sensors Pr. Nazim Mir-Nasiri Example. Fig. shows the graph of how
- 23. Скачать презентацию
Sensors and Transducers
(definition)
Pr. Nazim Mir-Nasiri
Sensors are used for an element
Sensors and Transducers
(definition)
Pr. Nazim Mir-Nasiri
Sensors are used for an element
Sensors performance terminology and specifications
Pr. Nazim Mir-Nasiri
Range and span
Sensors performance terminology and specifications
Pr. Nazim Mir-Nasiri
Range and span
Sensors performance terminology and specifications
Pr. Nazim Mir-Nasiri
Accuracy is the extend
Sensors performance terminology and specifications
Pr. Nazim Mir-Nasiri
Accuracy is the extend
Sensors performance terminology and specifications
Pr. Nazim Mir-Nasiri
Sensitivity is relationship indicating
Sensors performance terminology and specifications
Pr. Nazim Mir-Nasiri
Sensitivity is relationship indicating
Sensors performance terminology and specifications
Pr. Nazim Mir-Nasiri
5. Hysteresis error is
Sensors performance terminology and specifications
Pr. Nazim Mir-Nasiri
5. Hysteresis error is
Sensors performance terminology and specifications
Pr. Nazim Mir-Nasiri
6. Non-linearity error is
Sensors performance terminology and specifications
Pr. Nazim Mir-Nasiri
6. Non-linearity error is

Sensors performance terminology and specifications
Pr. Nazim Mir-Nasiri
6. Non-linearity error
a. The
Sensors performance terminology and specifications
Pr. Nazim Mir-Nasiri
6. Non-linearity error
a. The
Sensors performance terminology and specifications
Pr. Nazim Mir-Nasiri
6. Non-linearity error
b. The
Sensors performance terminology and specifications
Pr. Nazim Mir-Nasiri
6. Non-linearity error
b. The
Sensors performance terminology and specifications
Pr. Nazim Mir-Nasiri
6. Non-linearity error
c. The
Sensors performance terminology and specifications
Pr. Nazim Mir-Nasiri
6. Non-linearity error
c. The
Sensors performance terminology and specifications
Pr. Nazim Mir-Nasiri
7. Repeatability/reproducibility of a
Sensors performance terminology and specifications
Pr. Nazim Mir-Nasiri
7. Repeatability/reproducibility of a
Sensors performance terminology and specifications
Pr. Nazim Mir-Nasiri
8. Stability of a
Sensors performance terminology and specifications
Pr. Nazim Mir-Nasiri
8. Stability of a
Sensors performance terminology and specifications
Pr. Nazim Mir-Nasiri
9. Dead band/time of
Sensors performance terminology and specifications
Pr. Nazim Mir-Nasiri
9. Dead band/time of
Sensors performance terminology and specifications
Pr. Nazim Mir-Nasiri
10. Resolution.
When the input
Sensors performance terminology and specifications
Pr. Nazim Mir-Nasiri
10. Resolution.
When the input
Sensors performance terminology and specifications
Pr. Nazim Mir-Nasiri
11. Output impedance
When
Sensors performance terminology and specifications
Pr. Nazim Mir-Nasiri
11. Output impedance
When
Sensors performance terminology and specifications
Pr. Nazim Mir-Nasiri
Example of the specification
Sensors performance terminology and specifications
Pr. Nazim Mir-Nasiri
Example of the specification
Static and Dynamic Characteristics of Sensors
Pr. Nazim Mir-Nasiri
The static characteristics
Static and Dynamic Characteristics of Sensors
Pr. Nazim Mir-Nasiri
The static characteristics
Static and Dynamic Characteristics of Sensors
Pr. Nazim Mir-Nasiri
Response time is
Static and Dynamic Characteristics of Sensors
Pr. Nazim Mir-Nasiri
Response time is

Static and Dynamic Characteristics of Sensors
Pr. Nazim Mir-Nasiri
Time constant is
Static and Dynamic Characteristics of Sensors
Pr. Nazim Mir-Nasiri
Time constant is
Static and Dynamic Characteristics of Sensors
Pr. Nazim Mir-Nasiri
Settling time is
Static and Dynamic Characteristics of Sensors
Pr. Nazim Mir-Nasiri
Settling time is

Static and Dynamic Characteristics of Sensors
Pr. Nazim Mir-Nasiri
Example. Fig. shows
Static and Dynamic Characteristics of Sensors
Pr. Nazim Mir-Nasiri
Example. Fig. shows
 Презентация по физике "«Источники электрического тока»" - скачать
  Закон сохранения механической энергии. Механические колебания
 Система Интернет-олимпиад СПбГУ Тренировка 10 класс
 Автоматика. Типовые звенья САУ и их свойства
 Создание транспортно-энергетического модуля на основе ядерной энергодвигательной установки мегаваттного класса
 Физические взрывы
 Обобщающий урок по теме «Давление твердых тел, жидкостей и газов.» 7класс учитель Васильева М.В. 2009 год
 Экспериментальные доказательства существования спина и магнитного момента электрона
 Сообщающиеся сосуды
 Основы молекулярной физики Раздел Молекулярно-кинетическая теория идеальных газов
  Презентация по физике "Основные характеристики звёзд" - скачать
  Ионизирующее излучение
 Пара сил. (Лекция 3)
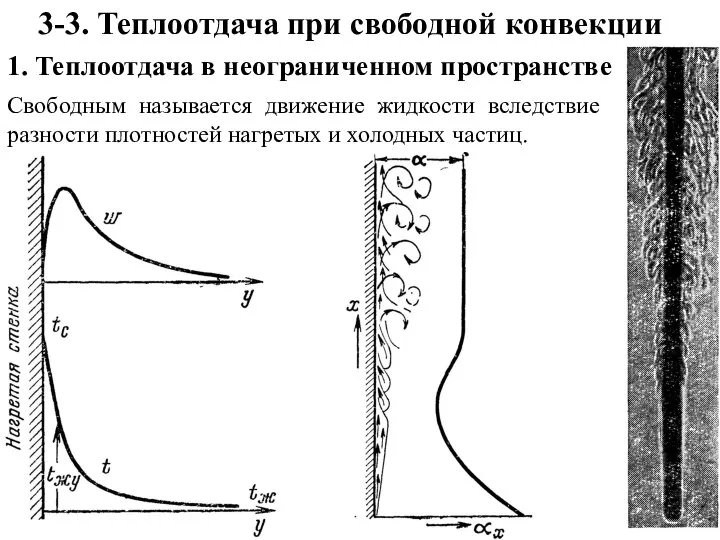 Теплоотдача при свободной конвекции. Теплоотдача в неограниченном пространстве
 Д/з
Д/з Газодинамический расчет пограничного слоя на плоской пластине, обтекаемой потоком вязкого газа
 Работа (7 класс)
 Графическое представление тепловых процессов Т.И. Звягина, 2012 г. ГБОУ СОШ № 644 г. Санкт-Петербург
 Барометр - анероид Вавилова В.Н. МБОУ СОШ №8 г. Ельца
 Сила Ампера. Движение заряженных частиц в магнитном поле. Задачи
 Проект “Дизельный двигатель”
 Расчет сопротивления проводников
 Презентация по физике "Реактивное движение физика" - скачать
  Приборы для измерения давления
 Сложный теплообмен и теплопередача
 Основы молекулярной физики и термодинамики
 Энергия и движение. Источники энергии
 Нанотехнологии. Технологии в современном мире