- Chapter 1 Introduction and Data Collection

Содержание
- 2. Statistics for Managers using Excel, 3e © 2002 Prentice-Hall, Inc. Chapter Topics Why a manager needs
- 3. Statistics for Managers using Excel, 3e © 2002 Prentice-Hall, Inc. Chapter Topics Why data are needed
- 4. Statistics for Managers using Excel, 3e © 2002 Prentice-Hall, Inc. Why a Manager Needs to Know
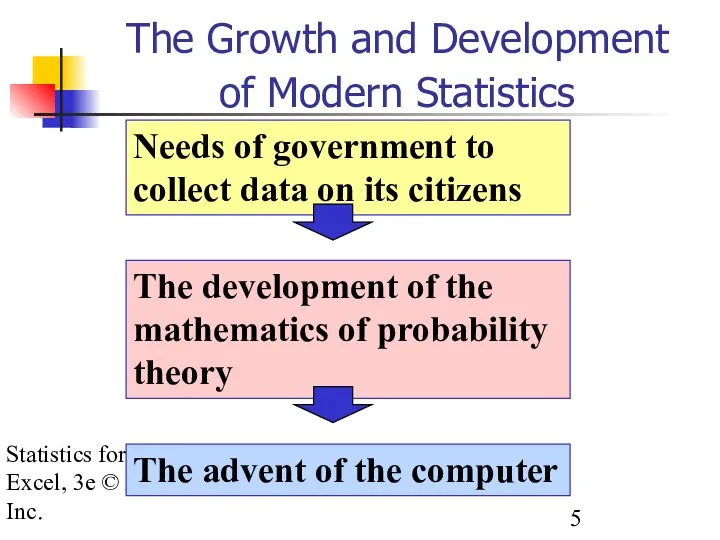
- 5. Statistics for Managers using Excel, 3e © 2002 Prentice-Hall, Inc. The Growth and Development of Modern
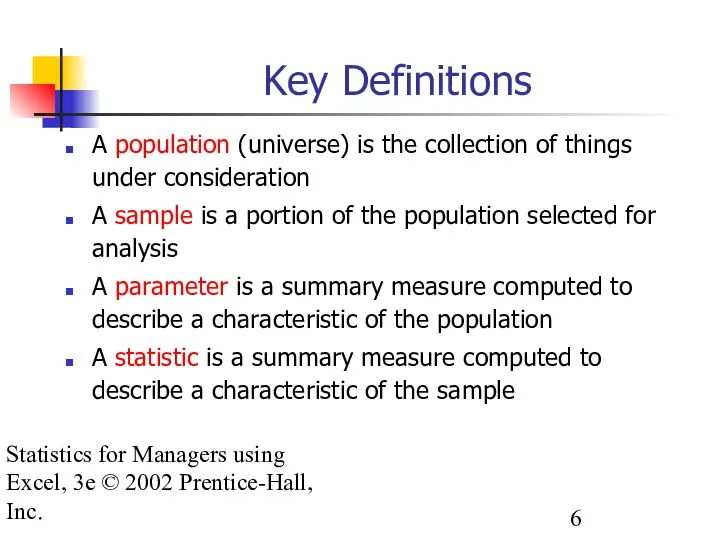
- 6. Statistics for Managers using Excel, 3e © 2002 Prentice-Hall, Inc. Key Definitions A population (universe) is
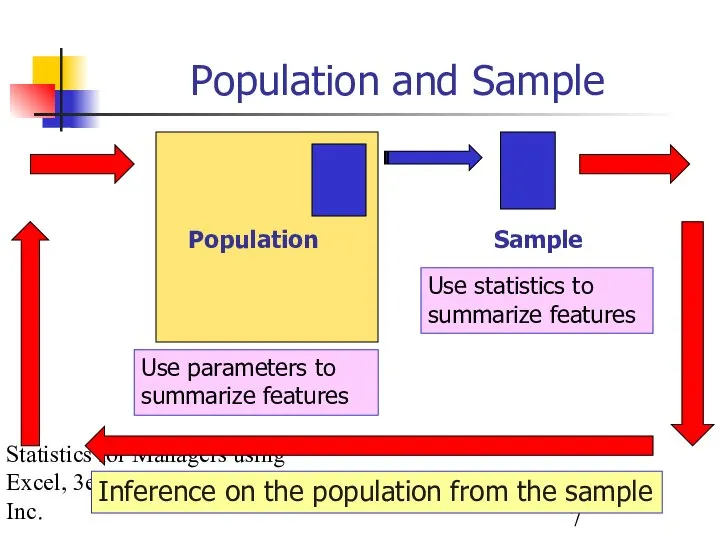
- 7. Statistics for Managers using Excel, 3e © 2002 Prentice-Hall, Inc. Population and Sample Population Sample Use
- 8. Statistics for Managers using Excel, 3e © 2002 Prentice-Hall, Inc. Statistical Methods Descriptive statistics Collecting and
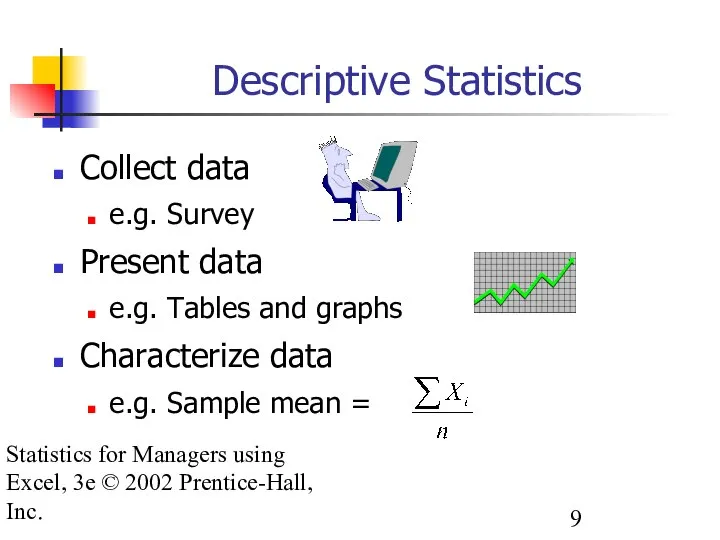
- 9. Statistics for Managers using Excel, 3e © 2002 Prentice-Hall, Inc. Descriptive Statistics Collect data e.g. Survey
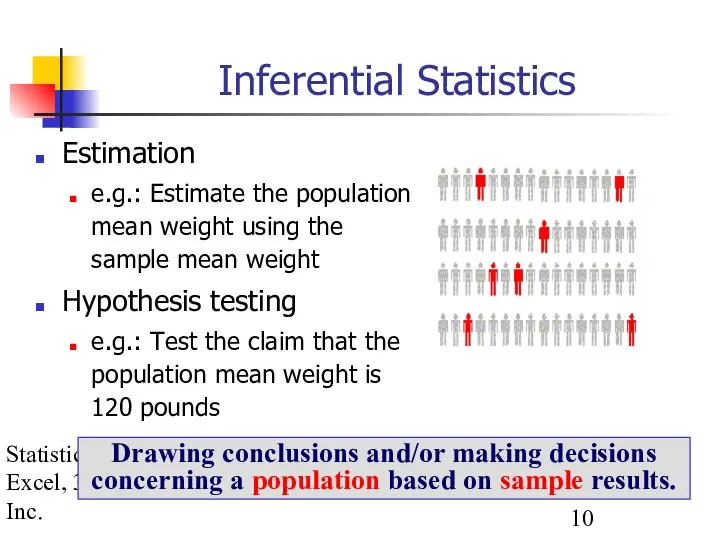
- 10. Statistics for Managers using Excel, 3e © 2002 Prentice-Hall, Inc. Inferential Statistics Estimation e.g.: Estimate the
- 11. Statistics for Managers using Excel, 3e © 2002 Prentice-Hall, Inc. Why We Need Data To provide
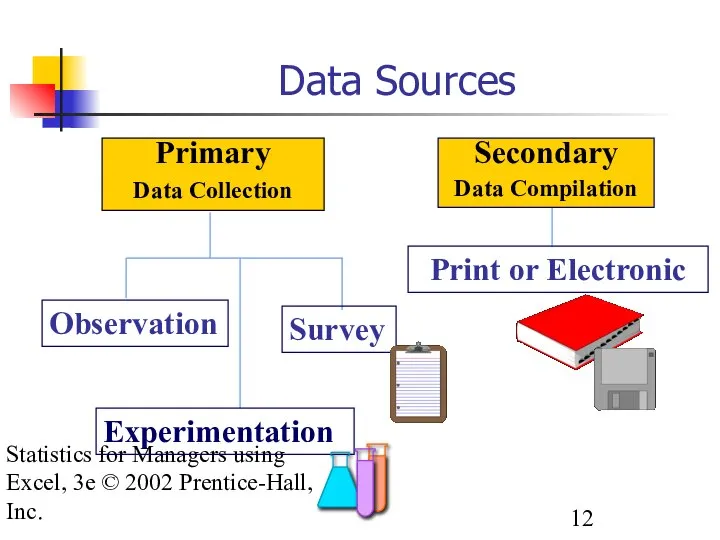
- 12. Statistics for Managers using Excel, 3e © 2002 Prentice-Hall, Inc. Data Sources Primary Data Collection Secondary
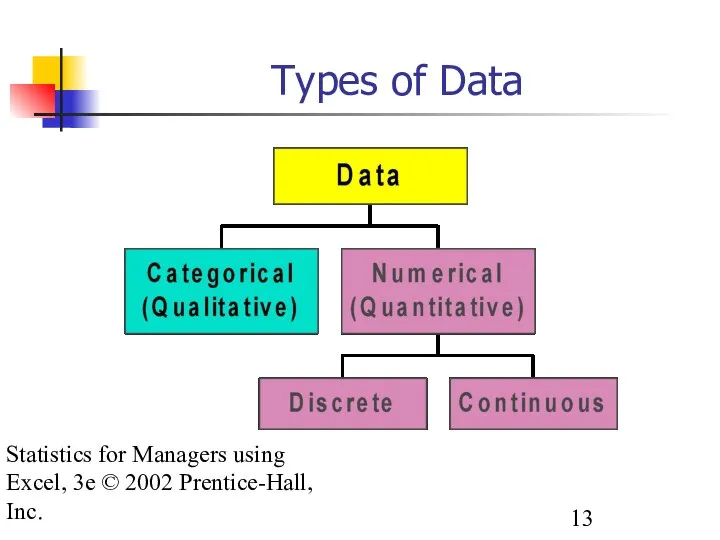
- 13. Statistics for Managers using Excel, 3e © 2002 Prentice-Hall, Inc. Types of Data
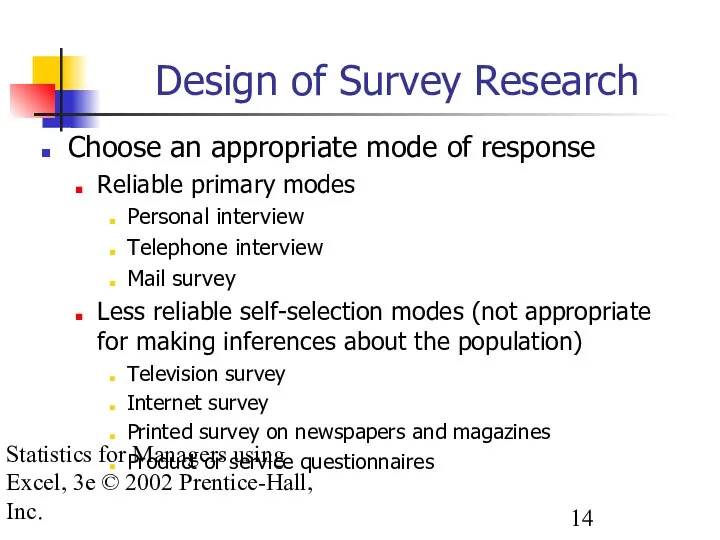
- 14. Statistics for Managers using Excel, 3e © 2002 Prentice-Hall, Inc. Design of Survey Research Choose an
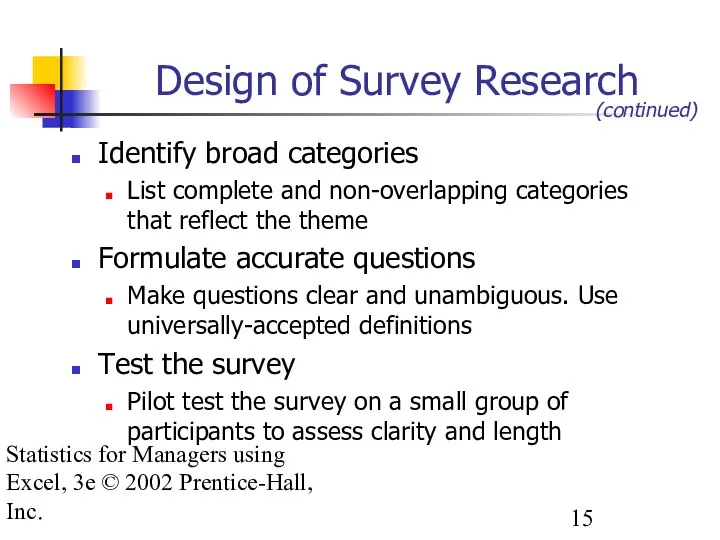
- 15. Statistics for Managers using Excel, 3e © 2002 Prentice-Hall, Inc. Design of Survey Research Identify broad
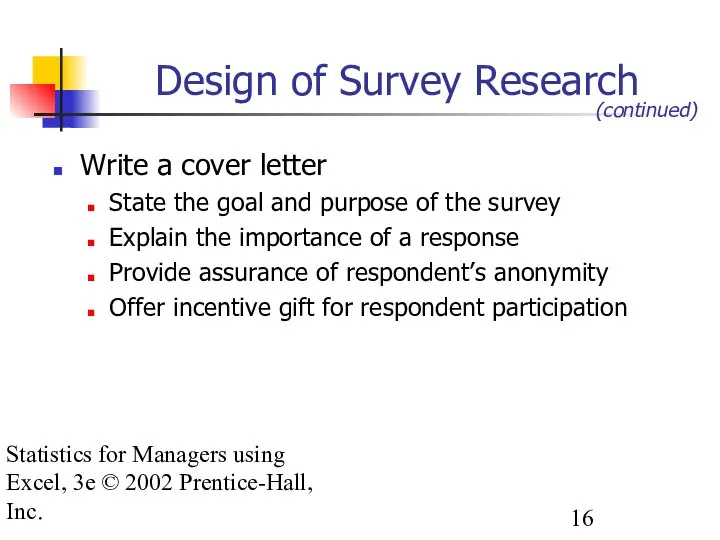
- 16. Statistics for Managers using Excel, 3e © 2002 Prentice-Hall, Inc. Design of Survey Research Write a
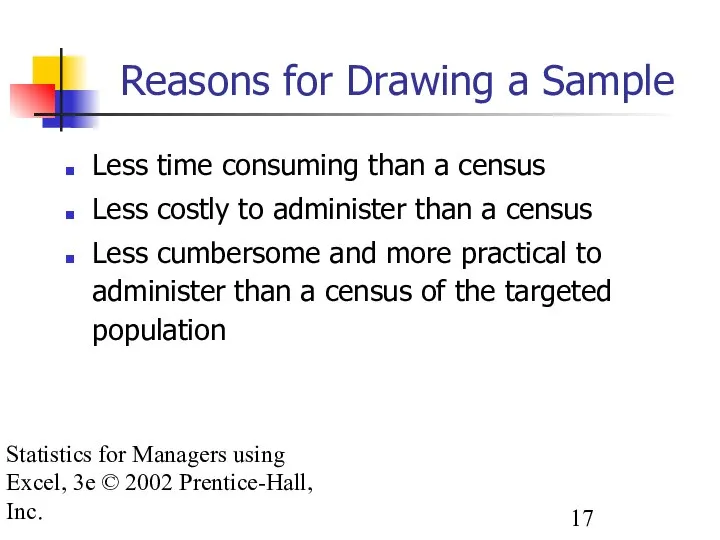
- 17. Statistics for Managers using Excel, 3e © 2002 Prentice-Hall, Inc. Reasons for Drawing a Sample Less
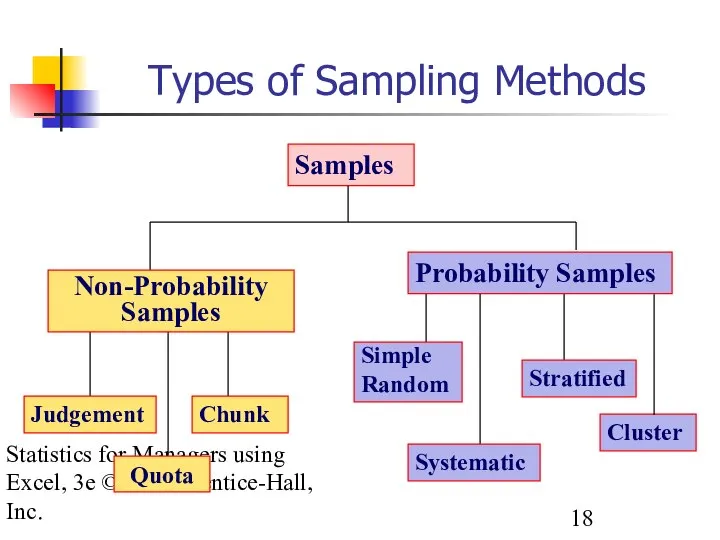
- 18. Statistics for Managers using Excel, 3e © 2002 Prentice-Hall, Inc. Types of Sampling Methods Quota Samples
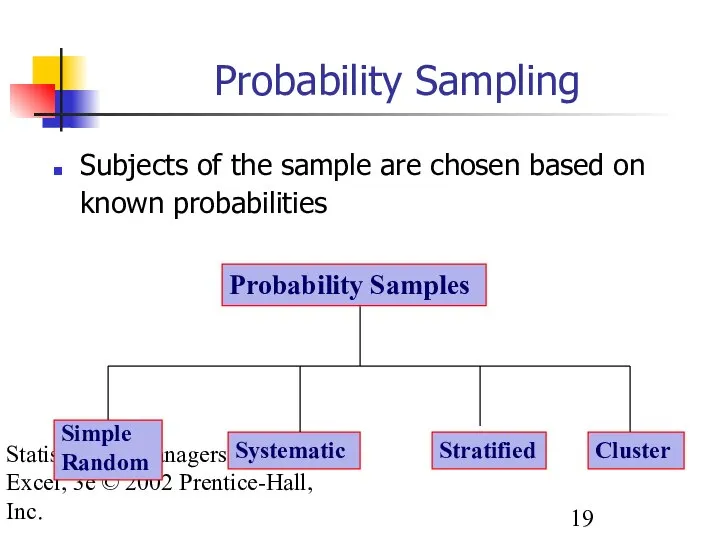
- 19. Statistics for Managers using Excel, 3e © 2002 Prentice-Hall, Inc. Probability Sampling Subjects of the sample
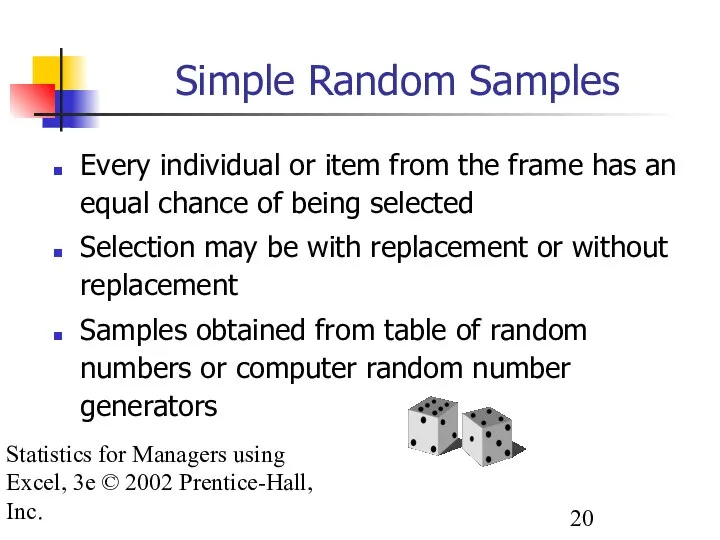
- 20. Statistics for Managers using Excel, 3e © 2002 Prentice-Hall, Inc. Simple Random Samples Every individual or
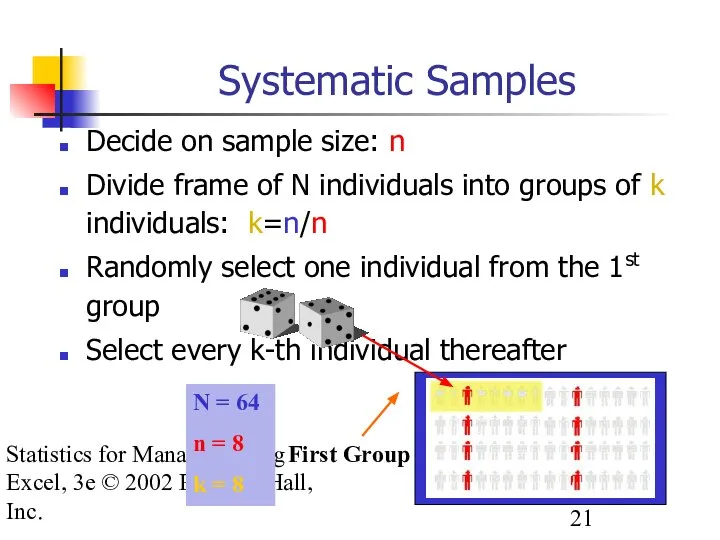
- 21. Statistics for Managers using Excel, 3e © 2002 Prentice-Hall, Inc. Decide on sample size: n Divide
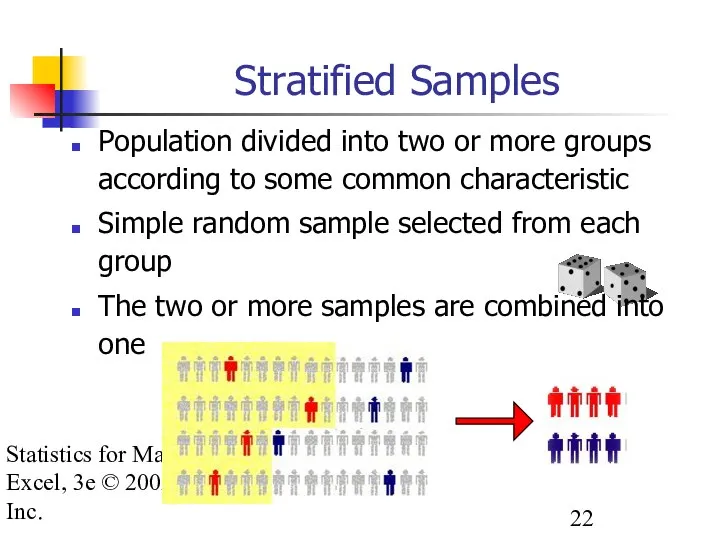
- 22. Statistics for Managers using Excel, 3e © 2002 Prentice-Hall, Inc. Stratified Samples Population divided into two
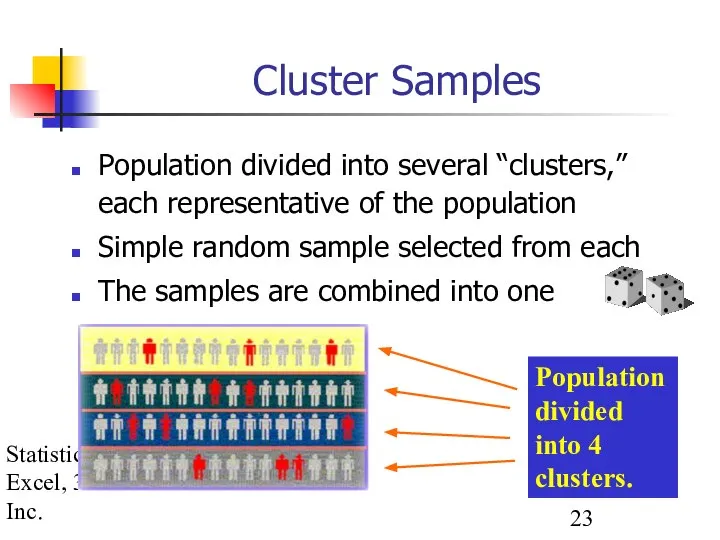
- 23. Statistics for Managers using Excel, 3e © 2002 Prentice-Hall, Inc. Cluster Samples Population divided into several
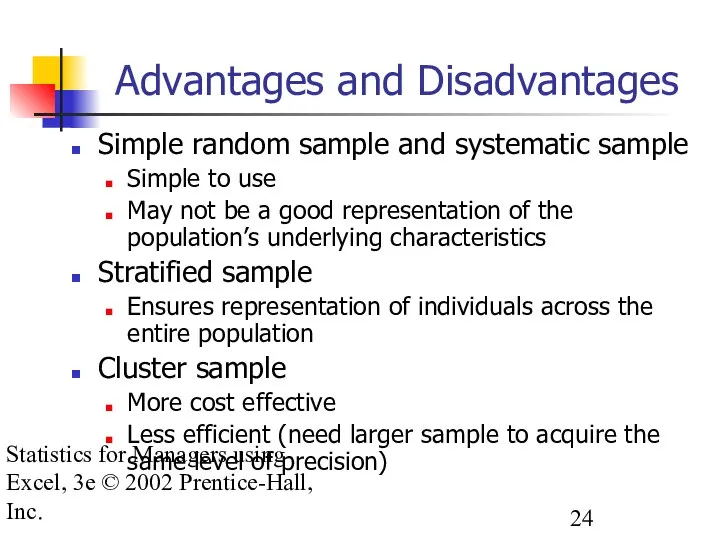
- 24. Statistics for Managers using Excel, 3e © 2002 Prentice-Hall, Inc. Advantages and Disadvantages Simple random sample
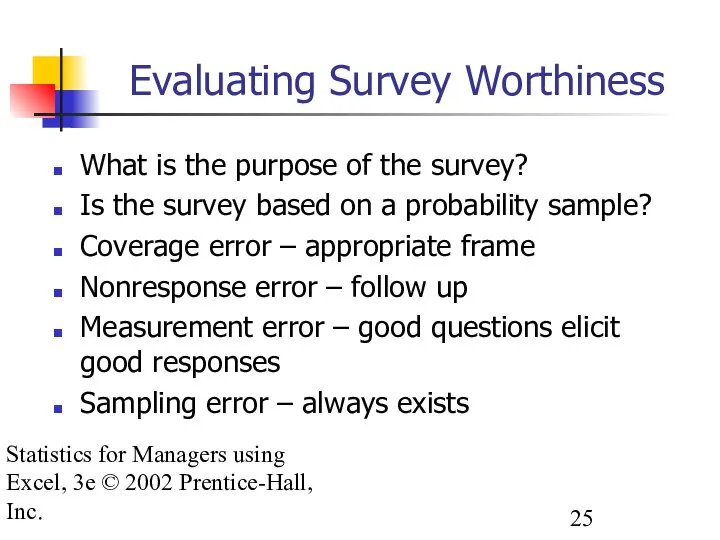
- 25. Statistics for Managers using Excel, 3e © 2002 Prentice-Hall, Inc. Evaluating Survey Worthiness What is the
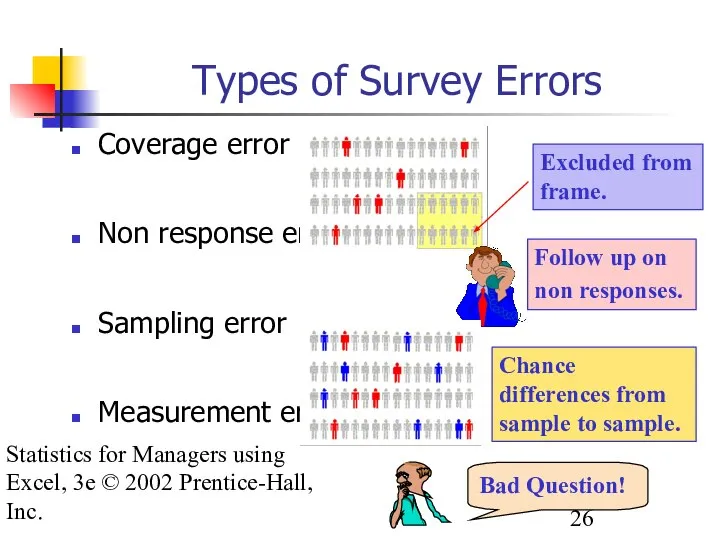
- 26. Statistics for Managers using Excel, 3e © 2002 Prentice-Hall, Inc. Types of Survey Errors Coverage error
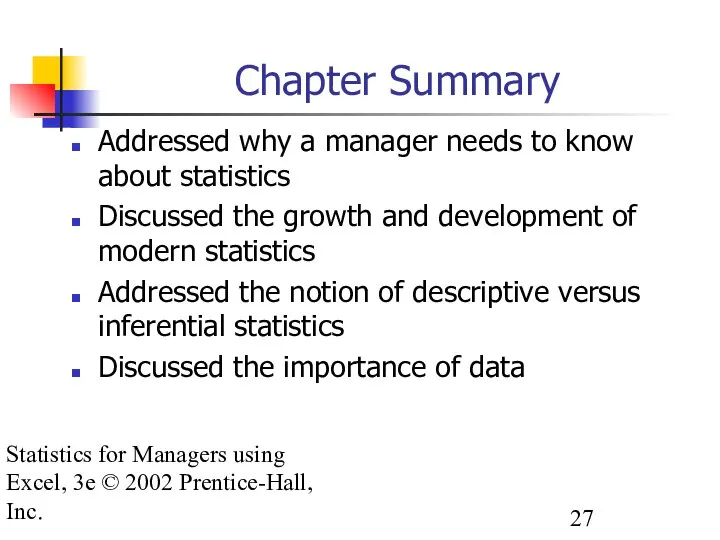
- 27. Statistics for Managers using Excel, 3e © 2002 Prentice-Hall, Inc. Chapter Summary Addressed why a manager
- 29. Скачать презентацию
Statistics for Managers using Excel, 3e © 2002 Prentice-Hall, Inc.
Chapter Topics
Why
Statistics for Managers using Excel, 3e © 2002 Prentice-Hall, Inc.
Chapter Topics
Why
Statistics for Managers using Excel, 3e © 2002 Prentice-Hall, Inc.
Chapter Topics
Why
Statistics for Managers using Excel, 3e © 2002 Prentice-Hall, Inc.
Chapter Topics
Why
Statistics for Managers using Excel, 3e © 2002 Prentice-Hall, Inc.
Why a
Statistics for Managers using Excel, 3e © 2002 Prentice-Hall, Inc.
Why a
Statistics for Managers using Excel, 3e © 2002 Prentice-Hall, Inc.
The Growth
Statistics for Managers using Excel, 3e © 2002 Prentice-Hall, Inc.
The Growth
Statistics for Managers using Excel, 3e © 2002 Prentice-Hall, Inc.
Key Definitions
A
Statistics for Managers using Excel, 3e © 2002 Prentice-Hall, Inc.
Key Definitions
A
Statistics for Managers using Excel, 3e © 2002 Prentice-Hall, Inc.
Population and
Statistics for Managers using Excel, 3e © 2002 Prentice-Hall, Inc.
Population and
Statistics for Managers using Excel, 3e © 2002 Prentice-Hall, Inc.
Statistical Methods
Descriptive
Statistics for Managers using Excel, 3e © 2002 Prentice-Hall, Inc.
Statistical Methods
Descriptive
Statistics for Managers using Excel, 3e © 2002 Prentice-Hall, Inc.
Descriptive Statistics
Collect
Statistics for Managers using Excel, 3e © 2002 Prentice-Hall, Inc.
Descriptive Statistics
Collect
Statistics for Managers using Excel, 3e © 2002 Prentice-Hall, Inc.
Inferential Statistics
Estimation
e.g.:
Statistics for Managers using Excel, 3e © 2002 Prentice-Hall, Inc.
Inferential Statistics
Estimation
e.g.:
Statistics for Managers using Excel, 3e © 2002 Prentice-Hall, Inc.
Why We
Statistics for Managers using Excel, 3e © 2002 Prentice-Hall, Inc.
Why We
Statistics for Managers using Excel, 3e © 2002 Prentice-Hall, Inc.
Data Sources
Primary
Data
Statistics for Managers using Excel, 3e © 2002 Prentice-Hall, Inc.
Data Sources
Primary
Data
Statistics for Managers using Excel, 3e © 2002 Prentice-Hall, Inc.
Types of
Statistics for Managers using Excel, 3e © 2002 Prentice-Hall, Inc.
Types of
Statistics for Managers using Excel, 3e © 2002 Prentice-Hall, Inc.
Design of
Statistics for Managers using Excel, 3e © 2002 Prentice-Hall, Inc.
Design of
Statistics for Managers using Excel, 3e © 2002 Prentice-Hall, Inc.
Design of
Statistics for Managers using Excel, 3e © 2002 Prentice-Hall, Inc.
Design of
Statistics for Managers using Excel, 3e © 2002 Prentice-Hall, Inc.
Design of
Statistics for Managers using Excel, 3e © 2002 Prentice-Hall, Inc.
Design of
Statistics for Managers using Excel, 3e © 2002 Prentice-Hall, Inc.
Reasons for
Statistics for Managers using Excel, 3e © 2002 Prentice-Hall, Inc.
Reasons for
Statistics for Managers using Excel, 3e © 2002 Prentice-Hall, Inc.
Types of
Statistics for Managers using Excel, 3e © 2002 Prentice-Hall, Inc.
Types of
Statistics for Managers using Excel, 3e © 2002 Prentice-Hall, Inc.
Probability Sampling
Subjects
Statistics for Managers using Excel, 3e © 2002 Prentice-Hall, Inc.
Probability Sampling
Subjects
Statistics for Managers using Excel, 3e © 2002 Prentice-Hall, Inc.
Simple Random
Statistics for Managers using Excel, 3e © 2002 Prentice-Hall, Inc.
Simple Random
Statistics for Managers using Excel, 3e © 2002 Prentice-Hall, Inc.
Decide on
Statistics for Managers using Excel, 3e © 2002 Prentice-Hall, Inc.
Decide on
Statistics for Managers using Excel, 3e © 2002 Prentice-Hall, Inc.
Stratified Samples
Population
Statistics for Managers using Excel, 3e © 2002 Prentice-Hall, Inc.
Stratified Samples
Population
Statistics for Managers using Excel, 3e © 2002 Prentice-Hall, Inc.
Cluster Samples
Population
Statistics for Managers using Excel, 3e © 2002 Prentice-Hall, Inc.
Cluster Samples
Population
Statistics for Managers using Excel, 3e © 2002 Prentice-Hall, Inc.
Advantages and
Statistics for Managers using Excel, 3e © 2002 Prentice-Hall, Inc.
Advantages and
Statistics for Managers using Excel, 3e © 2002 Prentice-Hall, Inc.
Evaluating Survey
Statistics for Managers using Excel, 3e © 2002 Prentice-Hall, Inc.
Evaluating Survey
Statistics for Managers using Excel, 3e © 2002 Prentice-Hall, Inc.
Types of
Statistics for Managers using Excel, 3e © 2002 Prentice-Hall, Inc.
Types of
Statistics for Managers using Excel, 3e © 2002 Prentice-Hall, Inc.
Chapter Summary
Addressed
Statistics for Managers using Excel, 3e © 2002 Prentice-Hall, Inc.
Chapter Summary
Addressed
 Модуль экспертной системы построения функции принадлежности нечетких множеств
 Социальные сети
 Барни Калхун из игры Halflife 2
 Фреймы
 1С:Музей и 1С:Музейный каталог
 Логика. Основные понятия
 Электронная почта и другие серверы компьютерных сетей
 Инфографика
 Презентация "10 вариантов одной логической задачи" - скачать презентации по Информатике
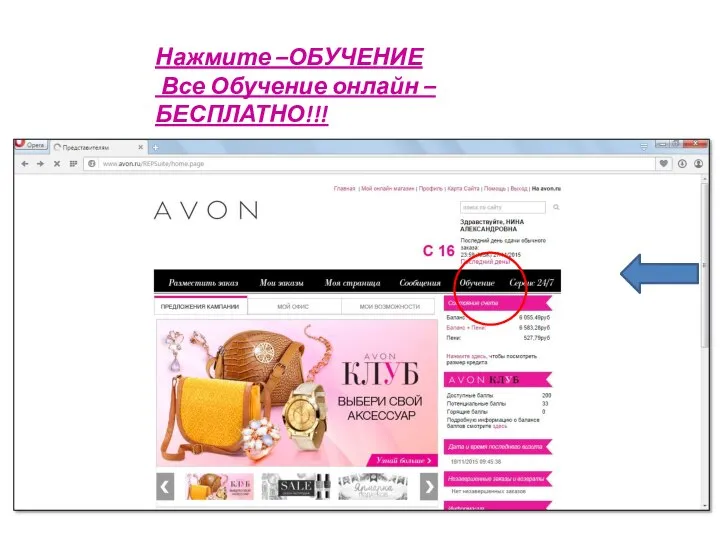 Как пройти онлайн-обучение в Avon
 Виды и форматы оптических дисков
 Формы записи алгоритмов
 Проектирование связей между таблицами баз данных
 Виртуальная мобильная АТС
 Использование программ в среде ГРИС "Стрелочка"
 Операционные системы
 ВМСиС Слайды лек 07
 Инструкция по работе с онлайн-трансляциями лекций по дисциплине Налоговое право
 Виды компьютерной графики
 Решение задач по теме: перевод чисел из одной системы счисления в другую
 Делаем слайды для презентации. Типичные ошибки на плохих слайдах
 Повышение безопасности и улучшение условий труда путем внедрения системы с числовым программным управлением
 Требования к разработке ПО
 Компьютерная графика
 Unix/Linux
 Модели данных. Реляционная модель
 Хмарні технології (віддалена обробка та зберігання даних)
 Java course