- Drawing inspection data graphs with amChart

Содержание
- 2. Drawing inspection data graphs with amChart_OrderSheet 5. Deadlines and Procedures - Deadline - Tuesday, February 15
- 3. Development requirements amChart This is a requirement. Nuxt.js Please use the attached empty project to develop
- 4. Reference image of graph ※このグラフで利用しているデータはダウンロードして利用いただけます。 (CSV(BOMあり)/CSV(BOMなし)/JSON)
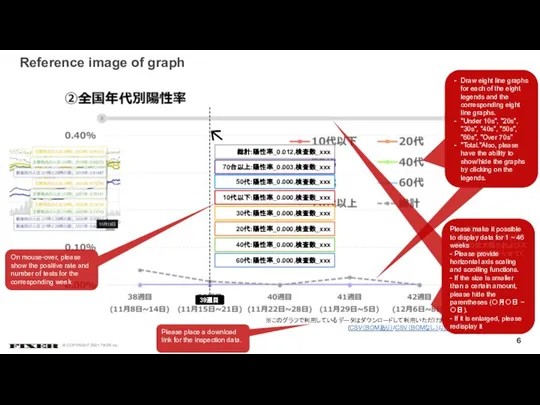
- 5. Reference image of graph Please place a download link for the inspection data. 神奈川県:陽性率_0.088,検査数_xxx On mouse-over,
- 6. Reference image of graph ※このグラフで利用しているデータはダウンロードして利用いただけます。 (CSV(BOMあり)/CSV(BOMなし)/JSON)
- 7. Reference image of graph Draw eight line graphs for each of the eight legends and the
- 10. Скачать презентацию
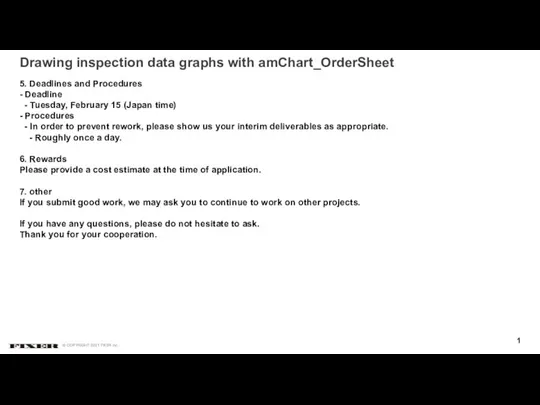
Drawing inspection data graphs with amChart_OrderSheet
5. Deadlines and Procedures
- Deadline
-
Drawing inspection data graphs with amChart_OrderSheet
5. Deadlines and Procedures
- Deadline
-
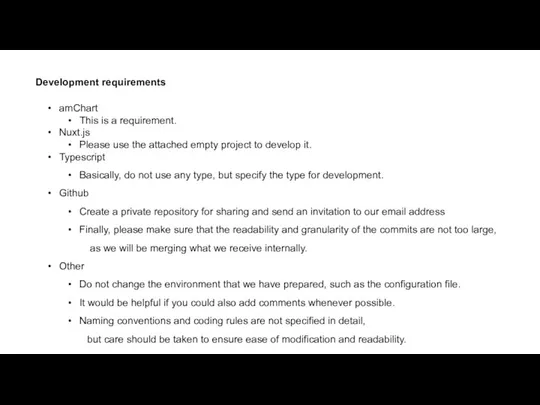
Development requirements
amChart
This is a requirement.
Nuxt.js
Please use the attached empty project to
Development requirements
amChart
This is a requirement.
Nuxt.js
Please use the attached empty project to

Reference image of graph
※このグラフで利用しているデータはダウンロードして利用いただけます。
(CSV(BOMあり)/CSV(BOMなし)/JSON)
Reference image of graph
※このグラフで利用しているデータはダウンロードして利用いただけます。
(CSV(BOMあり)/CSV(BOMなし)/JSON)
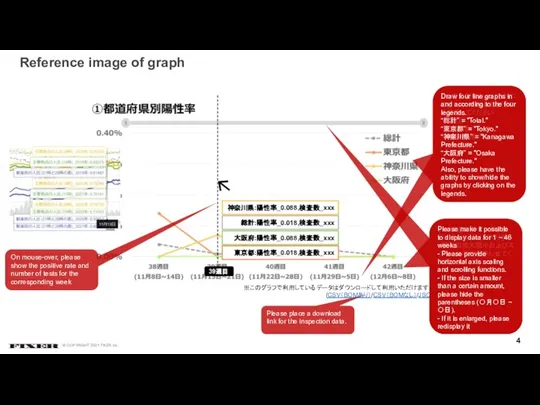
Reference image of graph
Please place a download link for the inspection
Reference image of graph
Please place a download link for the inspection
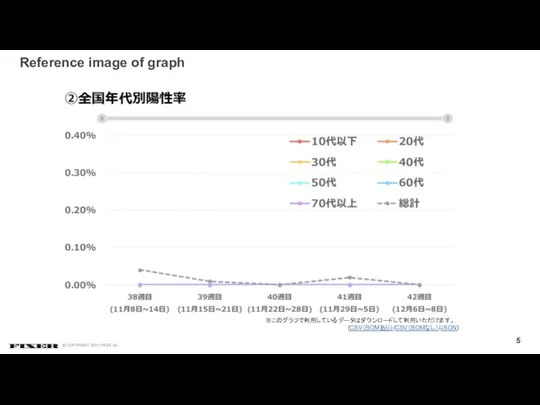
Reference image of graph
※このグラフで利用しているデータはダウンロードして利用いただけます。
(CSV(BOMあり)/CSV(BOMなし)/JSON)
Reference image of graph
※このグラフで利用しているデータはダウンロードして利用いただけます。
(CSV(BOMあり)/CSV(BOMなし)/JSON)
Reference image of graph
Draw eight line graphs for each of the
Reference image of graph
Draw eight line graphs for each of the

 Translation Practice
 ОДНОМЕРНЫЕ МАССИВЫ
 Электронная память
  Методологии, основанные на технологиях CALS, PLM, ИПИ
 Контроль знаний
 Видеосистема теоретические основы
  Наше время. Молодежный вестник № 70
 Оптимизатор времени
 Автоматизация деятельности архивной службы предприятия. Система “АРХИВНОЕ ДЕЛО” 3.0
 Работа в MS PowerPoint
 Разработка web-приложений p2p. Обмен данными в распределенных сетях
 Геометрия задачи на чертежах
  Автоматизация стратегических задач планирования и управления
 Предтечи теории информационного общества. Концепция постиндустриального общества Д. Белла
 Создание баз данных в программе MS Access
 Защита файлов и управление доступом к ним. Борисов В.А. Красноармейский филиал ГОУ ВПО «Академия народного хозяйства при Прави
 Проектировка и разработка игры в жанре RPG
 Работа с презентациями
 Растровая и векторная анимация
 Introduction to Java Applications. Chapter 2
 Объекты и классы
 Компьютерные коммуникации и интернет
  Развитие вычислительной техники
 Construct 3. Урок 2
 Функции. Повторение пройденного материала
 Презентация "Обработка массивов" - скачать презентации по Информатике
 Аттестационная работа. Курс внеурочной деятельности Программирование в среде Scratch
 «multi» -много, «media» - среда