- Statistics for Managers using Microsoft Excel 3rd Edition

Содержание
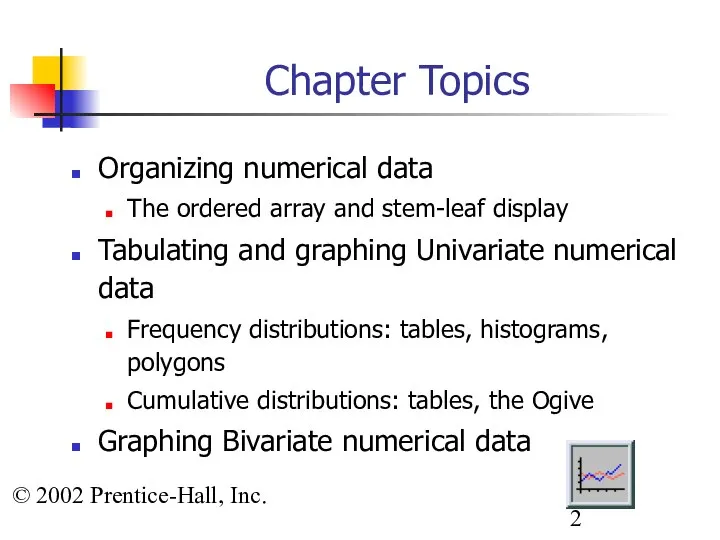
- 2. © 2002 Prentice-Hall, Inc. Chapter Topics Organizing numerical data The ordered array and stem-leaf display Tabulating
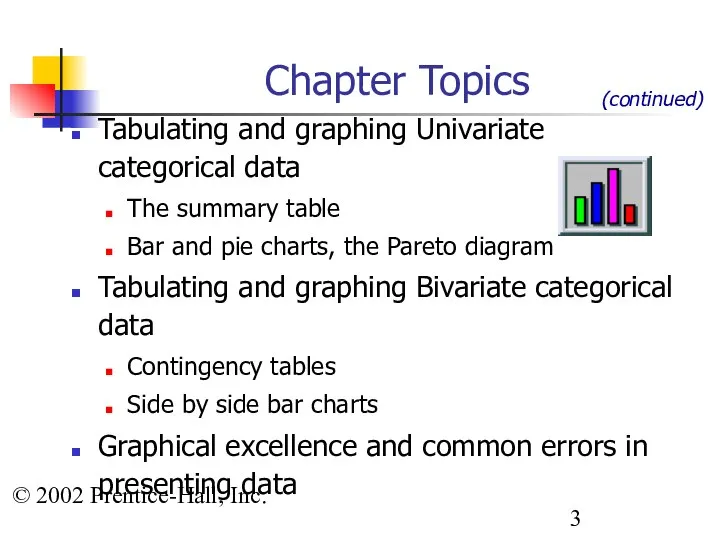
- 3. © 2002 Prentice-Hall, Inc. Chapter Topics Tabulating and graphing Univariate categorical data The summary table Bar
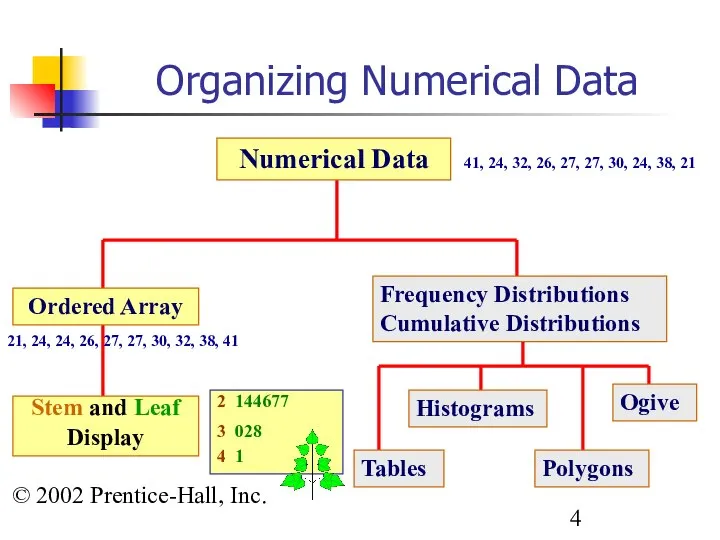
- 4. © 2002 Prentice-Hall, Inc. Organizing Numerical Data Numerical Data Ordered Array Stem and Leaf Display Frequency
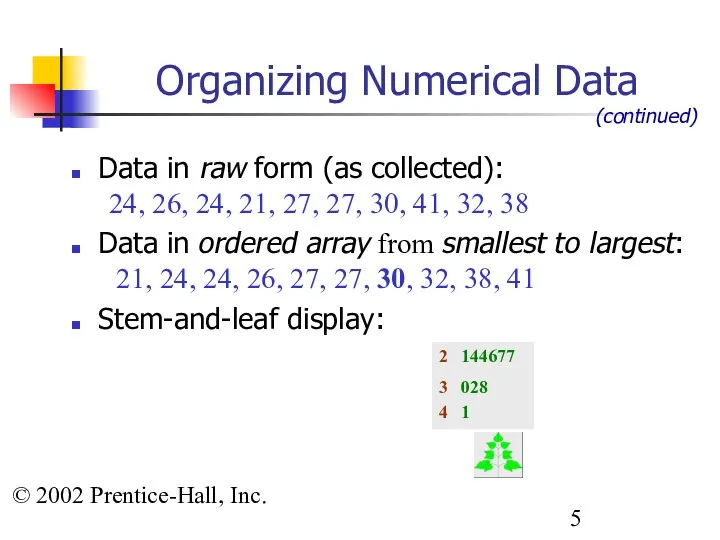
- 5. © 2002 Prentice-Hall, Inc. Data in raw form (as collected): 24, 26, 24, 21, 27, 27,
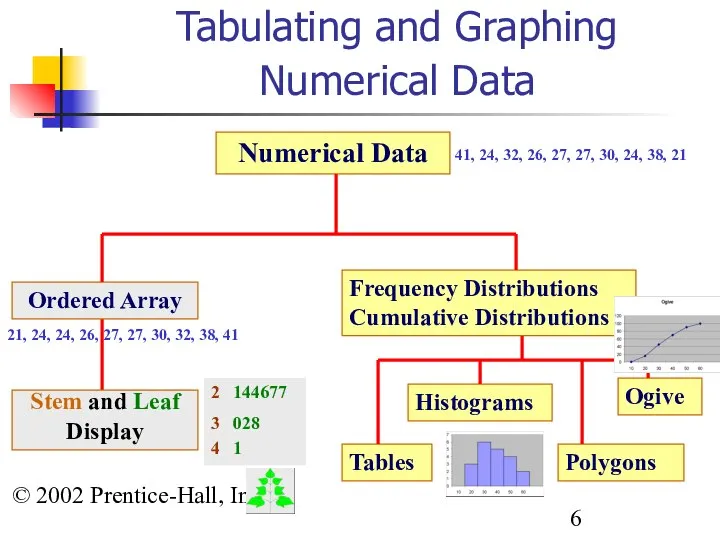
- 6. © 2002 Prentice-Hall, Inc. Tabulating and Graphing Numerical Data Numerical Data Ordered Array Stem and Leaf
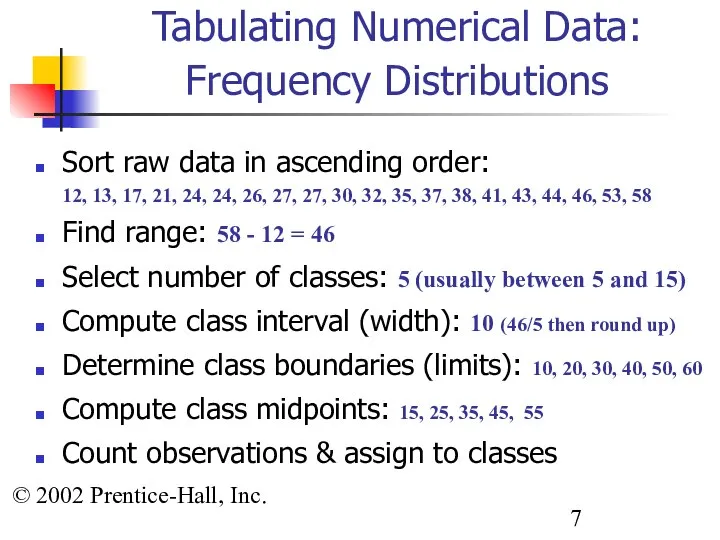
- 7. © 2002 Prentice-Hall, Inc. Tabulating Numerical Data: Frequency Distributions Sort raw data in ascending order: 12,
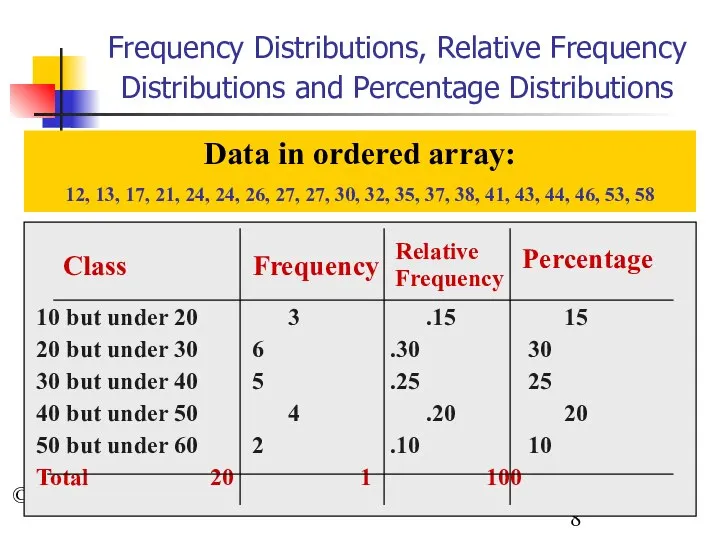
- 8. © 2002 Prentice-Hall, Inc. Frequency Distributions, Relative Frequency Distributions and Percentage Distributions Class Frequency 10 but
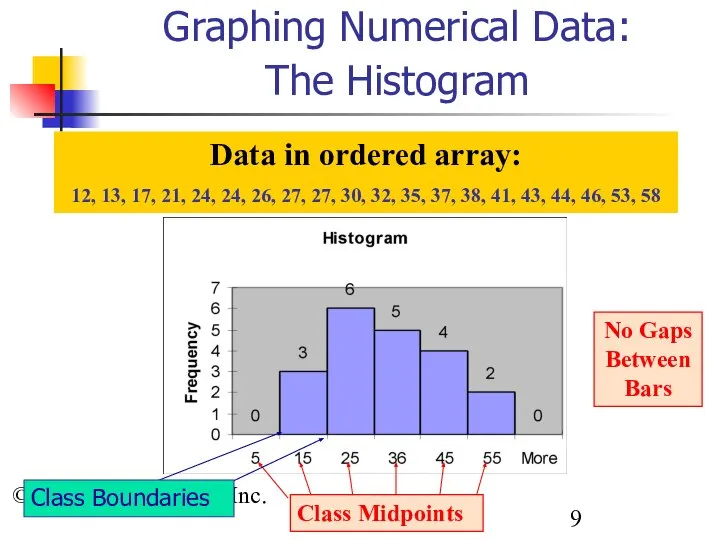
- 9. © 2002 Prentice-Hall, Inc. Graphing Numerical Data: The Histogram Data in ordered array: 12, 13, 17,
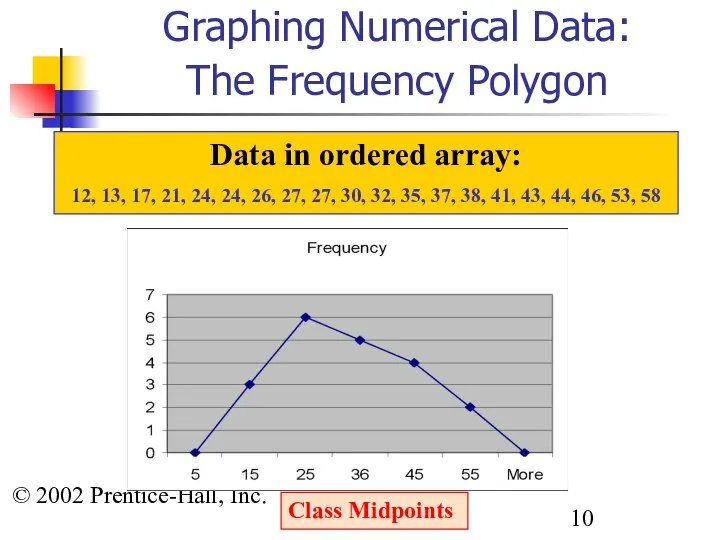
- 10. © 2002 Prentice-Hall, Inc. Graphing Numerical Data: The Frequency Polygon Class Midpoints Data in ordered array:
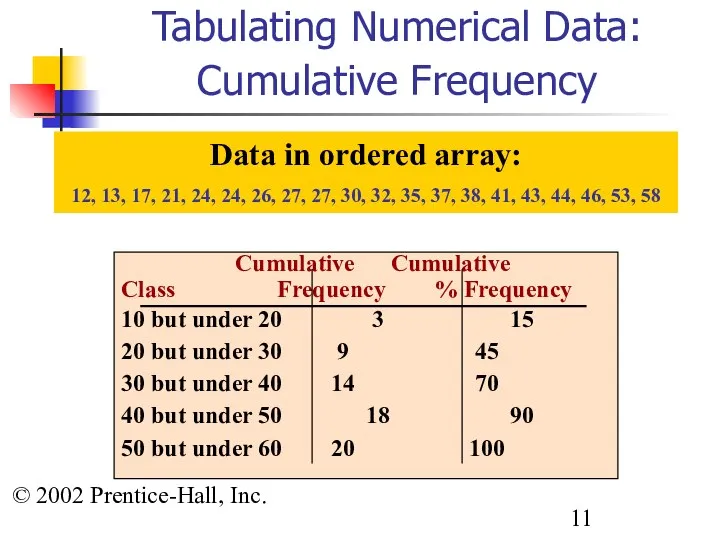
- 11. © 2002 Prentice-Hall, Inc. Tabulating Numerical Data: Cumulative Frequency Cumulative Cumulative Class Frequency % Frequency 10
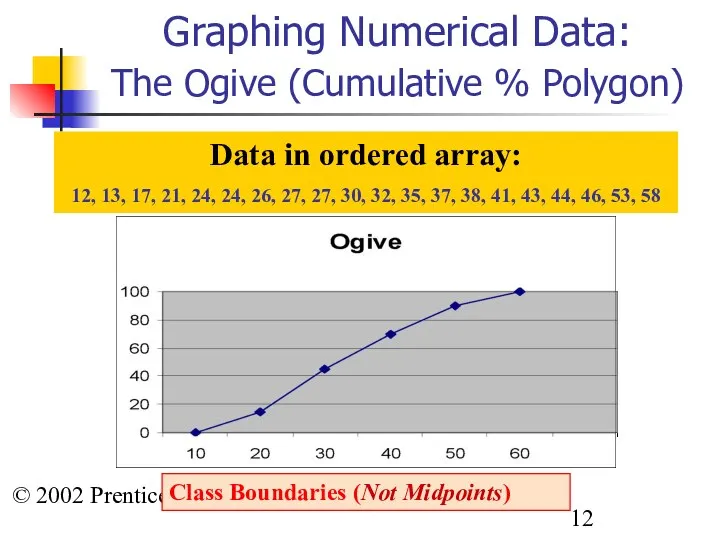
- 12. © 2002 Prentice-Hall, Inc. Graphing Numerical Data: The Ogive (Cumulative % Polygon) Class Boundaries (Not Midpoints)
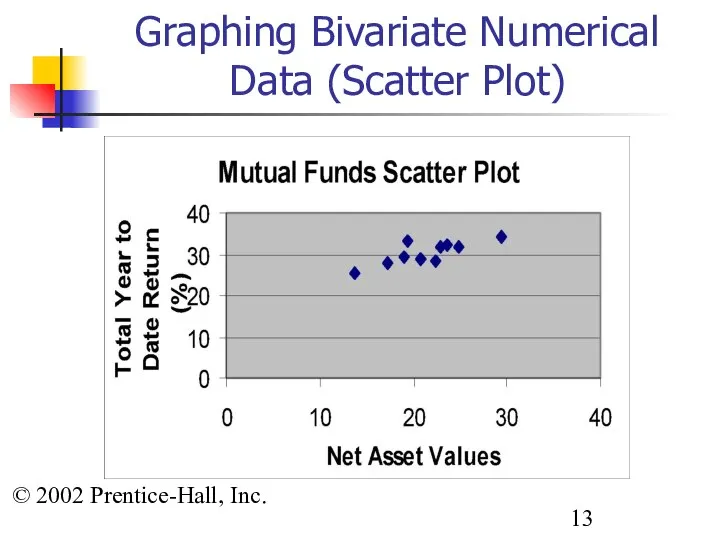
- 13. © 2002 Prentice-Hall, Inc. Graphing Bivariate Numerical Data (Scatter Plot)
- 14. © 2002 Prentice-Hall, Inc. Tabulating and Graphing Categorical Data:Univariate Data Categorical Data Tabulating Data The Summary
- 15. © 2002 Prentice-Hall, Inc. Summary Table (for an Investor’s Portfolio) Investment Category Amount Percentage (in thousands
- 16. © 2002 Prentice-Hall, Inc. Graphing Categorical Data: Univariate Data Categorical Data Tabulating Data The Summary Table
- 17. © 2002 Prentice-Hall, Inc. Bar Chart (for an Investor’s Portfolio)
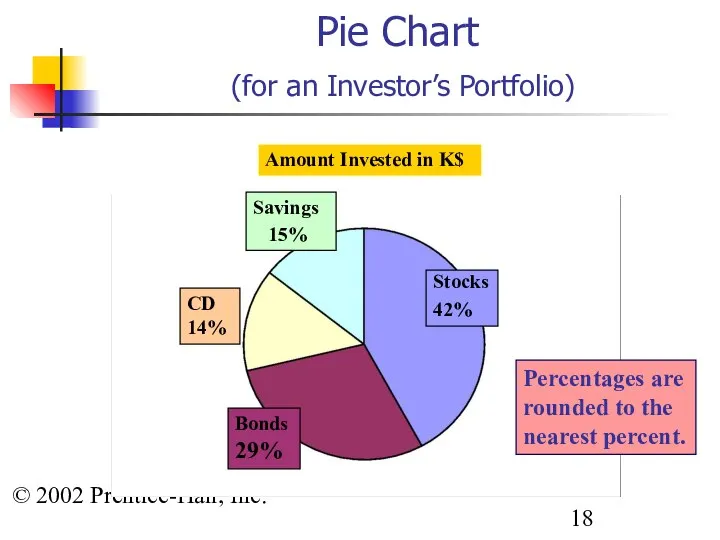
- 18. © 2002 Prentice-Hall, Inc. Pie Chart (for an Investor’s Portfolio) Percentages are rounded to the nearest
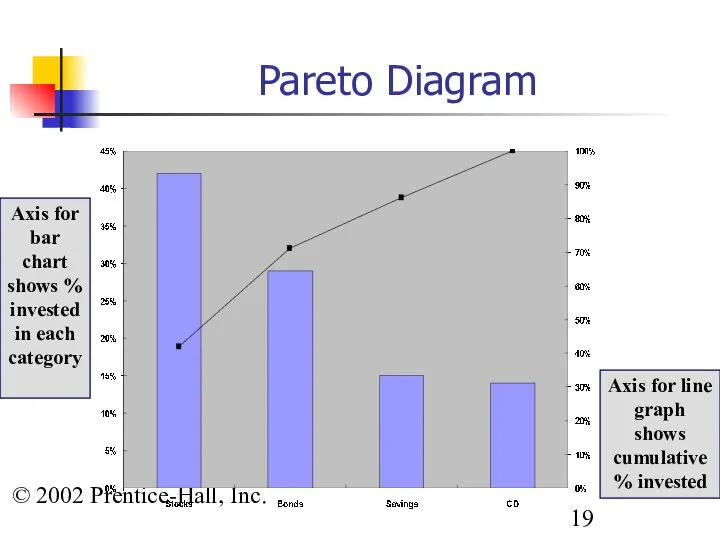
- 19. © 2002 Prentice-Hall, Inc. Pareto Diagram Axis for line graph shows cumulative % invested Axis for
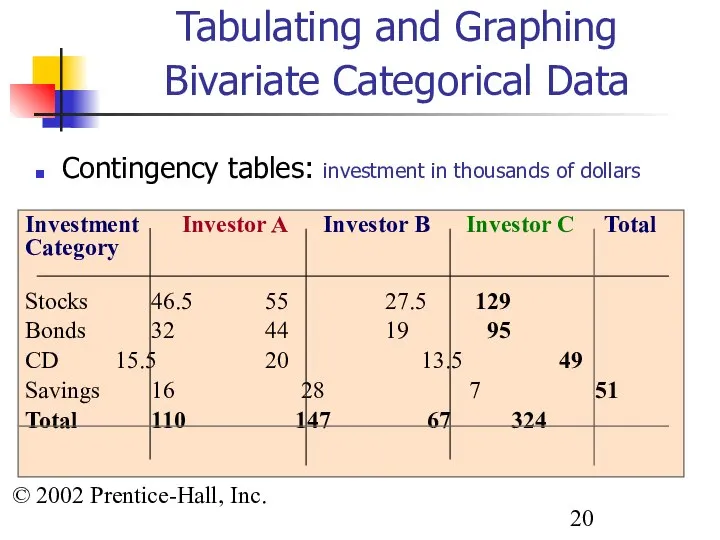
- 20. © 2002 Prentice-Hall, Inc. Tabulating and Graphing Bivariate Categorical Data Contingency tables: investment in thousands of
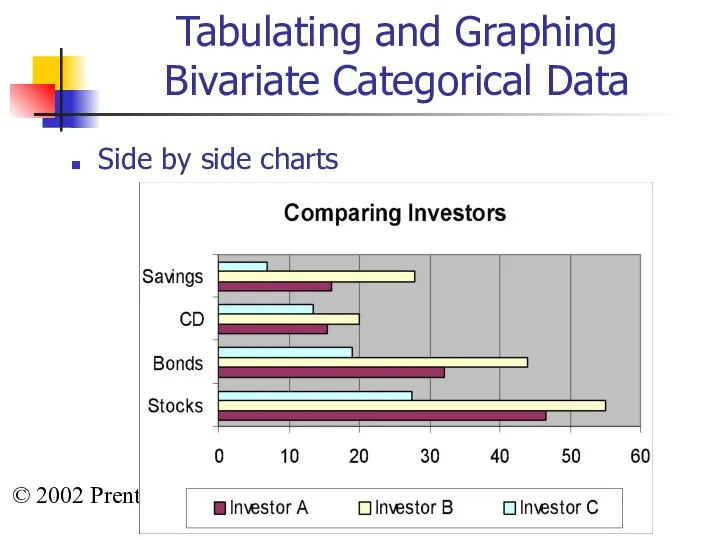
- 21. © 2002 Prentice-Hall, Inc. Tabulating and Graphing Bivariate Categorical Data Side by side charts
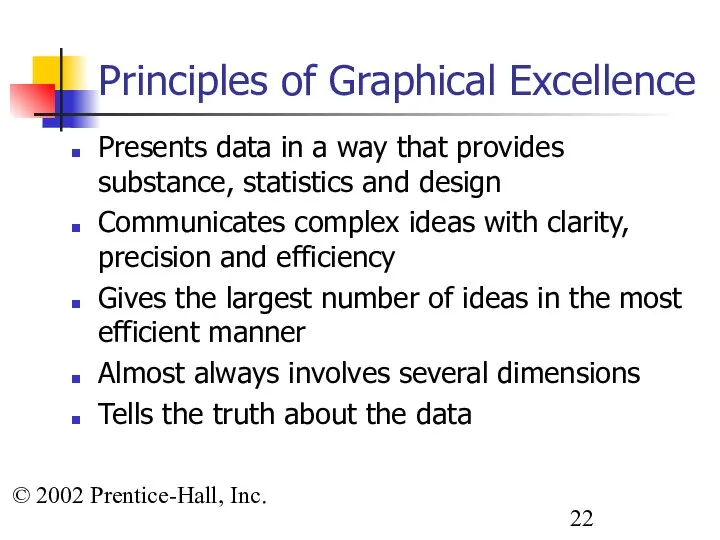
- 22. © 2002 Prentice-Hall, Inc. Principles of Graphical Excellence Presents data in a way that provides substance,
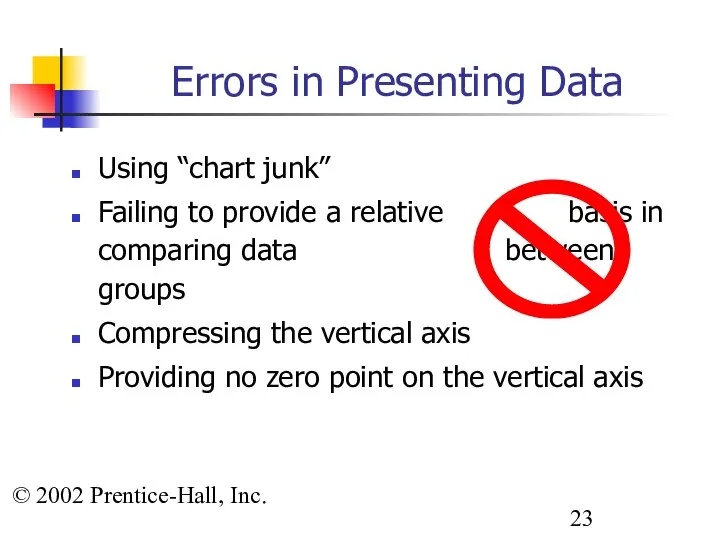
- 23. © 2002 Prentice-Hall, Inc. Using “chart junk” Failing to provide a relative basis in comparing data
- 24. © 2002 Prentice-Hall, Inc. “Chart Junk” Good Presentation 1960: $1.00 1970: $1.60 1980: $3.10 1990: $3.80
- 25. © 2002 Prentice-Hall, Inc. No Relative Basis Good Presentation A’s received by students. A’s received by
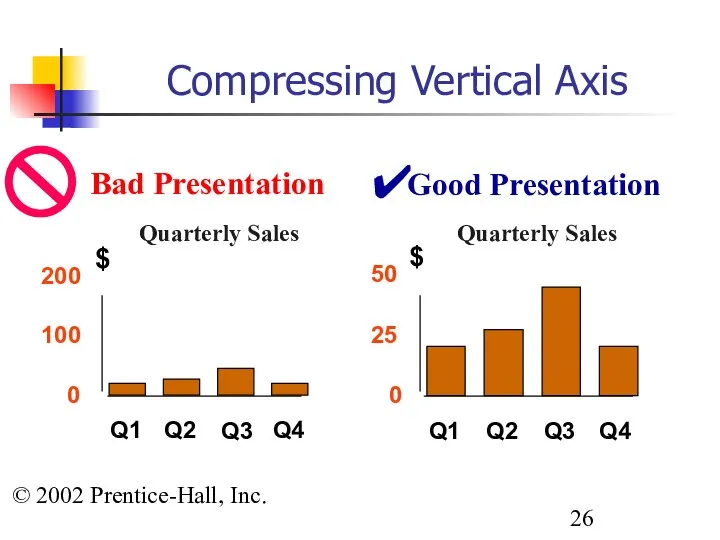
- 26. © 2002 Prentice-Hall, Inc. Compressing Vertical Axis Good Presentation Quarterly Sales Quarterly Sales Bad Presentation 0
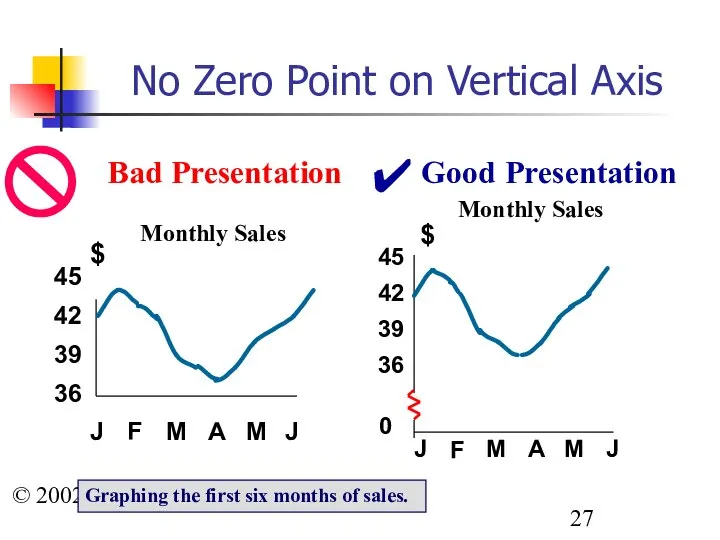
- 27. © 2002 Prentice-Hall, Inc. No Zero Point on Vertical Axis Good Presentation Monthly Sales Monthly Sales
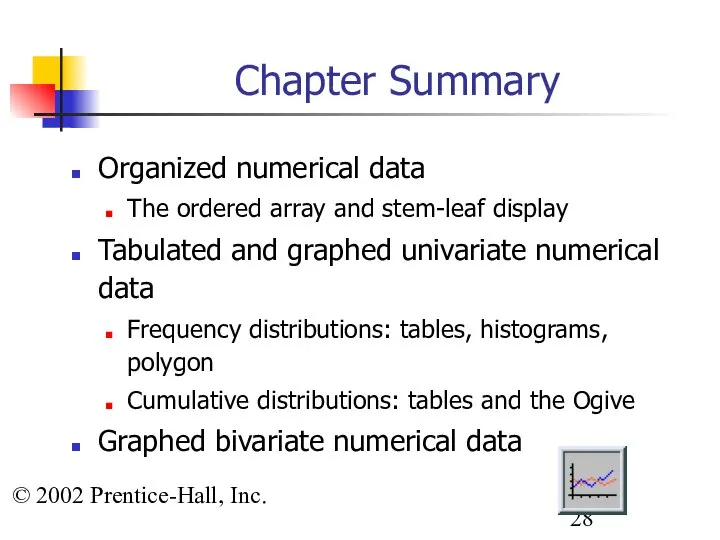
- 28. © 2002 Prentice-Hall, Inc. Chapter Summary Organized numerical data The ordered array and stem-leaf display Tabulated
- 30. Скачать презентацию
© 2002 Prentice-Hall, Inc.
Chapter Topics
Organizing numerical data
The ordered array and
© 2002 Prentice-Hall, Inc.
Chapter Topics
Organizing numerical data
The ordered array and
© 2002 Prentice-Hall, Inc.
Chapter Topics
Tabulating and graphing Univariate categorical data
The
© 2002 Prentice-Hall, Inc.
Chapter Topics
Tabulating and graphing Univariate categorical data
The
© 2002 Prentice-Hall, Inc.
Organizing Numerical Data
Numerical Data
Ordered Array
Stem and Leaf
Display
Frequency
© 2002 Prentice-Hall, Inc.
Organizing Numerical Data
Numerical Data
Ordered Array
Stem and Leaf
Display
Frequency
© 2002 Prentice-Hall, Inc.
Data in raw form (as collected):
24,
© 2002 Prentice-Hall, Inc.
Data in raw form (as collected): 24,
© 2002 Prentice-Hall, Inc.
Tabulating and Graphing Numerical Data
Numerical Data
Ordered Array
Stem
© 2002 Prentice-Hall, Inc.
Tabulating and Graphing Numerical Data
Numerical Data
Ordered Array
Stem
© 2002 Prentice-Hall, Inc.
Tabulating Numerical Data: Frequency Distributions
Sort raw data
© 2002 Prentice-Hall, Inc.
Tabulating Numerical Data: Frequency Distributions
Sort raw data
© 2002 Prentice-Hall, Inc.
Frequency Distributions, Relative Frequency Distributions and Percentage
© 2002 Prentice-Hall, Inc.
Frequency Distributions, Relative Frequency Distributions and Percentage
© 2002 Prentice-Hall, Inc.
Graphing Numerical Data:
The Histogram
Data in ordered
© 2002 Prentice-Hall, Inc.
Graphing Numerical Data:
The Histogram
Data in ordered
© 2002 Prentice-Hall, Inc.
Graphing Numerical Data:
The Frequency Polygon
Class Midpoints
Data
© 2002 Prentice-Hall, Inc.
Graphing Numerical Data:
The Frequency Polygon
Class Midpoints
Data
© 2002 Prentice-Hall, Inc.
Tabulating Numerical Data:
Cumulative Frequency
Cumulative Cumulative
Class
© 2002 Prentice-Hall, Inc.
Tabulating Numerical Data:
Cumulative Frequency
Cumulative Cumulative
Class
© 2002 Prentice-Hall, Inc.
Graphing Numerical Data:
The Ogive (Cumulative %
© 2002 Prentice-Hall, Inc.
Graphing Numerical Data: The Ogive (Cumulative %
© 2002 Prentice-Hall, Inc.
Graphing Bivariate Numerical Data (Scatter Plot)
© 2002 Prentice-Hall, Inc.
Graphing Bivariate Numerical Data (Scatter Plot)
© 2002 Prentice-Hall, Inc.
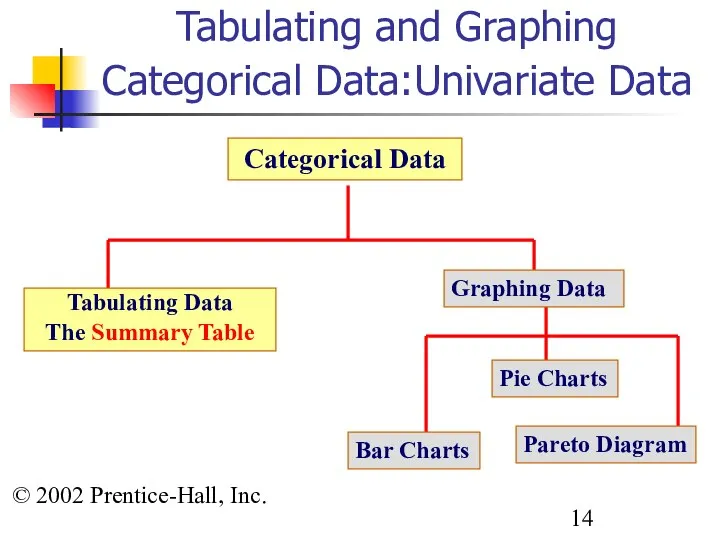
Tabulating and Graphing Categorical Data:Univariate Data
Categorical Data
Tabulating
© 2002 Prentice-Hall, Inc.
Tabulating and Graphing Categorical Data:Univariate Data
Categorical Data
Tabulating
© 2002 Prentice-Hall, Inc.
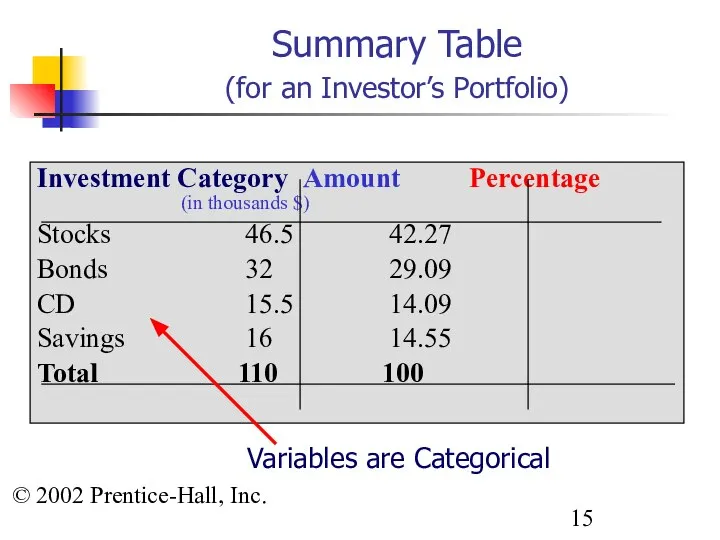
Summary Table
(for an Investor’s Portfolio)
Investment Category Amount Percentage
© 2002 Prentice-Hall, Inc.
Summary Table
(for an Investor’s Portfolio)
Investment Category Amount Percentage
© 2002 Prentice-Hall, Inc.
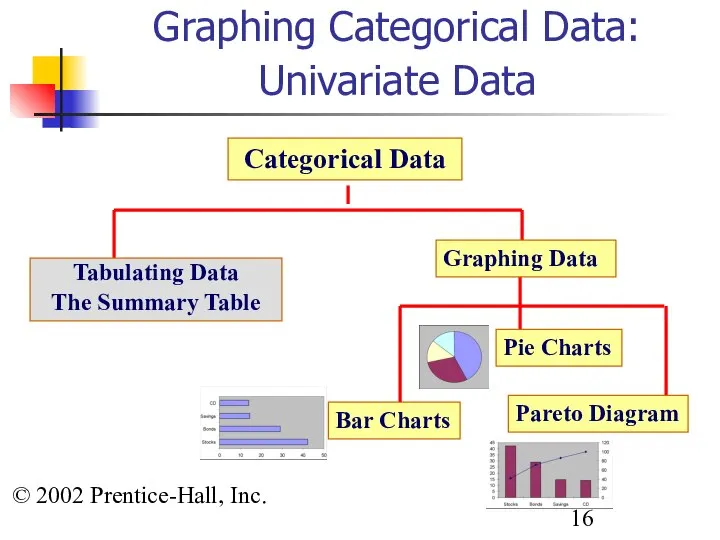
Graphing Categorical Data: Univariate Data
Categorical Data
Tabulating Data
The
© 2002 Prentice-Hall, Inc.
Graphing Categorical Data: Univariate Data
Categorical Data
Tabulating Data
The
© 2002 Prentice-Hall, Inc.
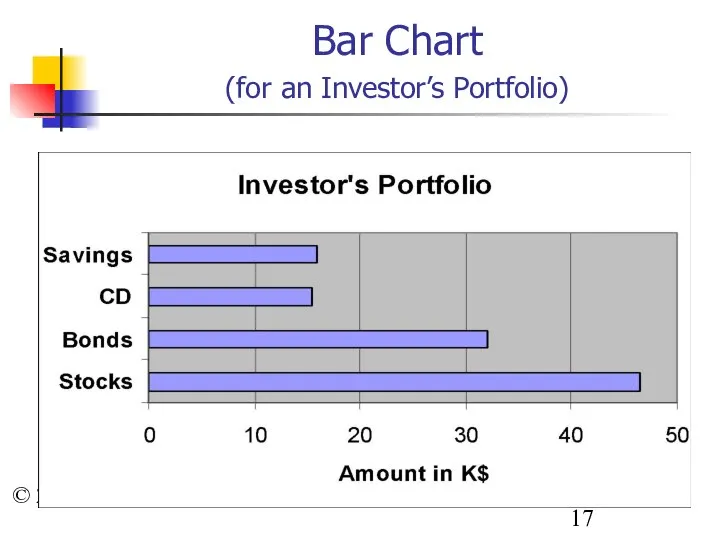
Bar Chart
(for an Investor’s Portfolio)
© 2002 Prentice-Hall, Inc.
Bar Chart
(for an Investor’s Portfolio)
© 2002 Prentice-Hall, Inc.
Pie Chart
(for an Investor’s Portfolio)
Percentages are
© 2002 Prentice-Hall, Inc.
Pie Chart
(for an Investor’s Portfolio)
Percentages are
© 2002 Prentice-Hall, Inc.
Pareto Diagram
Axis for line graph shows cumulative
© 2002 Prentice-Hall, Inc.
Pareto Diagram
Axis for line graph shows cumulative
© 2002 Prentice-Hall, Inc.
Tabulating and Graphing Bivariate Categorical Data
Contingency tables:
© 2002 Prentice-Hall, Inc.
Tabulating and Graphing Bivariate Categorical Data
Contingency tables:
© 2002 Prentice-Hall, Inc.
Tabulating and Graphing Bivariate Categorical Data
Side by
© 2002 Prentice-Hall, Inc.
Tabulating and Graphing Bivariate Categorical Data
Side by
© 2002 Prentice-Hall, Inc.
Principles of Graphical Excellence
Presents data in a
© 2002 Prentice-Hall, Inc.
Principles of Graphical Excellence
Presents data in a
© 2002 Prentice-Hall, Inc.
Using “chart junk”
Failing to provide a relative
© 2002 Prentice-Hall, Inc.
Using “chart junk”
Failing to provide a relative
© 2002 Prentice-Hall, Inc.
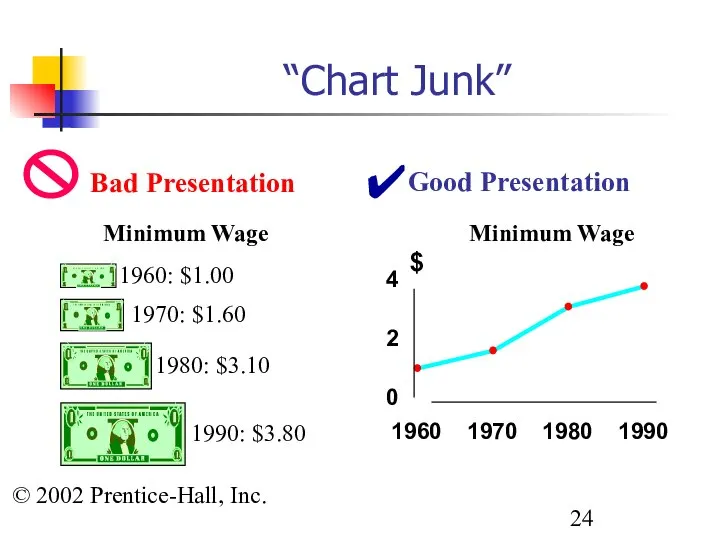
“Chart Junk”
Good Presentation
1960: $1.00
1970: $1.60
1980: $3.10
1990: $3.80
Minimum
© 2002 Prentice-Hall, Inc.
“Chart Junk”
Good Presentation
1960: $1.00
1970: $1.60
1980: $3.10
1990: $3.80
Minimum
© 2002 Prentice-Hall, Inc.
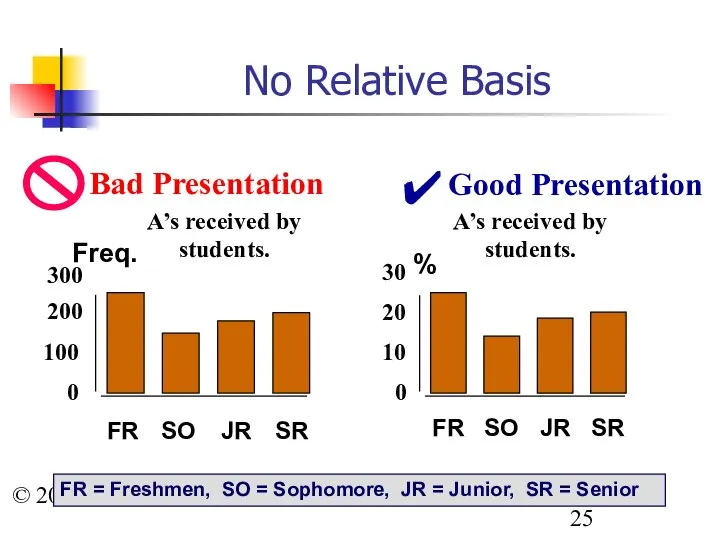
No Relative Basis
Good Presentation
A’s received by students.
A’s
© 2002 Prentice-Hall, Inc.
No Relative Basis
Good Presentation
A’s received by students.
A’s
© 2002 Prentice-Hall, Inc.
Compressing Vertical Axis
Good Presentation
Quarterly Sales
Quarterly Sales
Bad Presentation
0
25
50
Q1
Q2
Q3
Q4
$
0
100
200
Q1
Q2
Q3
Q4
$
✔
© 2002 Prentice-Hall, Inc.
Compressing Vertical Axis
Good Presentation
Quarterly Sales
Quarterly Sales
Bad Presentation
0
25
50
Q1
Q2
Q3
Q4
$
0
100
200
Q1
Q2
Q3
Q4
$
✔
© 2002 Prentice-Hall, Inc.
No Zero Point on Vertical Axis
Good Presentation
Monthly
© 2002 Prentice-Hall, Inc.
No Zero Point on Vertical Axis
Good Presentation
Monthly
© 2002 Prentice-Hall, Inc.
Chapter Summary
Organized numerical data
The ordered array and
© 2002 Prentice-Hall, Inc.
Chapter Summary
Organized numerical data
The ordered array and
 Средства телекоммуникационных технологий
 Стандартная Windows-программа Windows Movie Maker
 Электронная коммерция
 Задача на повторение. Проект. Создать программу, моделирующую работу электронного телефонного справочника
 Інформаційні продукти як результат інформаційно-аналітичної діяльності
 ПОСТРОЕНИЕ ДИАГРАММ В ЭЛЕКТРОННЫХ ТАБЛИЦАХ MS EXCEL
  Android Developer
 Организация запросов в SQL. Запрос на выборку данных из одной таблицы
 Контейнерные классы
 Ошибки в презентациях
 Файлы и файловая система
 Эстетика коммуникативного дизайна. Основы рекламной композиции
 №2 Организация сети с использованием коммутатора
 Министерство образования и науки Российской Федерации АКАДЕМИЯ МАРКЕТИНГА И СОЦИАЛЬНО-ИНФОРМАЦИОННЫХ ТЕХНОЛОГИЙ Факультет ПО и
  Разработка компьютерной 2D-игры
 Первая работа с Arduino
 Разработка web-сайта Интернет-магазин
 Электронная таблица Microsoft Excel 2010
 Фирменный бланк организации
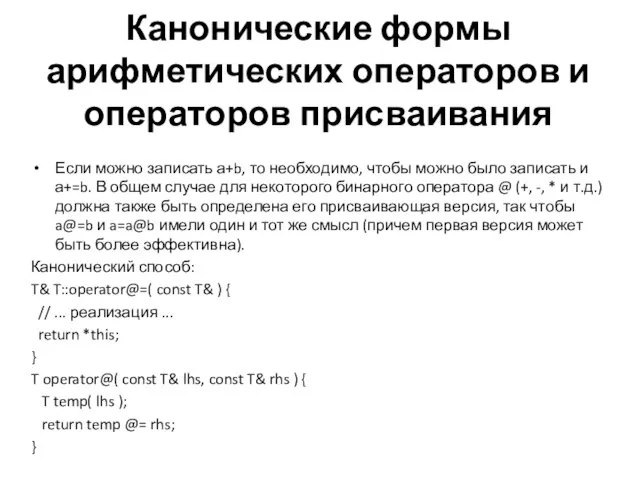 ООП 5. Канонические формы арифметических операторов и операторов присваивания
 Система управления базами данных. 9 класс
 Презентация "Електронна пошта" - скачать презентации по Информатике
 Списки. OpenOffice Writer. Обработка текстовой информации
 Приложение Delphi
 Вычисление суммы элементов массива. (Урок 43)
 Массивы. Классификация данных по структуре
 Электронные таблицы Microsoft Excel 2007 и Microsoft Word 2007
 Контент для приложения BMW START. Новые информационные блоки