- Pepsico international

Содержание
- 2. PepsiCo, Inc. is a global food, snack and beverage company founded in 1919. The Company's brands
- 3. (5 Year) Stock Market Performance Blue line – iShares S&P Global Consumer Staples (KXI) Red line
- 4. Technical Analysis Yahoo Finance 20 and 200 day moving average over a 5-year time horizon
- 5. Yahoo Finance 20 and 200 day moving average over a 2-year time horizon
- 6. Ownership Above 10 holders comprise 22.27% of shareholders’ ownership. Data as of 30th September, 2011, Financial
- 7. Macroeconomic Analysis Consumer spending: IBIS World estimates 2.6% compound growth in consumer spending from 2011 to
- 8. Industry Analysis Soda Production in the US: ~$17bn revenue, $2.5bn profit Performance Industry has been suffering
- 9. Industry Analysis (cont.) Snack Food Production in the US ~$28.4bn revenue, $5.9bn profit Performance Steady growth
- 10. Industry Analysis (cont.) Juice Production in the US ~$27bn revenue, $6.1bn profit Performance Recent performance has
- 11. Product Segments Source: Barclays “BTS” Consumer Conference, Sep 2011 http://www.pepsico.com/Download/Barclays_BTS_Presentation.pdf
- 12. 2010 Revenue Breakdown Source: Annual Report, Dec 2010
- 13. Global Markets Exposure About $20 billion or 31% of Revenue from emerging markets in 2010 Focus
- 14. Financial Performance 24% 5-year CAGR High operating margins and potential for growth 5-year Compounded Annual Growth
- 15. Savory Snacks Frito Lay’s World’s largest Food Brand $9.4bn Doritos $4 B, Cheetos $3.1 B, Ruffles
- 16. Beverages Source: Barclays “BTS” Consumer Conference, Sep 2011 http://www.pepsico.com/Download/Barclays_BTS_Presentation.pdf
- 17. Carbonated Soft Drinks Sustain powerhouse brands Sierra Mist, +7% in volume Mountain Dew, +2.5% in volume
- 18. Hydration & Nourishment Gatorade 11% Sales growth 77.3% Sports Drink market share Tropicana About 50% Sales
- 19. Nutrition Top 3 globally in Nutrition, aiming to be $30B business by 2020 Huge growth potential,
- 20. Recent Challenges and Concerns 2012 Pricing Strategy Commodity inflation and Demand elasticity Margins & Cost cutting
- 21. The Power of One Two powerful businesses worth $31B each Consumption: Planned together Bought together Consumed
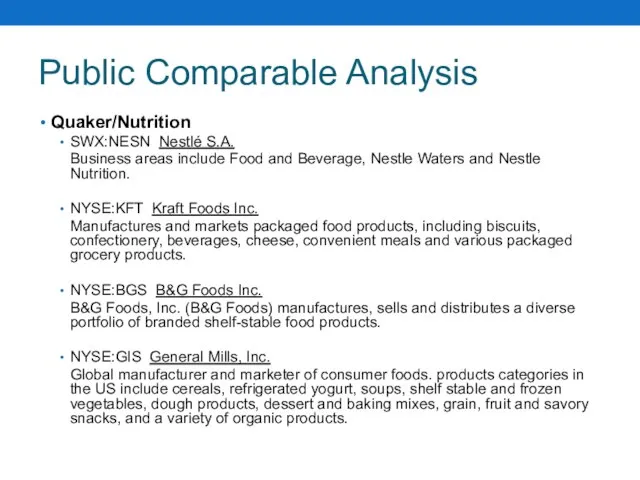
- 22. Public Comparable Analysis Quaker/Nutrition SWX:NESN Nestlé S.A. Business areas include Food and Beverage, Nestle Waters and
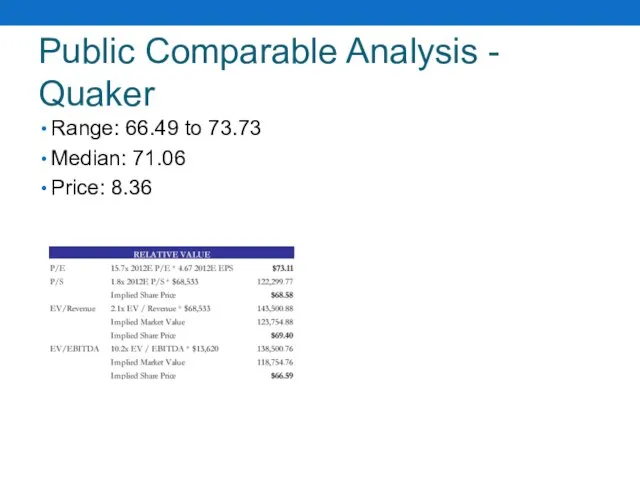
- 23. Public Comparable Analysis - Quaker Range: 66.49 to 73.73 Median: 71.06 Price: 8.36
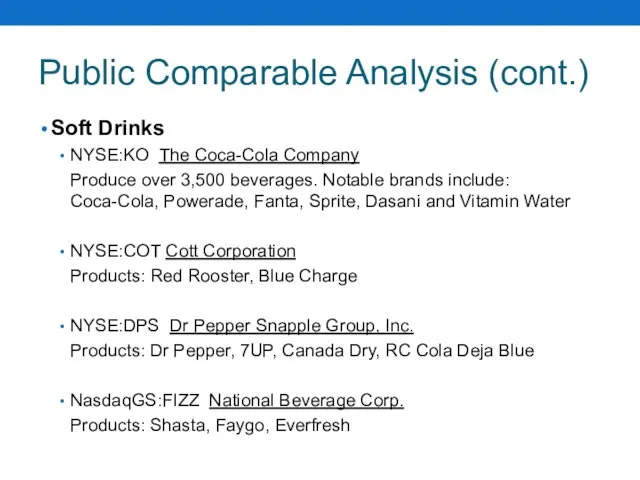
- 24. Public Comparable Analysis (cont.) Soft Drinks NYSE:KO The Coca-Cola Company Produce over 3,500 beverages. Notable brands
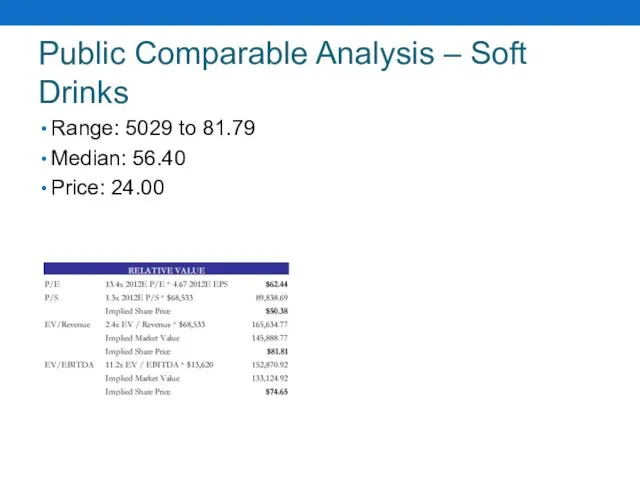
- 25. Public Comparable Analysis – Soft Drinks Range: 5029 to 81.79 Median: 56.40 Price: 24.00
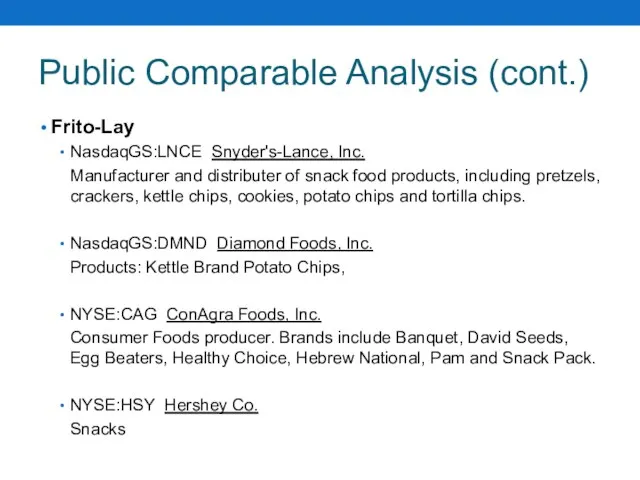
- 26. Public Comparable Analysis (cont.) Frito-Lay NasdaqGS:LNCE Snyder's-Lance, Inc. Manufacturer and distributer of snack food products, including
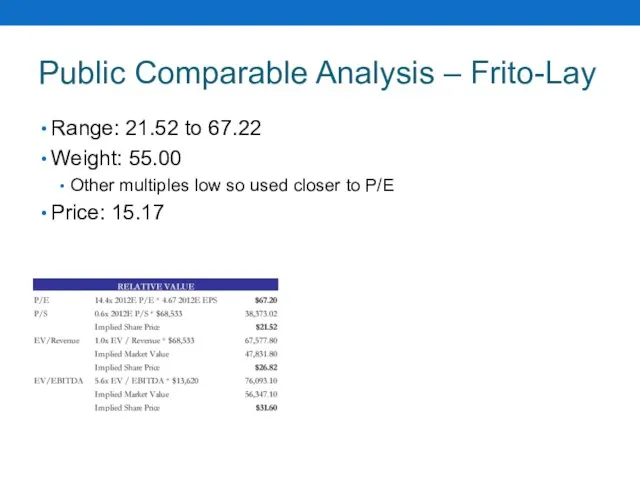
- 27. Public Comparable Analysis – Frito-Lay Range: 21.52 to 67.22 Weight: 55.00 Other multiples low so used
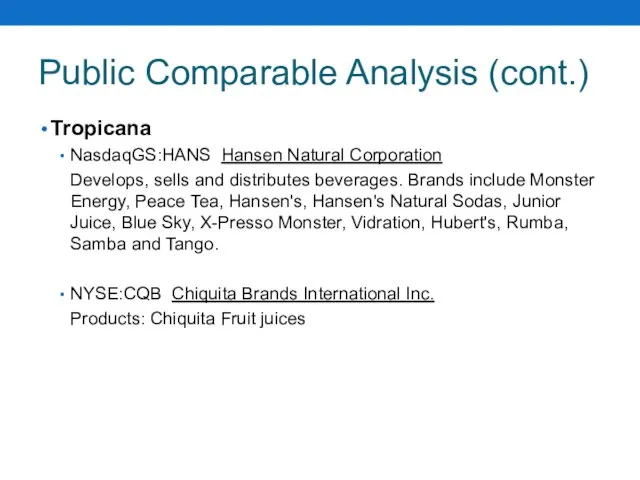
- 28. Public Comparable Analysis (cont.) Tropicana NasdaqGS:HANS Hansen Natural Corporation Develops, sells and distributes beverages. Brands include
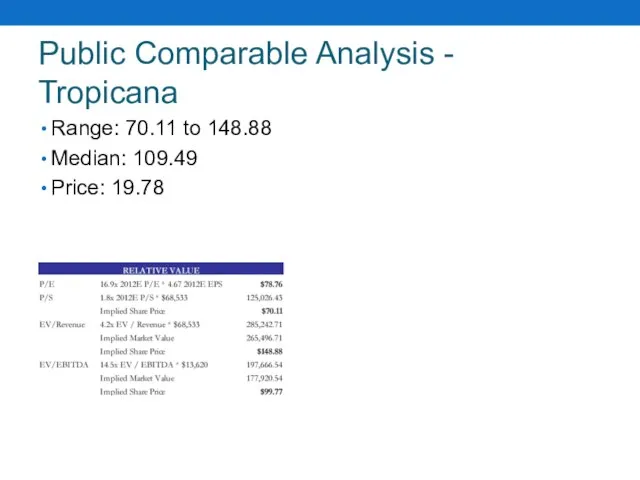
- 29. Public Comparable Analysis - Tropicana Range: 70.11 to 148.88 Median: 109.49 Price: 19.78
- 31. Скачать презентацию
PepsiCo, Inc. is a global food, snack and beverage company founded
PepsiCo, Inc. is a global food, snack and beverage company founded
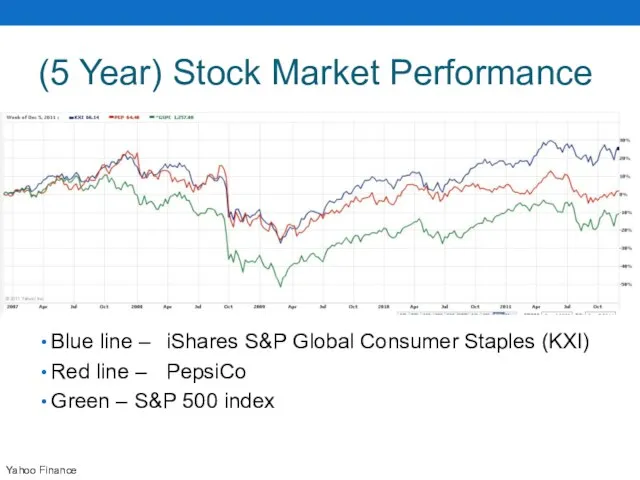
(5 Year) Stock Market Performance
Blue line – iShares S&P Global Consumer Staples (KXI)
Red
(5 Year) Stock Market Performance
Blue line – iShares S&P Global Consumer Staples (KXI)
Red
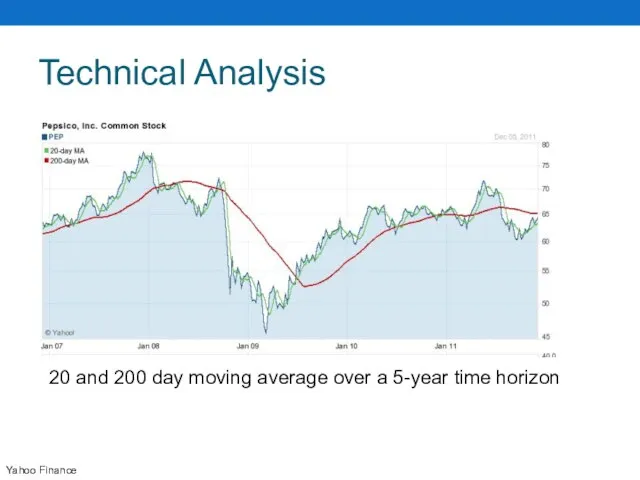
Technical Analysis
Yahoo Finance
20 and 200 day moving average over a 5-year
Technical Analysis
Yahoo Finance
20 and 200 day moving average over a 5-year
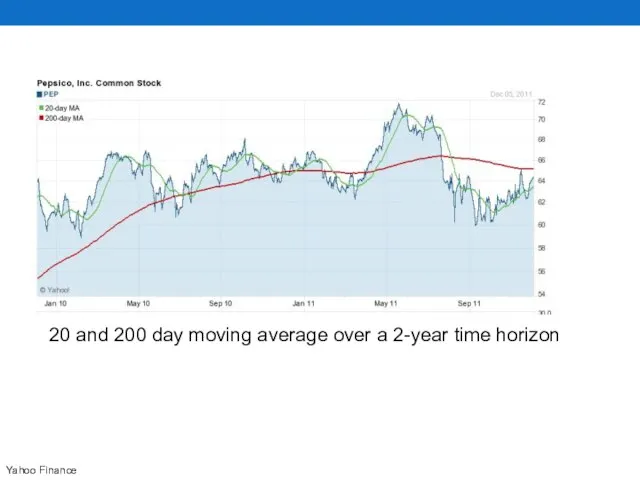
Yahoo Finance
20 and 200 day moving average over a 2-year time
Yahoo Finance
20 and 200 day moving average over a 2-year time
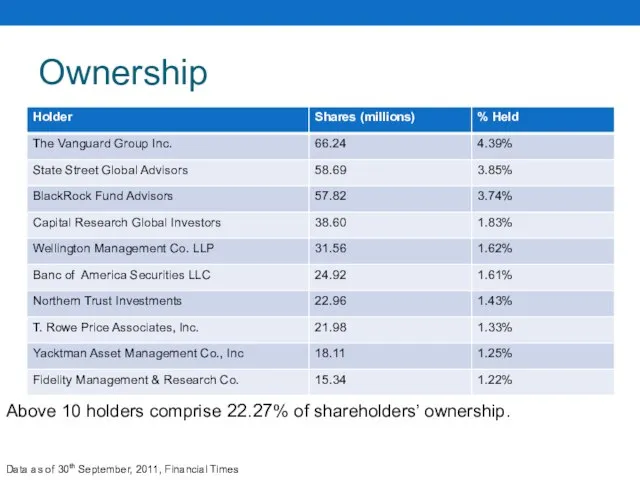
Ownership
Above 10 holders comprise 22.27% of shareholders’ ownership.
Data as of 30th
Ownership
Above 10 holders comprise 22.27% of shareholders’ ownership.
Data as of 30th
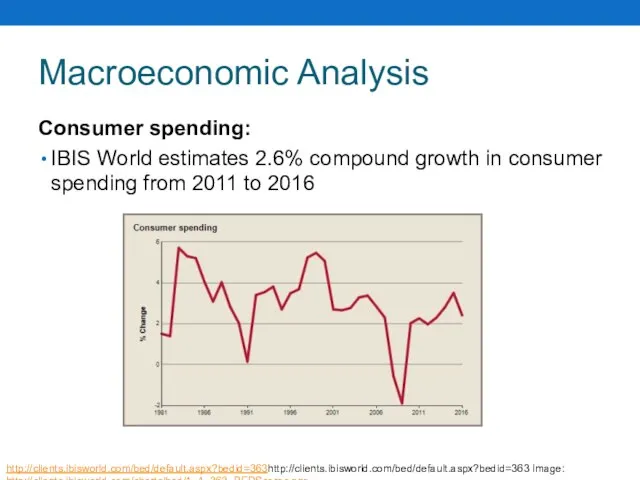
Macroeconomic Analysis
Consumer spending:
IBIS World estimates 2.6% compound growth in consumer spending
Macroeconomic Analysis
Consumer spending:
IBIS World estimates 2.6% compound growth in consumer spending
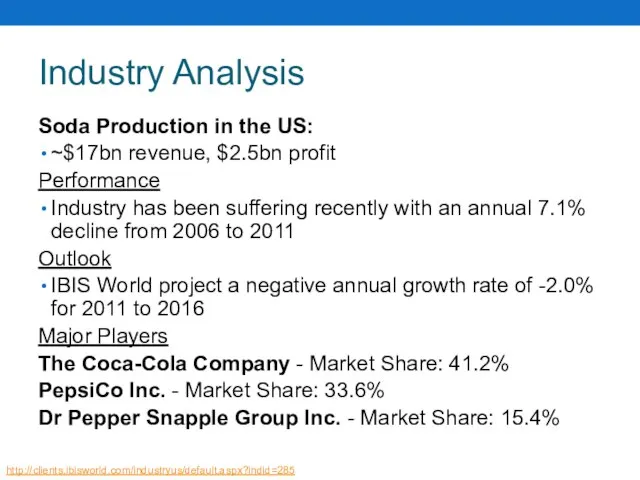
Industry Analysis
Soda Production in the US:
~$17bn revenue, $2.5bn profit
Performance
Industry has been
Industry Analysis
Soda Production in the US:
~$17bn revenue, $2.5bn profit
Performance
Industry has been
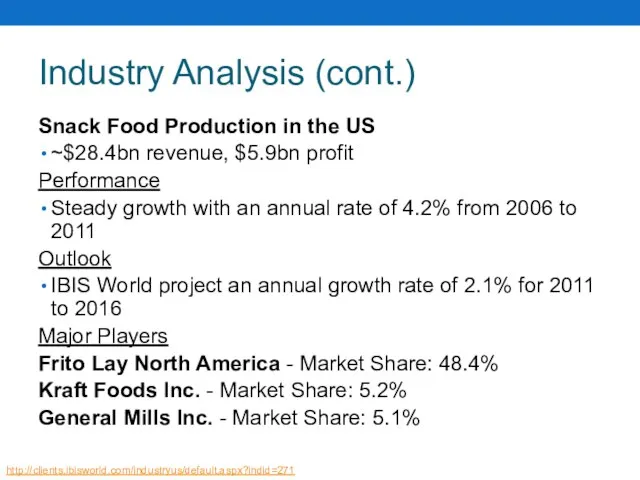
Industry Analysis (cont.)
Snack Food Production in the US
~$28.4bn revenue, $5.9bn profit
Performance
Steady
Industry Analysis (cont.)
Snack Food Production in the US
~$28.4bn revenue, $5.9bn profit
Performance
Steady
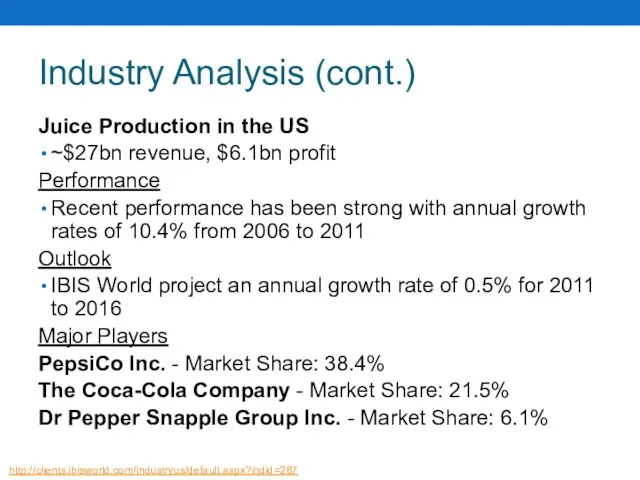
Industry Analysis (cont.)
Juice Production in the US
~$27bn revenue, $6.1bn profit
Performance
Recent performance
Industry Analysis (cont.)
Juice Production in the US
~$27bn revenue, $6.1bn profit
Performance
Recent performance
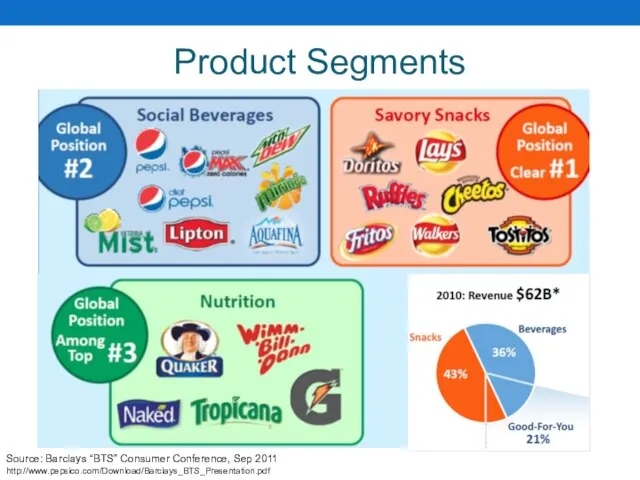
Product Segments
Source: Barclays “BTS” Consumer Conference, Sep 2011
http://www.pepsico.com/Download/Barclays_BTS_Presentation.pdf
Product Segments
Source: Barclays “BTS” Consumer Conference, Sep 2011
http://www.pepsico.com/Download/Barclays_BTS_Presentation.pdf
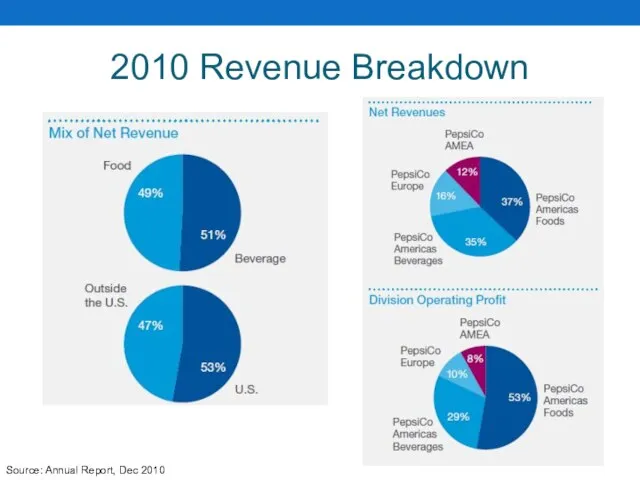
2010 Revenue Breakdown
Source: Annual Report, Dec 2010
2010 Revenue Breakdown
Source: Annual Report, Dec 2010
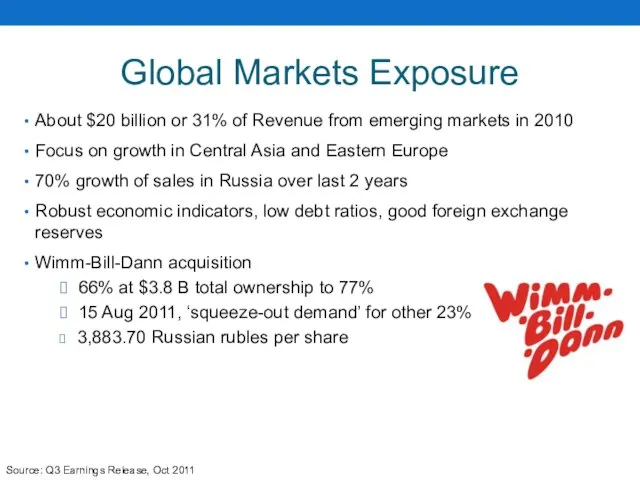
Global Markets Exposure
About $20 billion or 31% of Revenue from emerging
Global Markets Exposure
About $20 billion or 31% of Revenue from emerging
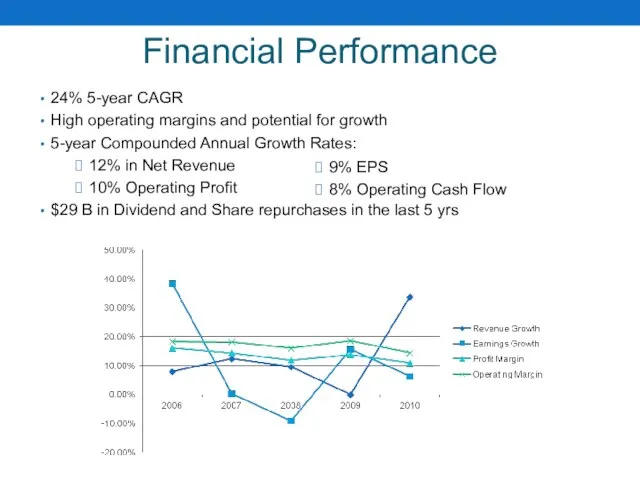
Financial Performance
24% 5-year CAGR
High operating margins and potential for growth
5-year Compounded
Financial Performance
24% 5-year CAGR
High operating margins and potential for growth
5-year Compounded
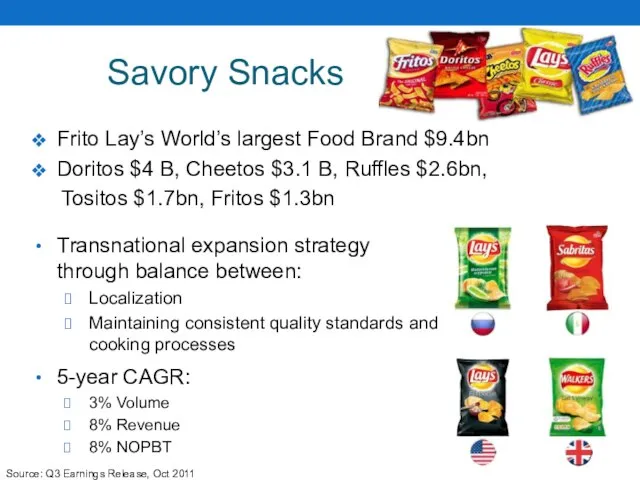
Savory Snacks
Frito Lay’s World’s largest Food Brand $9.4bn
Doritos
Savory Snacks
Frito Lay’s World’s largest Food Brand $9.4bn
Doritos
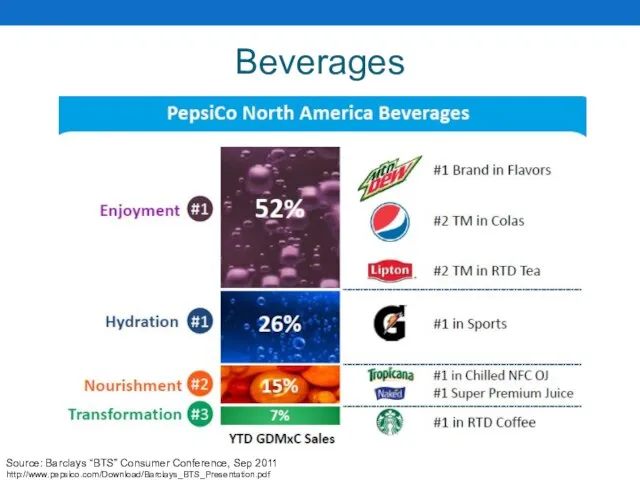
Beverages
Source: Barclays “BTS” Consumer Conference, Sep 2011
http://www.pepsico.com/Download/Barclays_BTS_Presentation.pdf
Beverages
Source: Barclays “BTS” Consumer Conference, Sep 2011
http://www.pepsico.com/Download/Barclays_BTS_Presentation.pdf
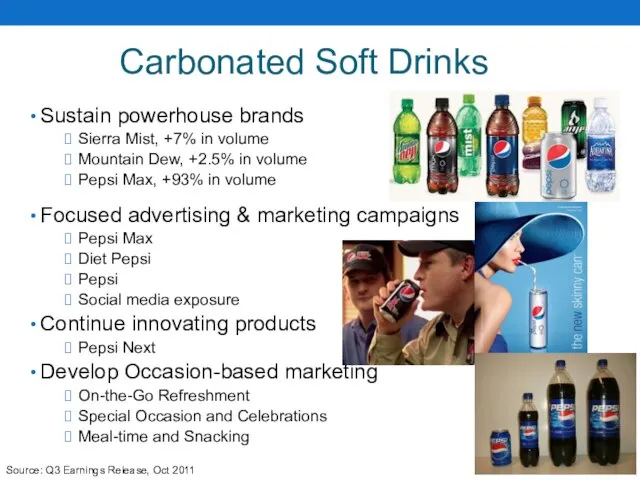
Carbonated Soft Drinks
Sustain powerhouse brands
Sierra Mist, +7% in volume
Mountain Dew, +2.5%
Carbonated Soft Drinks
Sustain powerhouse brands
Sierra Mist, +7% in volume
Mountain Dew, +2.5%
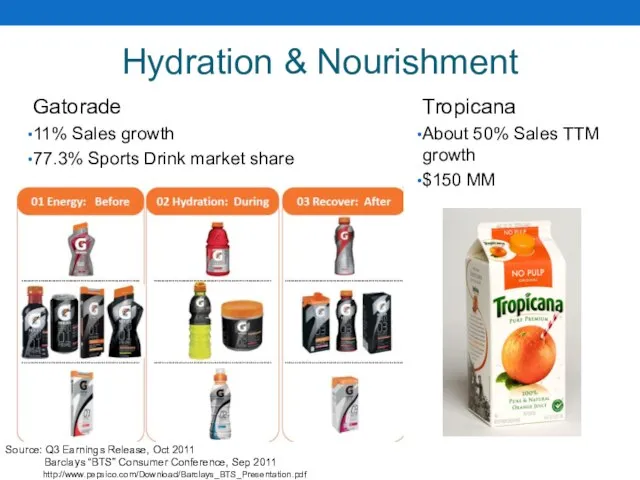
Hydration & Nourishment
Gatorade
11% Sales growth
77.3% Sports Drink market share
Tropicana
About 50% Sales
Hydration & Nourishment
Gatorade
11% Sales growth
77.3% Sports Drink market share
Tropicana
About 50% Sales
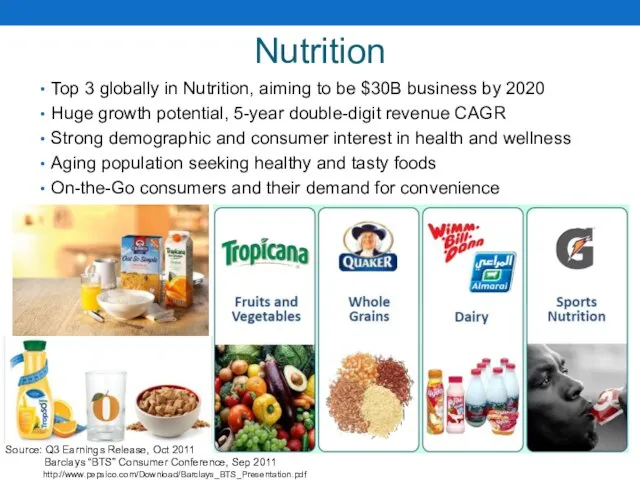
Nutrition
Top 3 globally in Nutrition, aiming to be $30B business by
Nutrition
Top 3 globally in Nutrition, aiming to be $30B business by
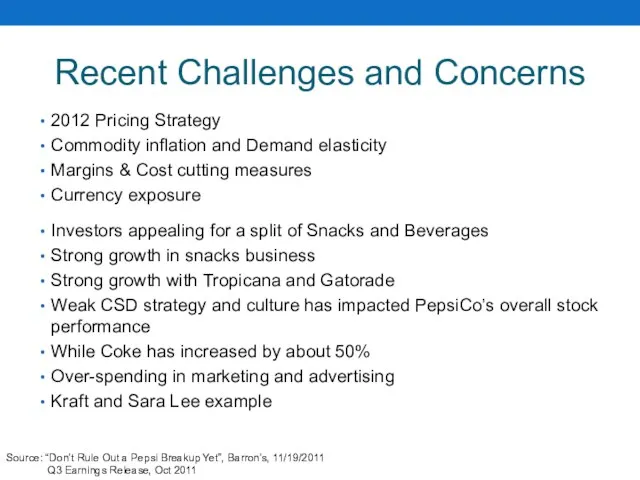
Recent Challenges and Concerns
2012 Pricing Strategy
Commodity inflation and Demand elasticity
Margins &
Recent Challenges and Concerns
2012 Pricing Strategy
Commodity inflation and Demand elasticity
Margins &
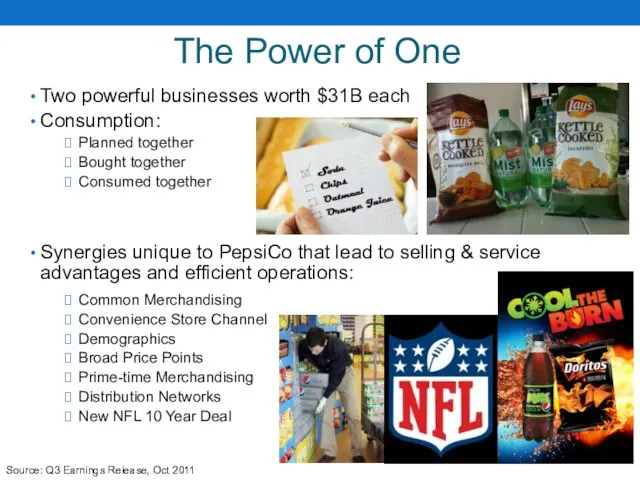
The Power of One
Two powerful businesses worth $31B each
Consumption:
Planned together
Bought together
Consumed
The Power of One
Two powerful businesses worth $31B each
Consumption:
Planned together
Bought together
Consumed
Public Comparable Analysis
Quaker/Nutrition
SWX:NESN Nestlé S.A.
Business areas include Food and Beverage,
Public Comparable Analysis
Quaker/Nutrition
SWX:NESN Nestlé S.A.
Business areas include Food and Beverage,
Public Comparable Analysis - Quaker
Range: 66.49 to 73.73
Median: 71.06
Price: 8.36
Public Comparable Analysis - Quaker
Range: 66.49 to 73.73
Median: 71.06
Price: 8.36
Public Comparable Analysis (cont.)
Soft Drinks
NYSE:KO The Coca-Cola Company
Produce over
Public Comparable Analysis (cont.)
Soft Drinks
NYSE:KO The Coca-Cola Company
Produce over
Public Comparable Analysis – Soft Drinks
Range: 5029 to 81.79
Median: 56.40
Price: 24.00
Public Comparable Analysis – Soft Drinks
Range: 5029 to 81.79
Median: 56.40
Price: 24.00
Public Comparable Analysis (cont.)
Frito-Lay
NasdaqGS:LNCE Snyder's-Lance, Inc.
Manufacturer and distributer of
Public Comparable Analysis (cont.)
Frito-Lay
NasdaqGS:LNCE Snyder's-Lance, Inc.
Manufacturer and distributer of
Public Comparable Analysis – Frito-Lay
Range: 21.52 to 67.22
Weight: 55.00
Other multiples low
Public Comparable Analysis – Frito-Lay
Range: 21.52 to 67.22
Weight: 55.00
Other multiples low
Public Comparable Analysis (cont.)
Tropicana
NasdaqGS:HANS Hansen Natural Corporation
Develops, sells and
Public Comparable Analysis (cont.)
Tropicana
NasdaqGS:HANS Hansen Natural Corporation
Develops, sells and
Public Comparable Analysis - Tropicana
Range: 70.11 to 148.88
Median: 109.49
Price: 19.78
Public Comparable Analysis - Tropicana
Range: 70.11 to 148.88
Median: 109.49
Price: 19.78
 Автоинструмент
 Motorcycles of Yamaha. Accessory line-up
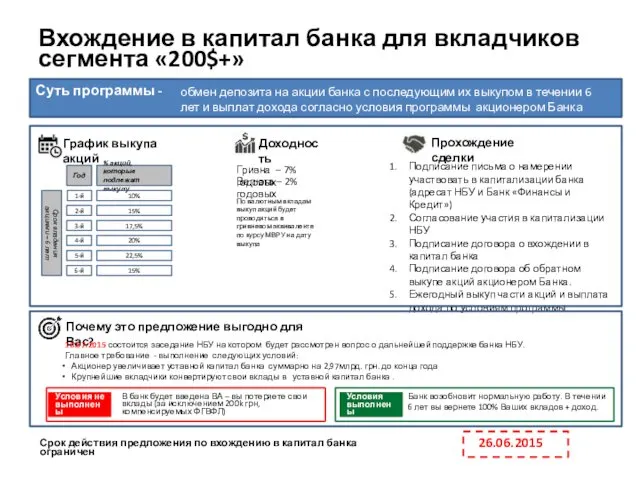 Программа докапитализации Банка
 Система маркетинговых исследований и маркетинговая информация
 Casey Conrad. Оптимизация локальной поисковой системы (SEO)
 Pushka Street – летнее арт-пространство для отдыха
 Discover the World in One University
 Друк сервис - типография вашего успеха
 Элементы питания Maxell
 MeViCS it’s healthcare gadget that control your spine while you are working or sitting
 Студия мероприятий Orizzonte Studio
 Доширак со вкусом Шаурма
 Фабрика мебели Happy home
 Проект Яндекс. Такси Яндекс. Таксометр
 Triple A Leader
 Стратегическое планирование и роль маркетинга
 Выездной ретрит расслабления и сонастройки с собой
 Бренд NEOCUTIS
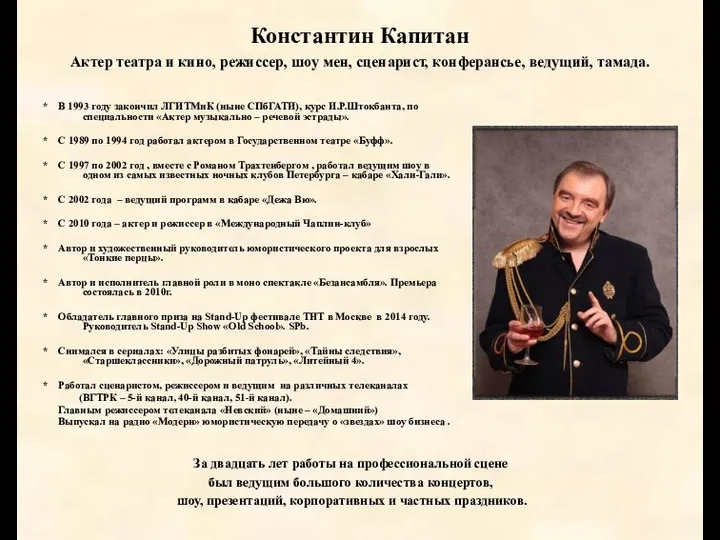 Константин Капитан. Актер театра и кино, режиссер, шоумен, сценарист, конферансье, ведущий, тамада
 Конференция профессионалов сферы гостеприимства Туризм в регионе. Перспективы развития
 Образец для дилеров автоцентра
 Развитие механизмов резервирования товаров и давальческих материалов
 Черное море зовет. 12-дневное путешествие. Автономная некоммерческая организация Центр эффективных технологий образования
 Дослідження упаковки
 Образы в рекламе
 Сухой экструдированный корм для собак супер-премиум класса Blitz
 Организация производства и продаж прибора для неинвазивного (чрезкожного) мониторинга содержания сахара в крови человека
 Типы, виды и функции рекламы